Classification Problems
The first section and the definition of a decision boundary moved here from Logistic Regression, whose Source note lists that page’s sources. The definition of a decision region moved here from Support Vector Machines.
1 Predicting a category
Linear regression predicts a number. A great many questions are not about a number: whether a patient recovers, whether an email is spam, which of ten digits a scan shows.
Let the data be \(\mathcal{X} = \set{(\vx_1, y_1), \ldots, (\vx_n, y_n)}\) with \(\vx_i \in \reals^{\ninputvars}\) and \(y_i\) a label rather than a measurement. Two labels is binary classification; more than two is multi-class classification.
We could predict the label directly, with a classification rule that maps each feature vector to one of the classes. Predicting \(\Prf{Y = 1 \mid \vx}\) gives more information. A predicted class label names only a class; a predicted probability also measures how likely each class is, so whoever uses the prediction can choose how to act on it, for instance with a threshold that reflects the cost of each kind of error.
Hutchinson teaches classification and decision boundaries (6 min) [1]. The video site requires a login, which enrolled students find in the syllabus.
2 Decision regions and boundaries
A classification rule splits the set of all feature vectors into pieces, one for each class that it predicts.
Definition 1 (Decision region) The decision region of a class \(k\) under a classification rule \(c\) is the set of feature vectors that \(c\) assigns to \(k\):
\[ \setbuild{\vx}{c(\vx) = k}. \]
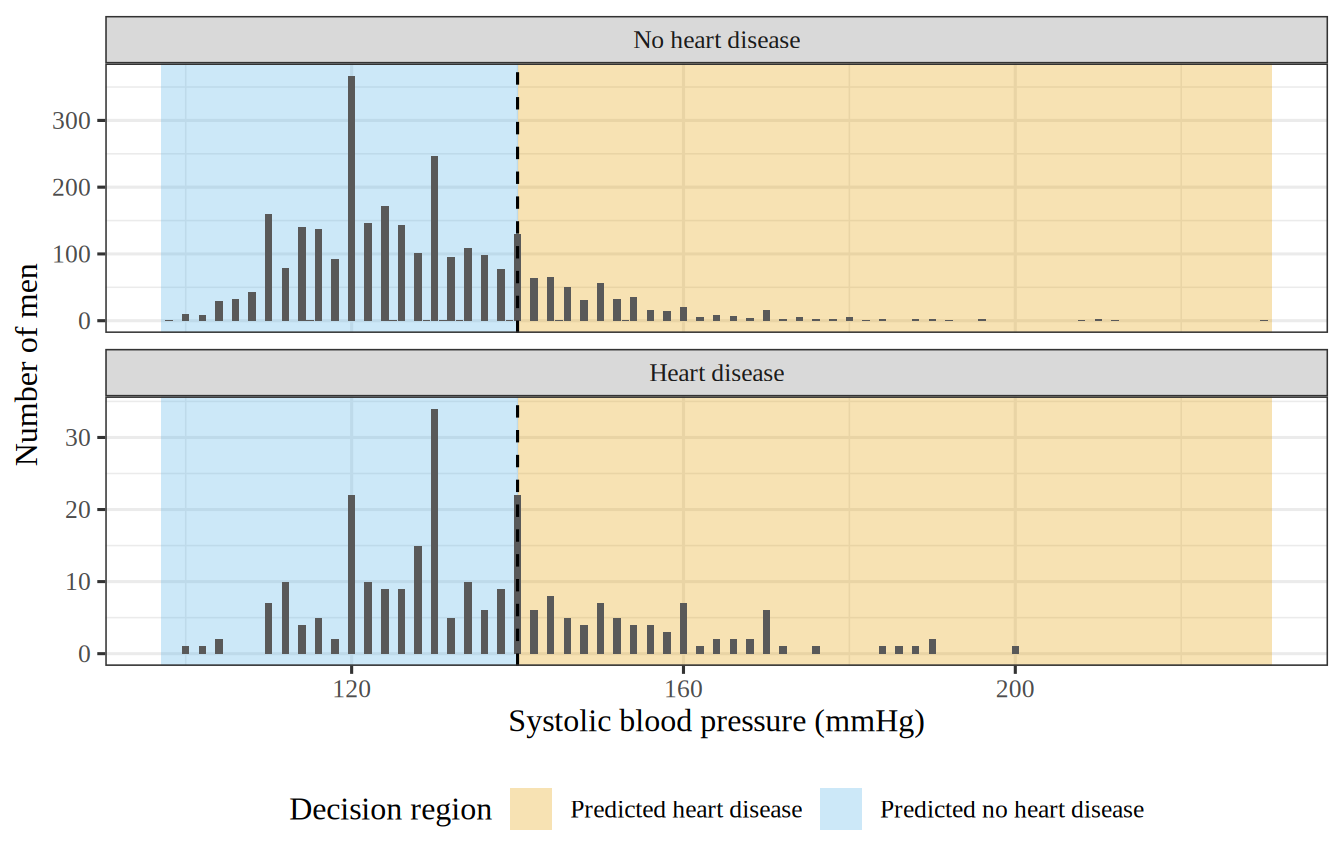
Example 1 (Decision regions of a blood-pressure rule) A cohort study, the Western Collaborative Group Study [2], followed 3154 middle-aged men for coronary heart disease, and recorded each man’s systolic blood pressure \(\predvar\), in mmHg. Let the classification rule \(c\) predict heart disease (\(c(\predvar) = 1\)) when \(\predvar \ge 140\), and no heart disease (\(c(\predvar) = 0\)) otherwise. We chose the cutoff 140 mmHg by hand, as a round number in the upper part of the data; logistic regression instead fits a classifier to data. The decision region of class \(1\) is \(\setbuild{\predvar}{\predvar \ge 140}\), and the decision region of class \(0\) is \(\setbuild{\predvar}{\predvar < 140}\). 693 of the men are in the first region, and 2461 are in the second. Figure 1 shades the two regions over the men’s blood pressures, with one bar for each recorded pressure.
Show code
outcome_levels <- c("No heart disease", "Heart disease")
outcome <- ifelse(wcgs$chd == 1, "Heart disease", "No heart disease")
wcgs$outcome <- factor(outcome, outcome_levels)
sbp_range <- range(wcgs$sbp)
region_names <- c("Predicted no heart disease", "Predicted heart disease")
region_starts <- c(sbp_range[1] - 1, sbp_cutoff)
region_ends <- c(sbp_cutoff, sbp_range[2] + 1)
regions <- tibble::tibble(
  xmin = region_starts,
  xmax = region_ends,
  region = region_names
)
region_fill <- c(
  "Predicted no heart disease" = "#56B4E9",
  "Predicted heart disease" = "#E69F00"
)
region_aes <- ggplot2::aes(
  xmin = xmin, xmax = xmax, ymin = -Inf, ymax = Inf, fill = region
)
panels <- ggplot2::vars(outcome)
wcgs |>
  ggplot2::ggplot() +
  ggplot2::aes(x = sbp) +
  ggplot2::geom_rect(
    region_aes,
    data = regions,
    inherit.aes = FALSE,
    alpha = 0.3
  ) +
  ggplot2::geom_bar() +
  ggplot2::geom_vline(xintercept = sbp_cutoff, linetype = "dashed") +
  ggplot2::facet_wrap(panels, ncol = 1, scales = "free_y") +
  ggplot2::scale_fill_manual(values = region_fill) +
  ggplot2::labs(
    x = "Systolic blood pressure (mmHg)",
    y = "Number of men",
    fill = "Decision region"
  )
Definition 2 (Decision boundary) The decision boundary of a classifier is the set of feature vectors that separates the decision regions where it predicts different classes.
3 How often a rule is wrong
The error rate of a classification rule counts how often it misclassifies. Example 5 and Example 6 compute it for two rules on the men of the Western Collaborative Group Study.
4 Where the course goes next
Logistic Regression fits a classifier to data, instead of choosing its cutoff by hand. The Metrics page reports how often a classifier’s predictions are wrong.