Show code
# The Python chunks on this page import numpy and pandas; reticulate provisions them.
# The Julia chunks run through JuliaCall.
reticulate::py_require(c("numpy", "pandas", "scipy"))# The Python chunks on this page import numpy and pandas; reticulate provisions them.
# The Julia chunks run through JuliaCall.
reticulate::py_require(c("numpy", "pandas", "scipy"))Adapted from Kameron Decker Harris’ 2022 weekly notes.
A First Model and Generalization introduced the training, validation and test split. It noted that cross-validation (CV) is the alternative when we cannot afford a dedicated validation set. This chapter covers that alternative, and how to tune without overfitting. Choosing among candidates with a validation set or with cross-validation is model selection [1]. These notes say validation set throughout; some sources call the same thing a development set or dev set, and the names are interchangeable.
A hyperparameter is a parameter that controls the structure of the model. We choose it, rather than learning it from the data. Three examples follow, one we have met and two still ahead:
\(\regpar\) — ridge and lasso, in Regularization
\(K\) — the number of neighbors in K-nearest neighbors, in Non-Parametric Models
\(\bandwidth\) — the kernel bandwidth, in Non-Parametric Models: \(k(r) \propto \expf{\dfrac{-r^2}{2\bandwidth^2}}\) for a distance \(r\)
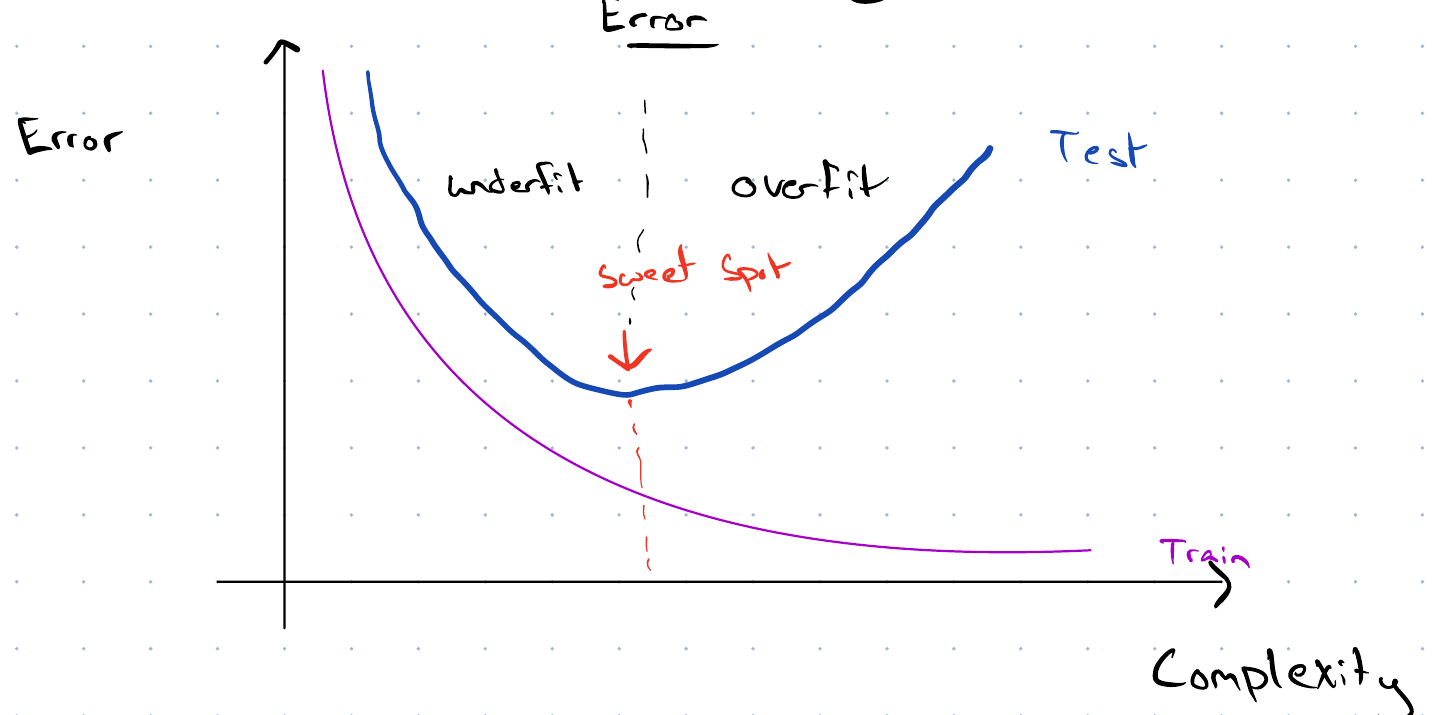
Complexity grows with the number of parameters, and with \(\dfrac{1}{\regpar}\) for a penalized model.

Hutchinson covers train, dev and test sets, cross-validation and model selection, Generalization, part 2 (11 min) [3]. The video site requires a login, which enrolled students find in the syllabus.
The empirical risk on the training set cannot choose between a model and a larger one that contains it. That is why we need held-out data.
Theorem 1 (A larger model family never has a larger minimum empirical risk) Let \(\predfam_1 \subseteq \predfam_2\) be two prediction function families, and let \(\trainset\) be a training set. For any loss, the smallest empirical risk over \(\predfam_2\) is at most the smallest over \(\predfam_1\):
\[ \min_{h \in \predfam_2} \empriskf{h; \trainset} \le \min_{h \in \predfam_1} \empriskf{h; \trainset} . \tag{1}\]
The minima are assumed to exist.
Proof. Every \(h \in \predfam_1\) is also in \(\predfam_2\), so the minimum over \(\predfam_2\) ranges over every model the minimum over \(\predfam_1\) does, and possibly more.
Remark 1 (Training risk cannot choose between nested models). By Theorem 1, the training risk ranks nested models by size alone: the largest model always wins or ties, whether or not its extra terms help, as Example 2 shows. Choosing among models therefore needs an estimate of the risk on new data, which is what held-out data and cross-validation supply, or a penalty on size, as Regularization does for the coefficients.
The theorem is about the minimum over each family, for the data the model was fit to. It does not say the larger model’s risk on new data is lower, and the held-out error can end higher, as Example 2 shows.
The simplest split is one training set and one test set.



We assume all data points are independent and identically distributed (IID). A single split has three problems:
The split shrinks the training set.
A random draw picks the validation and test sets.
The resulting error estimate can have high variance.
Hastie and Tibshirani describe the validation-set approach, from 8:11, and its drawbacks, from 13:14 [2], video 5.1.
Abu-Mostafa covers model selection with a validation set in his lecture on validation, from 30:47 [5], Lecture 13.
The CS229 lecture covers data splits, models and cross-validation [6], Lecture 8.
Lall compares validation approaches in his EE104 lecture on validation, from 14:20 [7], Lecture 4.
Here \(K\) is the number of folds. It has nothing to do with the \(K\) in K-nearest neighbors, listed in Section 1. Both names are standard, so we reuse the letter.
We divide the data into \(K\) blocks. Here \(K=4\):
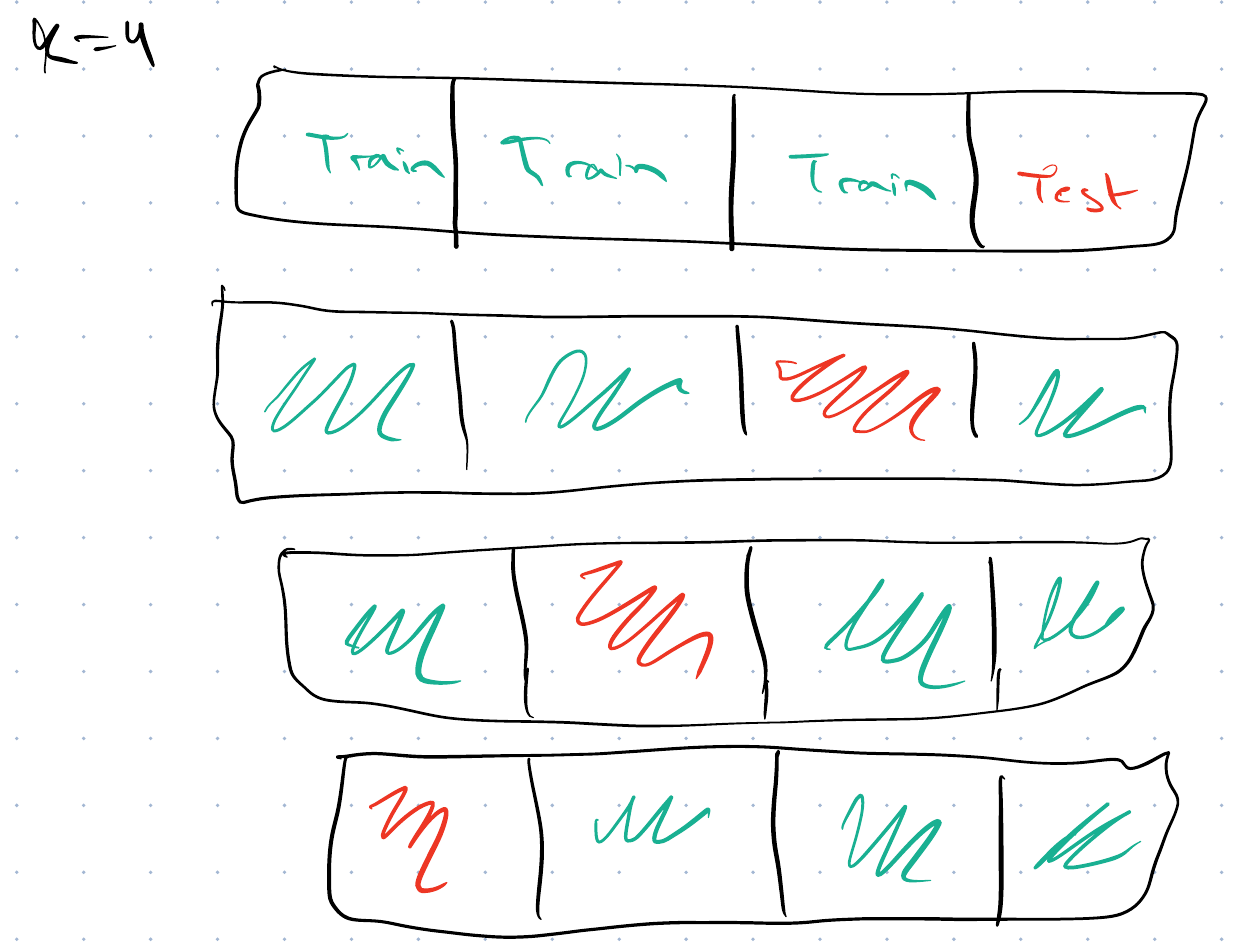
Train blocks and test block rotate across the \(K=4\) folds, and we average the errors, which estimates the risk of the fitted model:
\(\dfrac{1}{K}\sum\limits_{i=1}^{K} \text{error}_i\)
Averaging lowers the variance of the error estimate.
Pros: lower variance
Cons: we fit \(K\) models, which is costly. A small \(K\) might not be reliable.
The extreme case is \(K = n\): each fold holds out a single data point.
Abu-Mostafa explains leave-one-out cross-validation, from 49:03 [5], Lecture 13.
Starmer explains \(K\)-fold cross-validation [8].
Abu-Mostafa explains \(K\)-fold cross-validation, from 1:06:25 [5], Lecture 13.
Lall covers cross-validation in his EE104 lecture on validation, from 36:24 [7], Lecture 4.
GeeksforGeeks explains cross-validation [9], including \(K\)-fold and leave-one-out.
The University of Washington’s CSE 446 slides cover train-test splits and cross-validation [10], Lecture 5.
The number of folds \(k\) trades the bias of the estimate against its variance. Common choices are \(k = 5\) and \(k = 10\) [11, Sec. 5.1.4], [12, Sec. 7.10]. The statistics notes give a short version. The divs below define the variance of the estimate, then give the bias and the variance side of the trade.
Definition 1 (Variance of the cross-validation estimate) The variance of the cross-validation estimate is the variance of the \(k\)-fold cross-validation estimate \(\hR_{k\text{-fold}}\) over training sets \(\trainset\) of the same size:
\[ \Var{\hR_{k\text{-fold}}} = \Expfc{\trainset}{\sqf{\hR_{k\text{-fold}} - \Expfc{\trainset}{\hR_{k\text{-fold}}}}} . \tag{2}\]
In words, it is the expected squared distance of the estimate from its own mean over training sets. It says how far the estimate moves when the data are redrawn. It is not the variance of a prediction, which says how far the prediction of one fitted model moves.
Remark 2 (Fewer folds make the estimate too pessimistic). Each of the \(k\) fits in \(k\)-fold cross-validation uses a fraction \((k - 1)/k\) of the data. The estimate therefore scores models fitted to fewer observations than the model we will actually use. A model fitted to less data usually has a larger risk, so the estimate tends to overshoot the risk of the model fitted to all of the data. In other words, the estimate has a positive bias as an estimator of that risk.
The bias shrinks as \(k\) grows. Leave-one-out cross-validation fits each model to \(n - 1\) of the \(n\) observations, so it has the smallest bias of the choices of \(k\) [11, Sec. 5.1.4], [12, Sec. 7.10].
Remark 3 (Why leave-one-out may have a higher variance (a heuristic)). One reason to suspect that the variance of the cross-validation estimate grows with \(k\) is a heuristic about the correlation of fold errors. A heuristic is not a theorem.
Let:
Assume:
The variance of a mean of \(k\) terms is the sum of their \(k\) variances and \(k(k - 1)\) covariances, divided by \(k^2\):
\[ \Var{\hR_{k\text{-fold}}} = \frac{1}{k^2} \paren{k \varpar + k(k - 1) \bar{\corpar} \varpar} = \frac{\varpar}{k} \paren{1 + (k - 1) \bar{\corpar}} . \tag{3}\]
In words: if the fold errors were uncorrelated (\(\bar{\corpar} = 0\)), averaging them would divide their variance by \(k\). If they were perfectly correlated (\(\bar{\corpar} = 1\)), averaging would not reduce the variance at all.
The heuristic is about \(\bar{\corpar}\). In leave-one-out cross-validation, any two of the \(n\) training sets share \(n - 2\) observations, so the \(n\) fitted models are nearly identical. Their errors may then be strongly correlated, and the average would barely be less variable than one error [12, Sec. 7.10]. For smaller \(k\), the training sets overlap less, so \(\bar{\corpar}\) may be smaller.
The argument is only a heuristic for two reasons. First, \(\varpar\) and \(\bar{\corpar}\) both depend on \(k\), because the fold size changes with \(k\). Second, how correlated the errors are depends on how much the fitted model changes when one observation changes. No estimator of the variance of \(k\)-fold cross-validation is unbiased in general [13], so \(\bar{\corpar}\) is hard to check from a single data set.
Together with the bias of small \(k\), this is the usual reason to choose \(k = 5\) or \(k = 10\): the estimates are neither strongly biased nor, in practice, very variable [11, Sec. 5.1.4], [12, Sec. 7.10].
With \(K = 4\):

4-fold cross-validation
Average the test errors
vs.
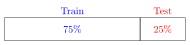
No. Random sampling means the second scenario might not test on 100% of the data. It may also resample points from the test set.
Hastie and Tibshirani describe the bootstrap, which also resamples the data [2], video 5.4.
GeeksforGeeks explains the bootstrap [14].
Exercise 1 (Choosing a polynomial degree for fuel economy) The Auto data give the fuel economy (mpg) and engine horsepower of 392 cars [4, Sec. 5.3].
For each degree from 1 to 8, fit a polynomial regression of mpg on horsepower. Estimate the test sRMSE of each degree with 10-fold cross-validation.
Exercise 2 (Choosing a polynomial degree for fuel economy (part 2)) Use the setup of Exercise 1.
Give a 95% confidence interval for each estimate.
Exercise 3 (Choosing a polynomial degree for fuel economy (part 3)) Use the setup of Exercise 1.
library(ggplot2)
ggplot(cv_df, aes(degree, cv_rmse)) +
  geom_line() +
  geom_pointrange(aes(ymin = lower, ymax = upper)) +
  geom_point(data = cv_df[cv_df$degree == best, ], shape = 1, size = 5) +
  scale_x_continuous(breaks = degrees) +
  labs(x = "polynomial degree", y = "10-fold CV estimate of test sRMSE (mpg)")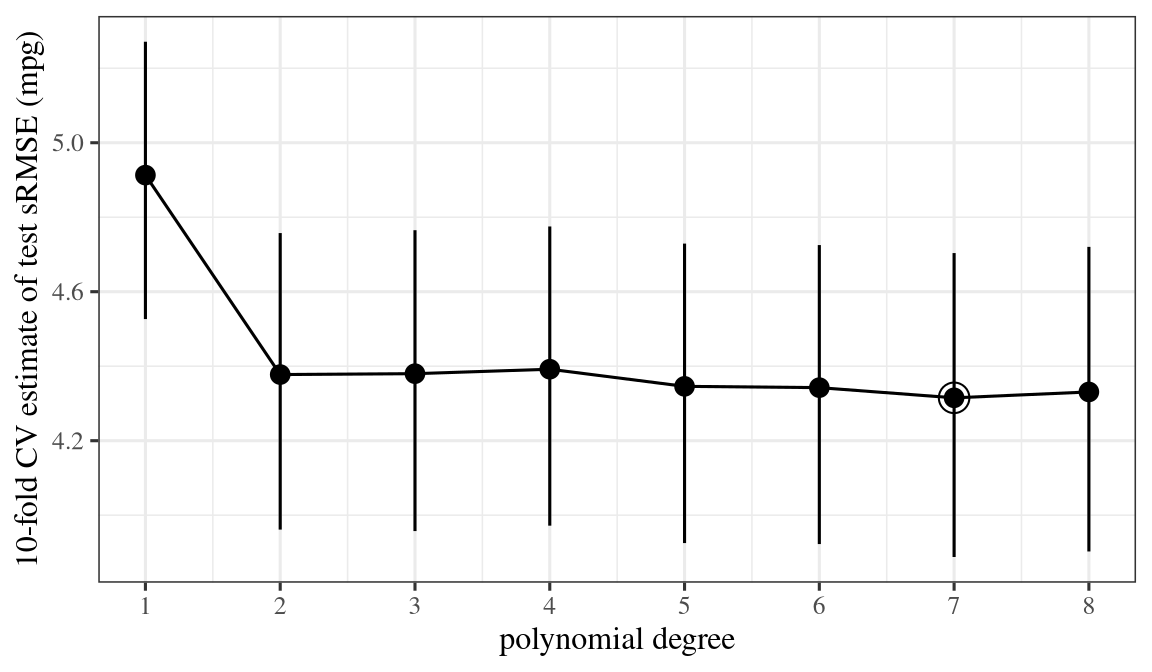
Exercise 4 (Choosing a polynomial degree for fuel economy (part 4)) Use the setup of Exercise 1.
Is the lowest estimate much lower than the one for the straight line?
The resampling lab in An Introduction to Statistical Learning: With Applications in Python (ISLP) repeats this analysis in Python [4, Sec. 5.3], ISLP_labs, Ch05.
Hyperparameters multiply. With
\[\regpar \in \{10^{-3}, 10^{-2}, 10^{-1}, 10^{0}, 10^{1}\} \quad \textcolor{blue}{5}\] \[\text{(Degree)} \quad d \in \{2, 3, 4\} \quad \textcolor{blue}{3}\]
there are \(5 \cdot 3 = 15\) hyperparameter combinations to search.
The search is simple. We fit every combination on each of the \(K\) training blocks. We score it on the held-out block, average over the blocks, and take the combination with the smallest sample average. The code in the Python, R and Julia tabs does exactly that. The data come from a cubic. So the right answer is known: \(d = 3\), with as little regularization as the noise allows.
The code never penalizes the intercept. Shrinking it would pull the fitted surface toward zero rather than toward the mean. That depends on the units of the response, not on model complexity. The code also assigns the folds once, outside the grid loop. Every combination is therefore scored on the same partition. Re-drawing the folds per combination would add variation that has nothing to do with the hyperparameters. The comparison is between combinations.
import numpy as np

def design(x, d):
    return np.column_stack([x ** k for k in range(d + 1)])

def ridge(X, y, lam):
    P = np.eye(X.shape[1]); P[0, 0] = 0          # never penalize the intercept
    return np.linalg.solve(X.T @ X + lam * P, X.T @ y)

def cv_error(x, y, d, lam, K, folds):
    errs = []
    for k in range(K):
        tr, te = folds != k, folds == k
        beta = ridge(design(x[tr], d), y[tr], lam)
        errs.append(np.mean((y[te] - design(x[te], d) @ beta) ** 2))
    return np.mean(errs)                          # (1/K) sum of fold errors

rng = np.random.default_rng(0)
truth = lambda x: 1 - 2 * x + 0.5 * x**2 + 0.8 * x**3
n, K = 60, 4
x = rng.uniform(-2, 2, n)
y = truth(x) + rng.normal(scale=1.0, size=n)
folds = rng.permutation(np.arange(n) % K)         # K blocks, shuffled

grid = [(d, lam) for d in (2, 3, 4) for lam in (1e-3, 1e-2, 1e-1, 1e0, 1e1)]
scores = {(d, lam): cv_error(x, y, d, lam, K, folds) for d, lam in grid}
print("combinations searched:", len(scores))
combinations searched: 15for d in (2, 3, 4):
print(d, [round(float(scores[(d, lam)]), 3) for lam in (1e-3, 1e-2, 1e-1, 1e0, 1e1)])2 [2.221, 2.221, 2.22, 2.215, 2.175]
3 [1.177, 1.177, 1.176, 1.178, 1.405]
4 [1.188, 1.188, 1.186, 1.177, 1.388]best = min(scores, key=scores.get)
print("best (degree, lambda):", best, "cv error:", round(scores[best], 3))best (degree, lambda): (3, 0.1) cv error: 1.176# The winner's own CV score is not an estimate of its error.
xt = rng.uniform(-2, 2, 10_000)
yt = truth(xt) + rng.normal(scale=1.0, size=10_000)
beta = ridge(design(x, best[0]), y, best[1])
print("fresh test error:", round(np.mean((yt - design(xt, best[0]) @ beta) ** 2), 3))fresh test error: 1.029design <- function(x, d) outer(x, 0:d, `^`)
ridge <- function(X, y, lam) {
P <- diag(ncol(X)); P[1, 1] <- 0 # never penalize the intercept
solve(t(X) %*% X + lam * P, t(X) %*% y)
}
cv_error <- function(x, y, d, lam, K, folds) {
errs <- numeric(K)
for (k in seq_len(K)) {
tr <- folds != k
beta <- ridge(design(x[tr], d), y[tr], lam)
errs[k] <- mean((y[!tr] - design(x[!tr], d) %*% beta)^2)
}
mean(errs) # (1/K) sum of fold errors
}
set.seed(0)
truth <- function(x) 1 - 2 * x + 0.5 * x^2 + 0.8 * x^3
n <- 60; K <- 4
x <- runif(n, -2, 2)
y <- truth(x) + rnorm(n)
folds <- sample(rep_len(1:K, n)) # K blocks, shuffled
grid <- expand.grid(lam = c(1e-3, 1e-2, 1e-1, 1e0, 1e1), d = 2:4)
grid <- dplyr::mutate(grid,
cv = mapply(function(d, lam) cv_error(x, y, d, lam, K, folds), grid$d, grid$lam))
cat("combinations searched:", nrow(grid), "\n")combinations searched: 15 2 2.251 2.251 2.249 2.237 2.151
3 0.844 0.844 0.847 0.89 1.364
4 0.85 0.851 0.857 0.93 1.602 best (degree, lambda): 3 0.001 cv error: 0.844 fresh test error: 1.045 using Random, Statistics, LinearAlgebra
design(x, d) = [xi^k for xi in x, k in 0:d];
function ridge(X, y, lam)
P = Matrix{Float64}(I, size(X, 2), size(X, 2))
P[1, 1] = 0 # never penalize the intercept
return (X'X + lam * P) \ (X'y)
end;
function cv_error(x, y, d, lam, K, folds)
errs = Float64[]
for k in 1:K
tr = folds .!= k
beta = ridge(design(x[tr], d), y[tr], lam)
push!(errs, mean((y[.!tr] - design(x[.!tr], d) * beta) .^ 2))
end
return mean(errs) # (1/K) sum of fold errors
end;
Random.seed!(0);
truth(x) = 1 - 2x + 0.5x^2 + 0.8x^3;
n, K = 60, 4;
x = 4 .* rand(n) .- 2;
y = truth.(x) .+ randn(n);
# K blocks, shuffled
folds = shuffle([mod1(i, K) for i in 1:n]);
grid = [(d, lam) for d in 2:4 for lam in (1e-3, 1e-2, 1e-1, 1e0, 1e1)];
scores = Dict(g => cv_error(x, y, g[1], g[2], K, folds) for g in grid);
println("combinations searched: ", length(scores))combinations searched: 15
for d in 2:4
    println(d, " ", [round(scores[(d, lam)], digits = 3)
                     for lam in (1e-3, 1e-2, 1e-1, 1e0, 1e1)])
end
2 [2.575, 2.575, 2.574, 2.562, 2.479]
3 [1.222, 1.222, 1.221, 1.23, 1.62]
4 [1.233, 1.233, 1.236, 1.29, 1.889]
# Minimise over the ordered grid, not over the Dict: a Dict iterates in
# hash order, so argmin(scores) would break a tie unpredictably.
best = argmin(g -> scores[g], grid);
println("best (degree, lambda): ", best, " cv error: ", round(scores[best], digits = 3))
best (degree, lambda): (3, 0.1) cv error: 1.221
# The winner's own CV score is not an estimate of its error.
xt = 4 .* rand(10_000) .- 2;
yt = truth.(xt) .+ randn(10_000);
beta = ridge(design(x, best[1]), y, best[2]);
println("fresh test error: ",
        round(mean((yt - design(xt, best[1]) * beta) .^ 2), digits = 3))
fresh test error: 1.034# What each tab printed, stored as values for the table in the next section.
tab_d = best[0]
tab_cv, tab_test = float(scores[best]), float(np.mean((yt - design(xt, best[0]) @ beta) ** 2))tab_d = best[1];
tab_cv, tab_test = scores[best], mean((yt - design(xt, best[1]) * beta) .^ 2);f3 <- function(v) sprintf("%.3f", v)
f4 <- function(v) sprintf("%.4f", v)
jl <- function(expr) JuliaCall::julia_eval(expr)
tab_cv <- c(reticulate::py$tab_cv, tab_r[["cv"]], jl("tab_cv"))
tab_test <- c(reticulate::py$tab_test, tab_r[["test"]], jl("tab_test"))
n_high <- sum(tab_cv > tab_test)
count_word <- function(k) c("none", "one", "two", "all three")[k + 1]Every tab rejects \(d = 2\) by a wide margin, and all three are nearly flat in \(\regpar\) until it reaches \(10\), at which point the penalty adds more bias than the variance it removes. The winning degree is \(3\) in the Python tab, \(3\) in R and \(3\) in Julia, against a true degree of \(3\): \(d = 3\) and \(d = 4\) score close together in every tab, so a different draw of the data can tip the choice between them. The degree matters here and the penalty barely does. Yet a grid search reports a winner whether or not the axes it searched were the ones that mattered.
GeeksforGeeks explains hyperparameter tuning [16], including grid search.
Each tab also fits the winner on all \(n\) points and scores it on fresh data. Compare that number with the CV score that selected it:
| CV score of the winner | fresh test error | |
|---|---|---|
| Python | 1.176 | 1.029 |
| R | 0.844 | 1.045 |
| Julia | 1.221 | 1.034 |
The CV score is too high in two of the three tabs and too low in one. A single sample therefore cannot answer the question. Two effects act in opposite directions. Only repeating the whole experiment separates them.
We repeat the entire procedure 400 times, with fresh data, fresh folds and a fresh grid search. The noise variance stays fixed at \(1\). Averaging over the replications gives:
# The listing at the end of this section, generalized to every grid and seed
# the prose quotes. Takes about 40 seconds. Each replication draws its data once
# and scores every candidate on it, so every grid sees identical data, as the
# listing's own grid does. Solving for all the lambdas of one degree at once
# gives the listing's CV scores for its own grid.
import numpy as np

def design(x, d):
    return np.column_stack([x ** k for k in range(d + 1)])

truth = lambda x: 1 - 2 * x + 0.5 * x**2 + 0.8 * x**3
n, K, R = 60, 4, 400
five = [1e-3, 1e-2, 1e-1, 1e0, 1e1]
fine = list(np.logspace(-3, 1, 15))
grids = {
    "15": [(d, lam) for d in (2, 3, 4) for lam in five],
    "45": [(d, lam) for d in (2, 3, 4) for lam in fine],
    "75": [(d, lam) for d in (2, 3, 4, 5, 6) for lam in fine],
}
for lam in five:
    grids["lam%g" % lam] = [(d, lam) for d in (2, 3, 4)]

def replicate(seed, which):
    cands = sorted({c for g in which for c in grids[g]})
    rng = np.random.default_rng(seed)
    xt = rng.uniform(-2, 2, 200_000)
    yt = truth(xt) + rng.normal(scale=1.0, size=200_000)
    Xt = {d: design(xt, d) for d, _ in cands}
    out = {g: dict(cv=[], part=[], full=[], win=[]) for g in which}
    s45 = []
    for _ in range(R):
        x = rng.uniform(-2, 2, n)
        y = truth(x) + rng.normal(scale=1.0, size=n)
        folds = rng.permutation(np.arange(n) % K)
        s, fit0 = {}, {}
        for d in sorted({d for d, _ in cands}):
            L = np.array([lam for dd, lam in cands if dd == d])
            X = design(x, d)
            P = np.eye(d + 1); P[0, 0] = 0
            errs = np.zeros(len(L))
            for k in range(K):
                tr, te = folds != k, folds == k
                A = X[tr].T @ X[tr] + L[:, None, None] * P
                b = np.broadcast_to(X[tr].T @ y[tr], (len(L), d + 1))[..., None]
                betas = np.linalg.solve(A, b)[..., 0]
                if k == 0:
                    fit0.update({(d, lam): bt for lam, bt in zip(L, betas)})
                errs += np.mean((y[te][:, None] - X[te] @ betas.T) ** 2, axis=0)
            s.update({(d, lam): e for lam, e in zip(L, errs / K)})
        true_err = {}
        for g in which:
            w = min(grids[g], key=lambda c: s[c])
            if w not in true_err:
                d, lam = w
                P = np.eye(d + 1); P[0, 0] = 0
                X = design(x, d)
                full = np.linalg.solve(X.T @ X + lam * P, X.T @ y)
                true_err[w] = (np.mean((yt - Xt[d] @ fit0[w]) ** 2),
                               np.mean((yt - Xt[d] @ full) ** 2))
            out[g]["cv"].append(s[w])
            out[g]["win"].append(w)
            out[g]["part"].append(true_err[w][0])
            out[g]["full"].append(true_err[w][1])
        if "45" in which:
            s45.append([[s[(d, lam)] for lam in fine] for d in (2, 3, 4)])
    res = {g: {k: np.mean(v) for k, v in o.items() if k != "win"} for g, o in out.items()}
    for r in res.values():
        r["bias"] = r["part"] - r["cv"]       # selection bias
        r["size"] = r["part"] - r["full"]     # training-size effect
    return res, out, np.array(s45)

rep_res, rep_out, s45 = replicate(1, list(grids))
new_wins = sum(lam not in five for _, lam in rep_out["45"]["win"])
adj_lam = np.mean(np.abs(np.diff(s45, axis=2)))
adj_deg = np.mean(np.abs(np.diff(s45, axis=1)))
by_seed = [rep_res["15"]] + [replicate(seed, ["15"])[0]["15"] for seed in (0, 2, 3, 4)]
seed_cv = np.array([r["cv"] for r in by_seed])
seed_bias = np.array([r["bias"] for r in by_seed])
seed_size = np.array([r["size"] for r in by_seed])
seed_net = seed_bias - seed_size| quantity | value |
|---|---|
| CV score of the selected combination | 1.070 |
| its true error, fit on \(\tfrac{K-1}{K}\) of the data | 1.113 |
| its true error, refit on all \(n\) | 1.086 |
The first gap is selection bias, also called the winner’s curse. Each of the 15 scores is a noisy estimate. Taking the smallest of 15 preferentially picks a combination whose noise happened to be low. So the winning score understates even its own model’s error, by \(0.0422\) here. (The table’s rounded rows differ by \(0.043\). Subtracting two three-decimal figures leaves at most three decimals of signal. The result can be off by one in the last decimal. That matters when we compare selection bias across grids, because the whole question is how far these move. The figures quoted here are all differences of the unrounded sample means.)
Selection bias grows with the number of distinct, competitive candidates rather than with the raw count. We re-run the replication over other grids, with the same \(n\), the same \(K\) and the same 400 replications. Every run uses seed \(1\), so every grid sees identical data. The results are:
| grid | candidates | selection bias |
|---|---|---|
| \(d \in \{2,3,4\}\), \(\regpar = 10^{-2}\) alone | 3 | \(0.0377\) |
| \(d \in \{2,3,4\}\), the five \(\regpar\)s used here | 15 | \(0.0422\) |
\(d \in \{2,3,4\}\), np.logspace(-3, 1, 15)
|
45 | \(0.0434\) |
| \(d \in \{2,\dots,6\}\), the same fifteen \(\regpar\)s | 75 | \(0.0700\) |
Tripling the count from 15 to 45 barely moves it. Adding \(d = 5\) and \(d = 6\) to reach seventy-five raises it from \(0.0434\) to \(0.0700\), a factor of \(1.62\). Both steps add thirty candidates, so the count does not separate them. Nor does the finer grid go unused. That grid keeps only three of the original five \(\regpar\)s, and its twelve new values win \(258\) of the \(400\) replications. They win, but they add few new independent candidates. Across that 45-candidate grid, two \(\regpar\)-adjacent candidates differ in CV score by \(0.0159\) on average, where two degree-adjacent candidates at the same \(\regpar\) differ by \(0.5207\). The finer grid therefore gains very little from noise the five \(\regpar\)s had not already exposed. It lowers the sample mean winning score by \(0.0009\), against \(0.0075\) for the two added degrees.
A falling winning score is most of the first step and less than a third of the second. Selection bias is the winner’s true error minus its CV score. So it can widen from either end. These two steps widen it from different ends. From 15 candidates to 45 the bias grows by \(0.0012\), and the falling score supplies \(0.0009\) of that. From 45 to 75 it grows by \(0.0267\), of which the falling score supplies \(0.0075\); the remaining \(0.0192\) is the winner’s own true error going up. Degrees \(5\) and \(6\) do not only give the search more chances to draw a low score. They change which model it chooses, for the worse.
The first row depends on which single \(\regpar\) we fix, because that is a choice rather than a constant. At \(\regpar = 10^{-3}\) the same three degrees give \(0.0376\) and at \(10^{-1}\), \(0.0371\); at \(\regpar = 1\), \(0.0348\); at \(\regpar = 10\), \(0.0447\). That is higher than the fifteen-candidate grid, on only three candidates. That last row lies outside the argument rather than contradicting it. At \(\regpar = 10\) every fit is badly over-regularized, with a CV score of \(1.356\) against \(1.070\). So the comparison is among three bad candidates rather than competitive ones.
The second gap runs the other way. A CV score measures a model fit on \(\tfrac{K-1}{K}\) of the data. The model we deploy is fit on all of it, so it is slightly better, by \(0.0262\) here. So a small \(K\) is pessimistic. Leave-one-out cross-validation avoids that.
Overall, the CV score of the winner is optimistic by \(0.0159\) in this run. That remainder is the difference of two close numbers, so it is the least stable quantity here. We repeat the whole 400-replication experiment under seeds \(0\) through \(4\). We change only default_rng(1). Selection bias comes out at \(0.0394 \pm 0.0051\) and the training-size effect at \(0.0265 \pm 0.0025\), each clearly positive or clearly negative. Their difference comes out at \(0.0129 \pm 0.0073\), and one of the five runs lands at \(0.0003\). Here \(\pm\) is the sample standard deviation across the five runs. We carry more digits than elsewhere because this paragraph is about how far they move.
So the two biases nearly cancel. Four hundred replications do not settle whether the remainder is optimism or pessimism. One run settles it even less. We cannot control either bias. The practical consequence is the same either way. A score used to choose a model cannot also be used to report it. Keep a test set that the search never touched. Alternatively, wrap the whole search in an outer cross-validation loop and report that score. This approach, nested CV, costs another factor of \(K\). Its estimate is not biased by the search.
# Takes about 25 seconds. design, ridge and cv_error repeat the Python tab
# of "Searching the grid", because every block here runs on its own. Keep the two copies
# identical: they are the same three functions, not two variants of them.
import numpy as np
from collections import Counter

def design(x, d):
    return np.column_stack([x ** k for k in range(d + 1)])

def ridge(X, y, lam):
    P = np.eye(X.shape[1]); P[0, 0] = 0          # never penalize the intercept
    return np.linalg.solve(X.T @ X + lam * P, X.T @ y)

def cv_error(x, y, d, lam, K, folds):
    errs = []
    for k in range(K):
        tr, te = folds != k, folds == k
        beta = ridge(design(x[tr], d), y[tr], lam)
        errs.append(np.mean((y[te] - design(x[te], d) @ beta) ** 2))
    return np.mean(errs)                          # (1/K) sum of fold errors

truth = lambda x: 1 - 2 * x + 0.5 * x**2 + 0.8 * x**3
grid = [(d, lam) for d in (2, 3, 4) for lam in (1e-3, 1e-2, 1e-1, 1e0, 1e1)]
n, K, R = 60, 4, 400
rng = np.random.default_rng(1)
xt = rng.uniform(-2, 2, 200_000)
yt = truth(xt) + rng.normal(scale=1.0, size=200_000)
test_err = lambda beta, d: np.mean((yt - design(xt, d) @ beta) ** 2)

win_cv, win_test, refit_all, chosen = [], [], [], []
for _ in range(R):
    x = rng.uniform(-2, 2, n)
    y = truth(x) + rng.normal(scale=1.0, size=n)
    folds = rng.permutation(np.arange(n) % K)
    s = {g: cv_error(x, y, g[0], g[1], K, folds) for g in grid}
    b = min(s, key=s.get)
    chosen.append(b)
    win_cv.append(s[b])
    tr = folds != 0                      # all but one fold: (K-1)/K of the data
    win_test.append(test_err(ridge(design(x[tr], b[0]), y[tr], b[1]), b[0]))
    refit_all.append(test_err(ridge(design(x, b[0]), y, b[1]), b[0]))

print(round(np.mean(win_cv), 3), round(np.mean(win_test), 3),
      round(np.mean(refit_all), 3))
1.07 1.113 1.086print(Counter(d for d, _ in chosen).most_common())[(3, 297), (4, 103)]The last line of Listing 1 counts the degrees the search chose. The search found the true degree in 297 of 400 replications and over-fit to \(d = 4\) in the other 103. It never once chose \(d = 2\). Cross-validation is far better at rejecting a model that is too simple than one that is too complex. We can shrink an unnecessary term toward zero, but we cannot create a missing one. So we should extend the grid beyond where we expect the answer to lie.
Hastie and Tibshirani show cross-validation done the wrong way and the right way [2], video 5.3.
We rendered this page with NumPy 2.5.3 on Python 3.13.5, R 4.5.3, and Julia 1.12.6. The three tabs disagree on the winning combination and on the sign of the CV-versus-test gap. Each language’s generator produces different data, which explains the disagreement. That disagreement is the point of Section 7.2, not a defect. Every figure here is seeded, so it reproduces exactly on these versions. The sample averages over the replications, however, are seeded Monte Carlo estimates, not constants. The five independent runs under seeds \(0\) through \(4\) spread over \(1.066\) to \(1.083\) on the first row. Treat the third digit as an artifact of the seed.
James et al. [11], Chapter 5
Hastie et al. [12], Chapter 7
Zhou [17], Resampling Methods — slides on An Introduction to Statistical Learning, Chapter 5, with code in R
Starmer [18], on cross-validation — an illustrated walk-through with little algebra
The Data Science Learning Community’s book clubs discuss An Introduction to Statistical Learning, Chapter 5, in recorded meetings: