# HTML formats get an interactive plotly widget;
# the handout and other formats get a colour map of the same grid.
# The handout hides this code.
curves_surf <- contourLines(b0_grid, b1_grid, mse_grid, levels = level_surf)
lines_surf <- do.call(rbind, lapply(curves_surf, function(curve) {
  n <- length(curve$x)
  data.frame(
    b0 = c(curve$x, NA),
    b1 = c(curve$y, NA),
    mse = c(rep(curve$level, n), NA)
  )
}))

surf_alt <- paste(
  "The mean squared error over the intercept and the slope,",
  "drawn as a three-dimensional surface:",
  "a bowl with a long narrow floor,",
  "one lowest point marked in orange,",
  "and black contour lines around it.",
  "Below it, sliders for the intercept and slope",
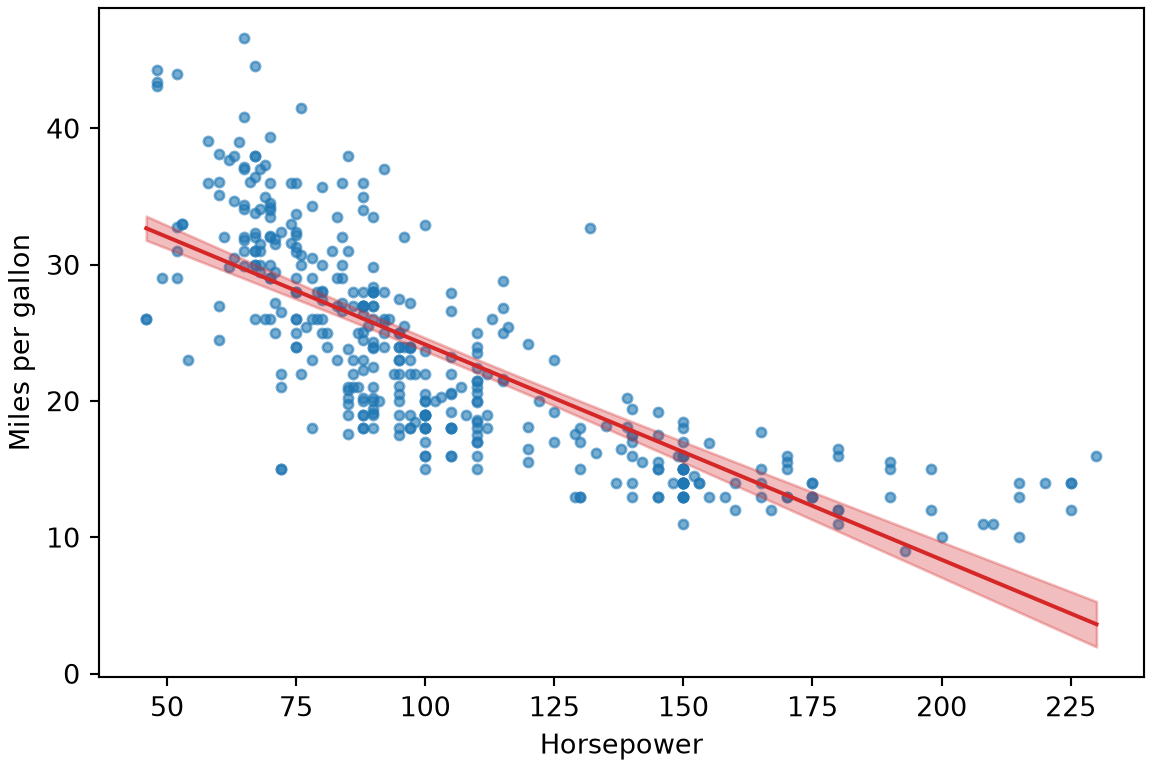
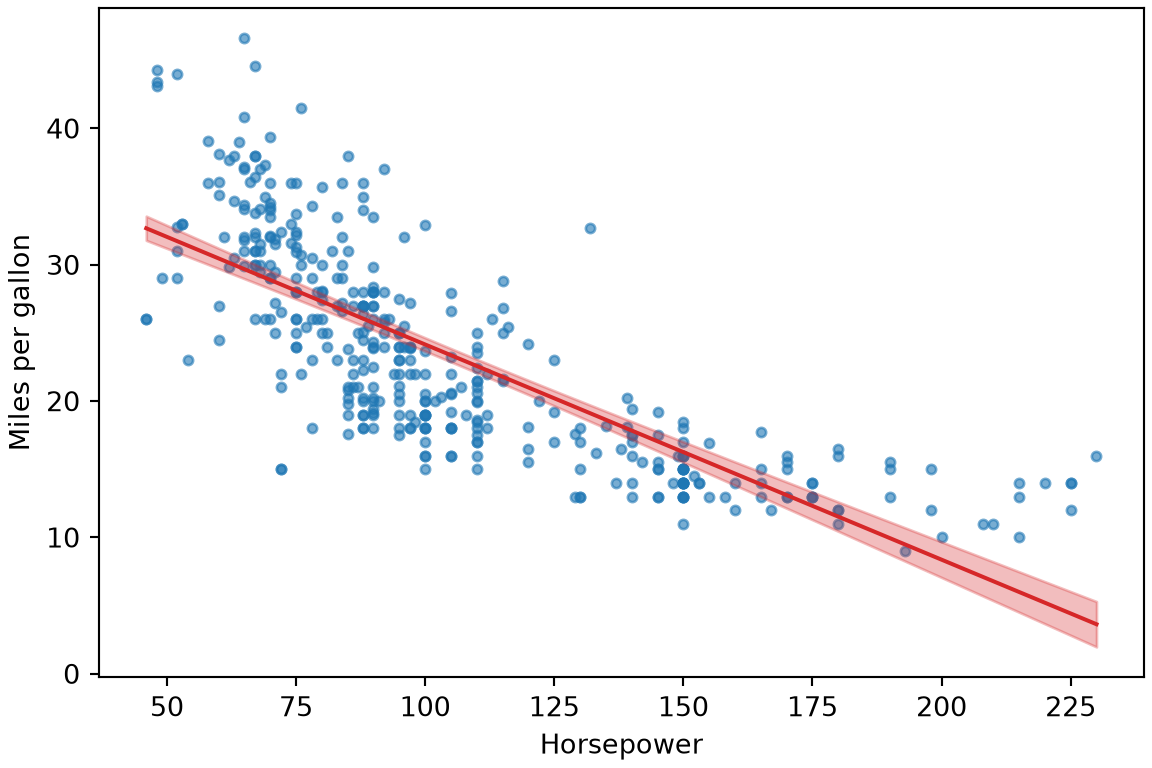
  "and a scatter plot of the data with the chosen line."
)

if (knitr::is_html_output()) {
  hover_surf <- paste0(
    "intercept (β₀): %{x:.2f}<br>slope (β₁): %{y:.4f}",
    "<br>mean squared error: %{z:.2f}<extra></extra>"
  )
  widget_surf <- plotly::plot_ly() |>
    plotly::add_surface(
      x = b0_grid,
      y = b1_grid,
      z = t(mse_grid),
      showscale = FALSE,
      colorscale = list(
        c(0, "#ffffcc"),
        c(0.5, "#41b6c4"),
        c(1, "#253494")
      ),
      hovertemplate = hover_surf
    ) |>
    plotly::add_trace(
      data = lines_surf,
      x = ~b0,
      y = ~b1,
      z = ~mse,
      type = "scatter3d",
      mode = "lines",
      line = list(color = "#222222", width = 3),
      hoverinfo = "skip"
    ) |>
    plotly::add_trace(
      x = best_b0,
      y = best_b1,
      z = best_mse,
      type = "scatter3d",
      mode = "markers",
      marker = list(
        size = 6,
        color = "#d95f02",
        line = list(color = "#ffffff", width = 1)
      ),
      hovertemplate = sub(
        "<extra></extra>",
        "<extra>minimum</extra>",
        hover_surf
      )
    ) |>
    plotly::add_trace(
      x = best_b0,
      y = best_b1,
      z = best_mse,
      type = "scatter3d",
      mode = "markers",
      marker = list(
        size = 7,
        color = "#1f77b4",
        line = list(color = "#ffffff", width = 1)
      ),
      hoverinfo = "skip"
    ) |>
    plotly::layout(
      showlegend = FALSE,
      margin = list(l = 0, r = 0, t = 0, b = 0),
      paper_bgcolor = "rgba(0,0,0,0)",
      scene = list(
        xaxis = list(title = lab_b0),
        yaxis = list(title = lab_b1),
        zaxis = list(
          title = "mean squared error",
          range = c(0, mse_axis_max)
        ),
        camera = list(eye = list(x = 1.5, y = -1.7, z = 0.9))
      )
    ) |>
    plotly::config(displaylogo = FALSE, responsive = TRUE)

  # Sliders and a data plot under the surface, all driven by `window.mseFit`.
  # The chosen point is the fourth trace of the surface (index 3).
  surface_js <- paste0("
    function(el, x, data) {", sync_js, "
      var mse = function(b0, b1) {
        var total = 0;
        for (var i = 0; i < data.x.length; i++) {
          total += Math.pow(b0 + b1 * data.x[i] - data.y[i], 2);
        }
        return total / data.x.length;
      };

      var controls = document.createElement('div');
      var slider = function(label, min, max, step, start) {
        var row = document.createElement('label');
        row.style.display = 'block';
        row.textContent = label + ' ';
        var input = document.createElement('input');
        input.type = 'range';
        input.min = min;
        input.max = max;
        input.step = step;
        input.value = start;
        input.style.width = '70%';
        row.appendChild(input);
        controls.appendChild(row);
        return input;
      };
      var b0Slider = slider('intercept (β₀)', data.b0Min, data.b0Max, 0.05, data.b0);
      var b1Slider = slider('slope (β₁)', data.b1Min, data.b1Max, 0.0005, data.b1);
      var panel = document.createElement('div');
      panel.style.height = '340px';
      el.parentNode.appendChild(controls);
      el.parentNode.appendChild(panel);

      var ink = getComputedStyle(el).color;
      var xs = [Math.min.apply(null, data.x), Math.max.apply(null, data.x)];
      var drawn = false;
      var draw = function(b0, b1) {
        var title = 'intercept ' + b0.toFixed(2) + ', slope ' +
          b1.toFixed(4) + ', mean squared error ' + mse(b0, b1).toFixed(2);
        if (drawn) {
          // After the first draw, move only the chosen line and the title.
          Plotly.restyle(panel, {y: [xs.map(function(v) { return b0 + b1 * v; })]}, [2]);
          Plotly.relayout(panel, {'title.text': title});
          return;
        }
        drawn = true;
        var traces = [
          {x: data.x, y: data.y, mode: 'markers', type: 'scatter',
           name: 'data', marker: {color: '#7f7f7f', size: 5, opacity: 0.6}},
          {x: xs, y: xs.map(function(v) { return data.b0 + data.b1 * v; }),
           mode: 'lines', type: 'scatter', name: 'least-squares fit',
           line: {color: '#d95f02', dash: 'dot', width: 2}},
          {x: xs, y: xs.map(function(v) { return b0 + b1 * v; }),
           mode: 'lines', type: 'scatter', name: 'chosen line',
           line: {color: '#1f77b4', width: 3}}
        ];
        var layout = {
          title: {text: title, font: {size: 13}},
          xaxis: {title: 'horsepower'}, yaxis: {title: 'mpg', range: [0, 50]},
          paper_bgcolor: 'rgba(0,0,0,0)', plot_bgcolor: 'rgba(0,0,0,0)',
          font: {color: ink}, margin: {t: 40, r: 10},
          legend: {orientation: 'h', y: -0.25}
        };
        Plotly.react(panel, traces, layout, {displaylogo: false, responsive: true});
      };

      window.mseFit.b0 = data.b0;
      window.mseFit.b1 = data.b1;
      window.mseFit.listeners.push(function(b0, b1) {
        draw(b0, b1);
        b0Slider.value = b0;
        b1Slider.value = b1;
        Plotly.restyle(el, {x: [[b0]], y: [[b1]], z: [[mse(b0, b1)]]}, [3]);
      });
      draw(data.b0, data.b1);

      var fromSliders = function() {
        window.mseFit.set(parseFloat(b0Slider.value), parseFloat(b1Slider.value));
      };
      b0Slider.addEventListener('input', fromSliders);
      b1Slider.addEventListener('input', fromSliders);
      el.on('plotly_click', function(ev) {
        window.mseFit.set(ev.points[0].x, ev.points[0].y);
      });
    }
  ")
  ok_surf <- is.finite(x_surf) & is.finite(y_surf)
  widget_surf <- htmlwidgets::onRender(
    widget_surf,
    surface_js,
    data = list(
      x = x_surf[ok_surf],
      y = y_surf[ok_surf],
      b0 = best_b0,
      b1 = best_b1,
      b0Min = min(b0_grid),
      b0Max = max(b0_grid),
      b1Min = min(b1_grid),
      b1Max = max(b1_grid)
    )
  )
  htmltools::div(
    role = "img",
    `aria-label` = surf_alt,
    lazy_widget(widget_surf)
  )
} else {
  local({
    library(ggplot2)
    ggplot(grid_surf, aes(b0, b1)) +
      geom_raster(aes(fill = pmin(mse, mse_axis_max))) +
      geom_contour(aes(z = mse), breaks = level_surf, colour = "#222222") +
      annotate("point", x = best_b0, y = best_b1, colour = "#d95f02", size = 3) +
      scale_fill_gradientn(
        colours = c("#ffffcc", "#41b6c4", "#253494"),
        name = "mean squared error"
      ) +
      labs(x = lab_b0, y = lab_b1)
  })
}