Daily percentage returns of the S&P 500 stock index on 1250 trading days from 2001 to 2005 make up the Smarket data [1, Sec. 4.7]. The data are in data/smarket.csv, one row per trading day, copied from the ISLP Python package. The columns this course uses are:
Direction: the outcome, whether the index rose (Up) or fell (Down) that day.
Lag1 to Lag5: the percentage returns on each of the five previous trading days.
Volume: the number of shares traded on the previous day, in billions.
Year: the year of the trading day.
The Today column, the day’s own return, is not a predictor, because Direction is Down exactly when Today is negative.
The Date column, the calendar date of each trading day, is not used by the exercises; it names the day that a row describes, from 2001-01-10 to 2005-12-30. The ISLP copy has no dates. The dates were recovered by matching Today against the S&P 500 daily returns in the sp500ret data of the rugarch package [3], after converting those log returns to percentage returns. The script tools/add_smarket_dates.R does the match. It stops unless exactly one run of trading days agrees with all 1250 values of Today, to within 0.0005 percentage points, the rounding of Today.
51.8% of the days are up days. A classifier that always answers Up would therefore have an accuracy of 51.8%, which is the baseline for the later exercises.
Exercise 2 (Lab: correlations among the lagged returns)
Exercise 2 (Lab: correlations among the lagged returns) Use the Smarket data. Among every two different columns from Lag1 to Lag5, what is the largest correlation in absolute value?
Hint
The summary functions of a data frame include its correlationmatrix. Each pair of columns appears twice in it, and each column has correlation \(1\) with itself.
The largest absolute correlation is 0.027. Each day’s return is nearly uncorrelated with the returns of the days before it, so the later models should not expect strong predictions from the lagged returns.
Exercise 3 (Lab: scatterplots of the lagged returns)
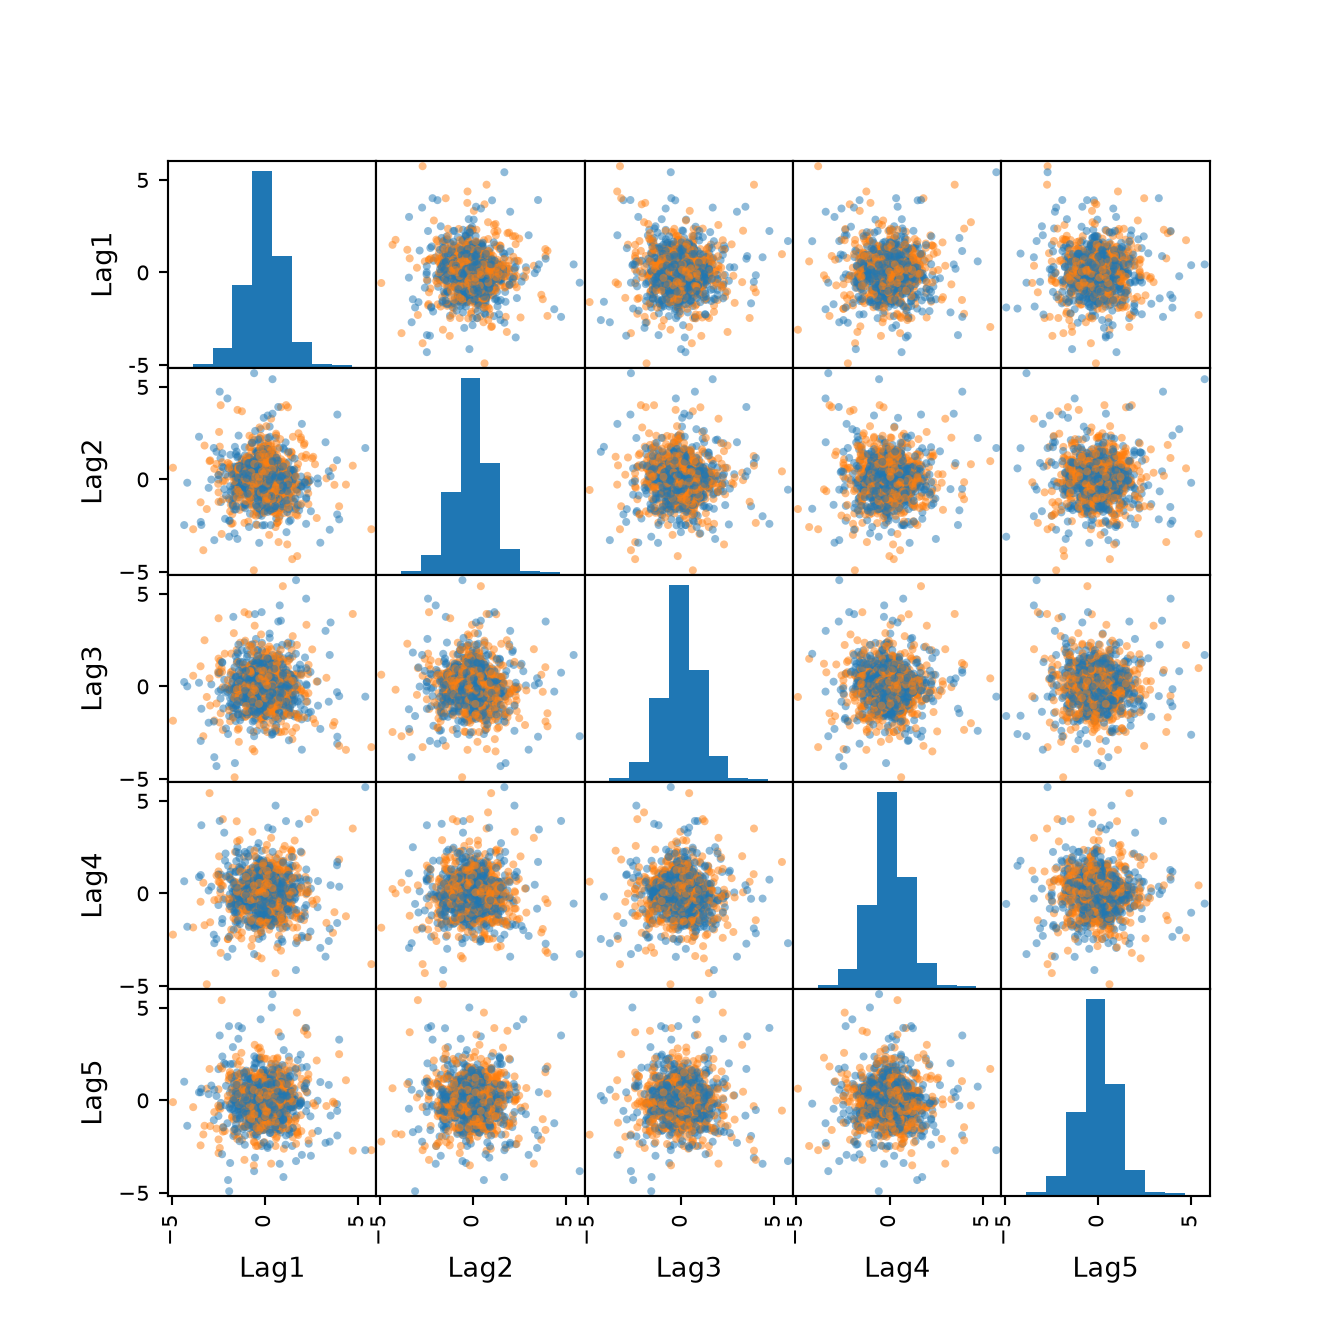
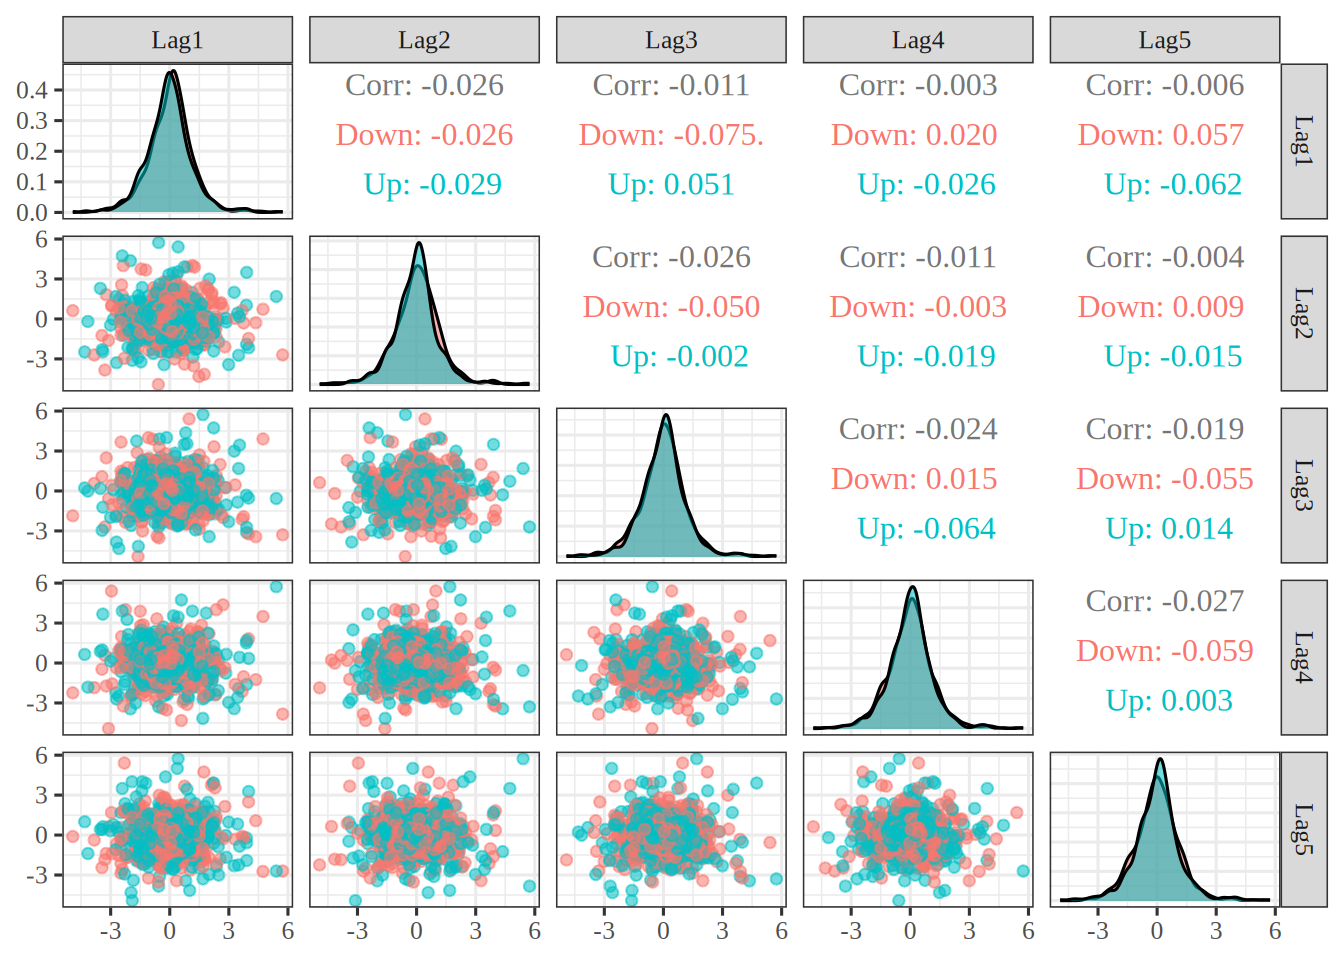
Exercise 3 (Lab: scatterplots of the lagged returns) Use the Smarket data. Draw a scatterplot of every two different columns from Lag1 to Lag5, with the points colored by Direction.
Hint
In R, the ggpairs()function of the GGally package draws all the scatterplots of a data frame’s columns in one grid. In Python, the scatter_matrix() function of pandas.plotting does the same.
In every panel of Figure 1, the dots form a round cloud centered near zero, which is the picture of the near-zero correlations from Solution 2. The up days and down days overlap completely, so no single lagged return, and no pair of them, separates the two classes by eye.
Exercise 4 (Lab: a histogram of the previous day’s return)
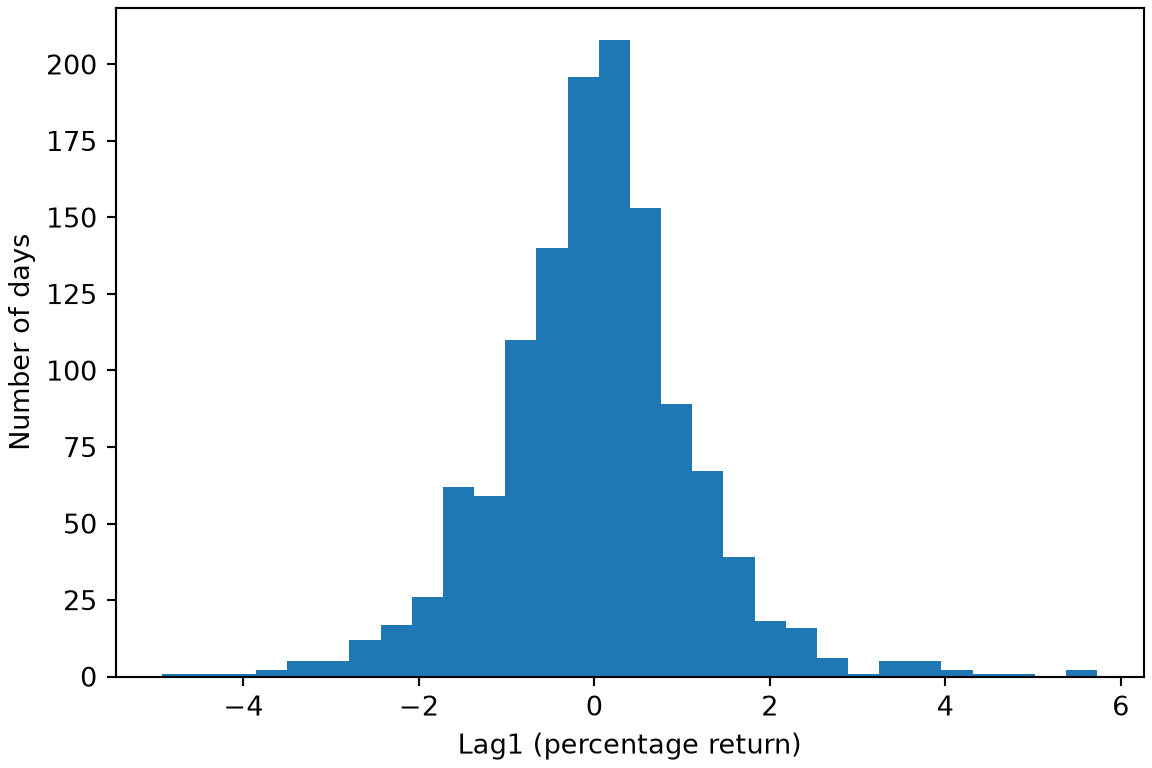
Exercise 4 (Lab: a histogram of the previous day’s return) Use the Smarket data. Draw a histogram of Lag1.
I chose 30 bins, which is about 42 days per bar on average. Far fewer bins would merge the thin tails into the central hump, and far more would leave most bars with only a few days, so the outline would look ragged. That trade-off is why 30 is a compromise between the two.
Figure 2 shows a single tall, narrow hump centered near zero, with thin tails on both sides. The sample mean is 0.004 and the standard deviation is 1.14, and 94.6% of the days lie within two of those spreads of the sample mean.
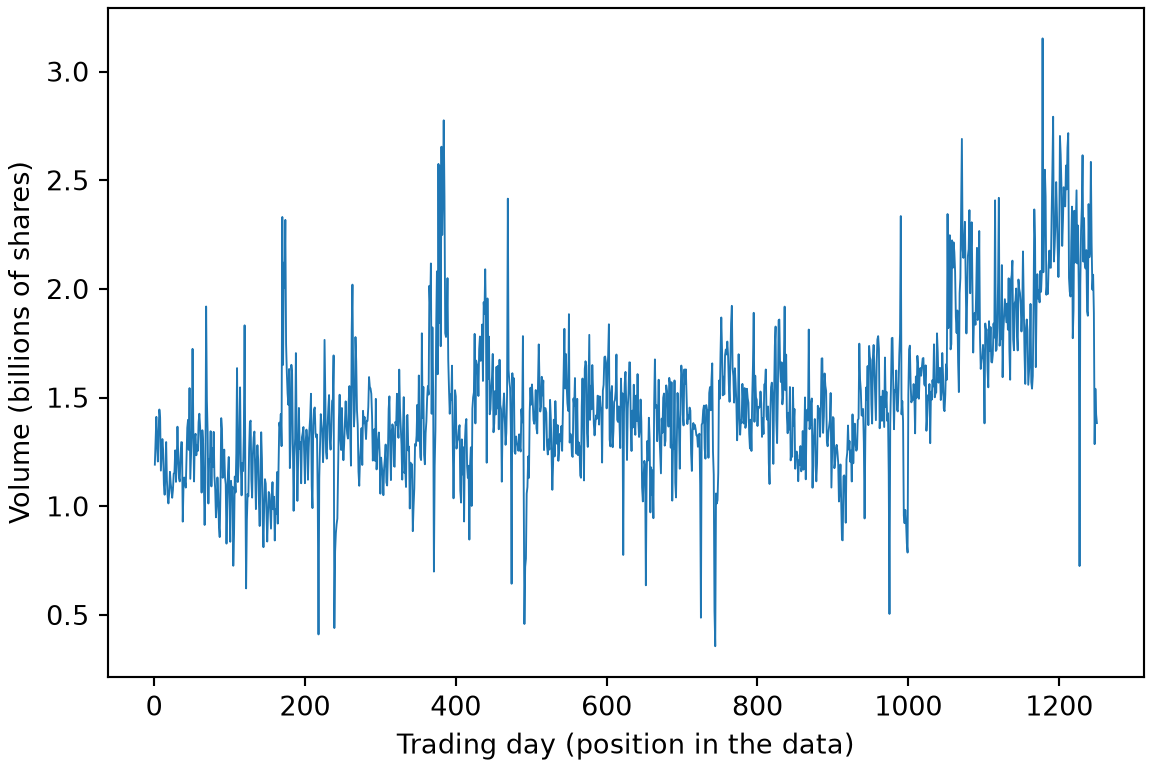
The sample mean of Volume is largest in 2005, at 1.917 billion shares. Volume rises over the period, although not every year, so a model that uses Volume can pick up the trend in time.
Exercise 6 (Lab: trading volume over time) Use the Smarket data. Plot Volume against the position of the trading day in the data, from the first day to the last.
Hint
The plotting functions draw a scatterplot, and the row numbers are a sequence of whole numbers from the first row to the last.
import matplotlib.pyplot as pltfig, ax = plt.subplots(figsize=(6, 4), layout="constrained")ax.plot(eda_py.index +1, eda_py["Volume"], linewidth=0.7);ax.set_xlabel("Trading day (position in the data)");ax.set_ylabel("Volume (billions of shares)");plt.show()
library(ggplot2) # nolint: undesirable_function_lintereda_r_days <- dplyr::mutate(eda_r, day = dplyr::row_number())volume_series <- eda_r_days |>ggplot() +aes(x = day, y = Volume) +geom_line(linewidth =0.3) +labs(x ="Trading day (position in the data)",y ="Volume (billions of shares)" )is_html <- knitr::is_html_output()if (is_html) { widget <- plotly::ggplotly(volume_series) |> plotly::config(displaylogo =FALSE, responsive =TRUE) htmltools::div(role ="img", `aria-label`= volume_series_alt, widget)} else { volume_series}
In Figure 3, volume is noisy from day to day, roughly level for most of the period and higher over the last stretch, which agrees with the yearly sample means in Solution 5. The correlation between the position of the day and Volume is 0.55.
Exercise 7 (Lab: the previous day’s return by direction)
Exercise 7 (Lab: the previous day’s return by direction) Use the Smarket data. Compute the sample mean of Lag1 within each value of Direction.
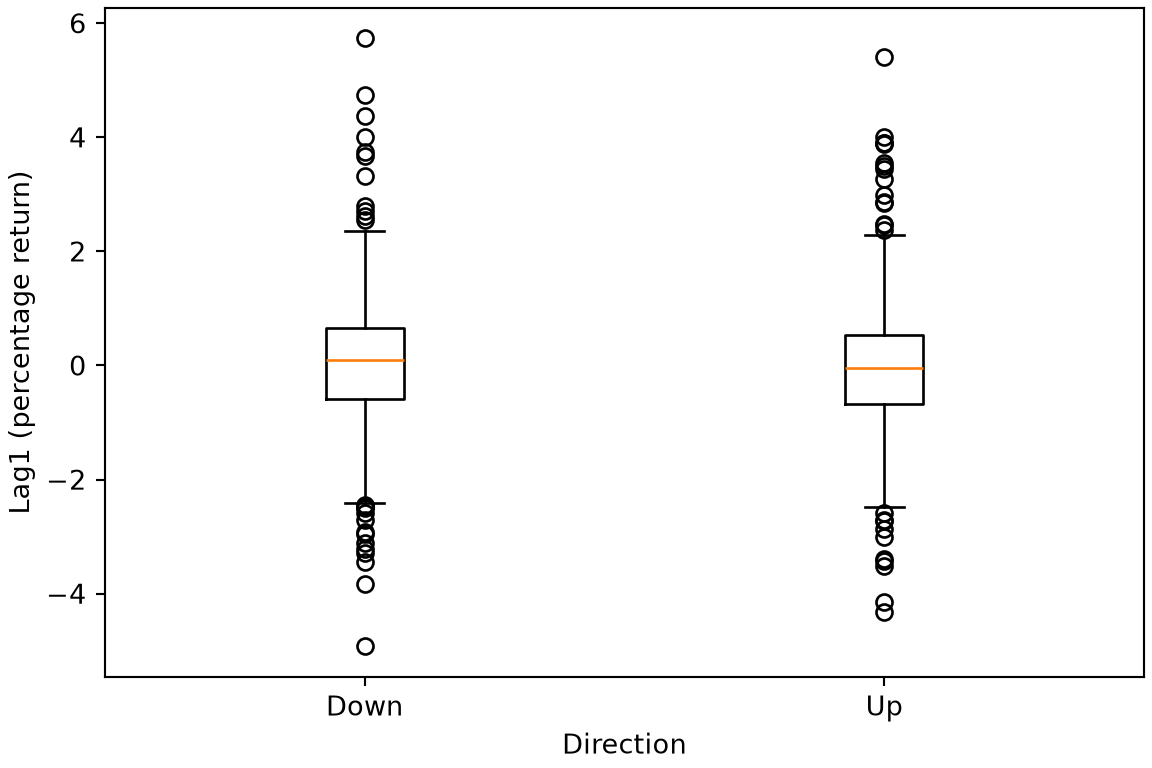
The sample means are 0.051 on down days and -0.04 on up days. The difference is small next to the day-to-day spread of the returns, so Lag1 alone will not separate up days from down days well.
Exercise 8 (Lab: boxplots of the previous day’s return by direction)
Exercise 8 (Lab: boxplots of the previous day’s return by direction) Use the Smarket data. Draw side-by-side boxplots of Lag1, one for each value of Direction.
In Figure 4, the two boxes overlap almost completely, which agrees with the small difference between the sample means in Solution 7. The boxplots add that the spreads are alike too, so Lag1 alone has little power to tell the two directions apart.
Exercise 9 (Lab: logistic regression on the stock market data)
The drop in deviance is 3.59, with a \(p\)-value of 0.732. The drop tests all 6 coefficients together, and it agrees with the coefficient table of Solution 9: no single predictor is clearly distinguishable from zero, and the six together do not improve clearly on a model with only an intercept.
Exercise 12 (Lab: a logistic regression with fewer predictors)
lab_py_actual = lab_py.loc[~lab_py_train, "Direction"]lab_py_predicted = ["Up"if u ==1else"Down"for u in lab_py_up]pd.crosstab( pd.Series(lab_py_predicted, index=lab_py_actual.index, name="Predicted"), lab_py_actual.rename("Actual"),)
The confusion matrix covers 252 test days. The cells where the row and the column agree hold the 141 days classified correctly, so the accuracy is the same 56% as in Solution 12. The modelpredictsUp on 182 of those days.
Exercise 14 (Lab: the always-Up rule on the test set)
Exercise 14 (Lab: the always-Up rule on the test set) Use the split of Exercise 16. What is the accuracy on the test set of the rule that predictsUp on every day?
The rule is right exactly on the days that go up, so its accuracy is the share of Up days in the test set, 56%. The model of Solution 12 reaches 56%, which differs from this rule, one that uses no predictors, by 0 percentage points. On this data, the model’s accuracy is no better than that of always predicting Up.
Exercise 15 (Lab: predict at chosen values) Use the fit of Exercise 12. What is the predicted probability that Direction is Up on a day with Lag1\(= 1.2\) and Lag2\(= 1.1\)?
Exercise 16 (Lab: split the Smarket data by year) Split the Smarket data [1] into a training set of the days before \(2005\) and a test set of the days in \(2005\). Keep Lag1 and Lag2 as the predictors and Direction as the outcome.
G. James, D. Witten, T. Hastie, R. Tibshirani, and J. Taylor, An introduction to statistical learning: With applications in Python. Springer, 2023. doi: 10.1007/978-3-031-38747-0.
[2]
F. Pedregosa et al., “Scikit-learn: Machine learning in Python,”Journal of Machine Learning Research, vol. 12, pp. 2825–2830, 2011, Available: https://jmlr.org/papers/v12/pedregosa11a.html