Functions from these packages will be used throughout this document:
[R code]
library(conflicted) # check for conflicting function definitions# printr is not loaded here: it inserts help-file output into markdown outputlibrary(rmarkdown) # Convert R Markdown documents into a variety of formats.library(pander) # format tables for markdownlibrary(ggplot2) # graphicslibrary(ggfortify) # help with graphicslibrary(dplyr) # manipulate datalibrary(tibble) # `tibble`s extend `data.frame`slibrary(magrittr) # `%>%` and other additional piping toolslibrary(haven) # import Stata fileslibrary(knitr) # format R output for markdownlibrary(tidyr) # Tools to help to create tidy datalibrary(plotly) # interactive graphicslibrary(dobson) # datasets from Dobson and Barnett 2018library(parameters) # format model output tables for markdownlibrary(haven) # import Stata fileslibrary(latex2exp) # use LaTeX in R code (for figures and tables)library(fs) # filesystem path manipulationslibrary(survival) # survival analysislibrary(survminer) # survival analysis graphicslibrary(KMsurv) # datasets from Klein and Moeschbergerlibrary(parameters) # format model output tables forlibrary(webshot2) # convert interactive content to static for pdflibrary(forcats) # functions for categorical variables ("factors")library(stringr) # functions for dealing with stringslibrary(lubridate) # functions for dealing with dates and times# Summarizes key information about statistical objects in tidy tibbleslibrary(broom)# Provides suite of functions to work with regression model# `broom::tidy()` tibbleslibrary(broom.helpers)
Here are some R settings I use in this document:
[R code]
rm(list =ls()) # delete any data that's already loaded into Rconflicts_prefer(dplyr::filter)ggplot2::theme_set( ggplot2::theme_bw() +# ggplot2::labs(col = "") + ggplot2::theme(legend.position ="bottom",text = ggplot2::element_text(size =12, family ="serif") ))knitr::opts_chunk$set(message =FALSE)options(digits =6)panderOptions("big.mark", ",")pander::panderOptions("table.emphasize.rownames", FALSE)pander::panderOptions("table.split.table", Inf)# use the `filter()` function from dplyr() by defaultconflicts_prefer(dplyr::filter)legend_text_size <-9run_graphs <-TRUE
Definition 1 (Logistic regression model)Logistic regression is a framework for modeling binary outcomes, conditional on one or more predictors (also called covariates).
Exercise 2 (Examples of binary outcomes) What are some examples of binary outcomes in the health sciences?
Logistic regression differs from linear regression, which uses the Gaussian (“normal”) distribution to model the outcome variable, conditional on the covariates.
Exercise 4 Recall: what kinds of outcomes is linear regression used for?
Solution 4. Linear regression is typically used for numerical outcomes that aren’t event counts or waiting times for an event.
Examples of outcomes that are often analyzed using linear regression include:
Richard McElreath’s Modeling Events (Statistical Rethinking 2026, Lecture A09) accompanies Chapters 10 and 11 of McElreath [6], which cover generalized linear models for binary and count outcomes. The lecture fits these models using Bayesian inference rather than the maximum likelihood estimation used in this chapter [7].
Independent binary outcomes - general
Exercise 5 Let \(\mathord{\smash[b]{\underset{\raise.3ex\hbox{$\scriptstyle\sim$}}{y}}\vphantom{y}}\) represent a data set of mutually independentbinary outcomes, each with a potentially different event probability \(\pi_i\):
Theorem 1 (Likelihood of independent binary outcomes) Let \(\mathord{\smash[b]{\underset{\raise.3ex\hbox{$\scriptstyle\sim$}}{y}}\vphantom{y}}= (y_1, ..., y_n)\) be a data set of mutually independentbinary outcomes, \(y_i \ \sim_{\perp\!\!\!\perp}\ \operatorname{Ber}(\pi_i)\), each with a potentially different event probability \(\pi_i\). Then the likelihood of \(\mathord{\smash[b]{\underset{\raise.3ex\hbox{$\scriptstyle\sim$}}{y}}\vphantom{y}}\) is:
Example 1 (Likelihood of three binary outcomes) Suppose \(\mathord{\smash[b]{\underset{\raise.3ex\hbox{$\scriptstyle\sim$}}{y}}\vphantom{y}}= (1, 0, 1)\) with event probabilities \(\mathord{\smash[b]{\underset{\raise.3ex\hbox{$\scriptstyle\sim$}}{\pi}}\vphantom{\pi}}= (0.8, 0.3, 0.6)\). The code below computes the likelihood from the formula of Theorem 1, and as the product of the three Bernoulli probabilities from dbinom():
Theorem 2 (Log-likelihood of independent binary outcomes) Under the assumptions of Theorem 1, the log-likelihood of \(\mathord{\smash[b]{\underset{\raise.3ex\hbox{$\scriptstyle\sim$}}{y}}\vphantom{y}}\) is:
Example 2 (Log-likelihood of three binary outcomes) Take \(\mathord{\smash[b]{\underset{\raise.3ex\hbox{$\scriptstyle\sim$}}{y}}\vphantom{y}}\) and \(\mathord{\smash[b]{\underset{\raise.3ex\hbox{$\scriptstyle\sim$}}{\pi}}\vphantom{\pi}}\) from Example 1. The code below computes the log-likelihood from the formula of Theorem 2, and as the logarithm of the likelihood:
library(glmx)library(dplyr)data(BeetleMortality, package ="glmx")beetles <- BeetleMortality |>mutate(pct = died / n,survived = n - died,dose_c = dose -mean(dose) )beetles
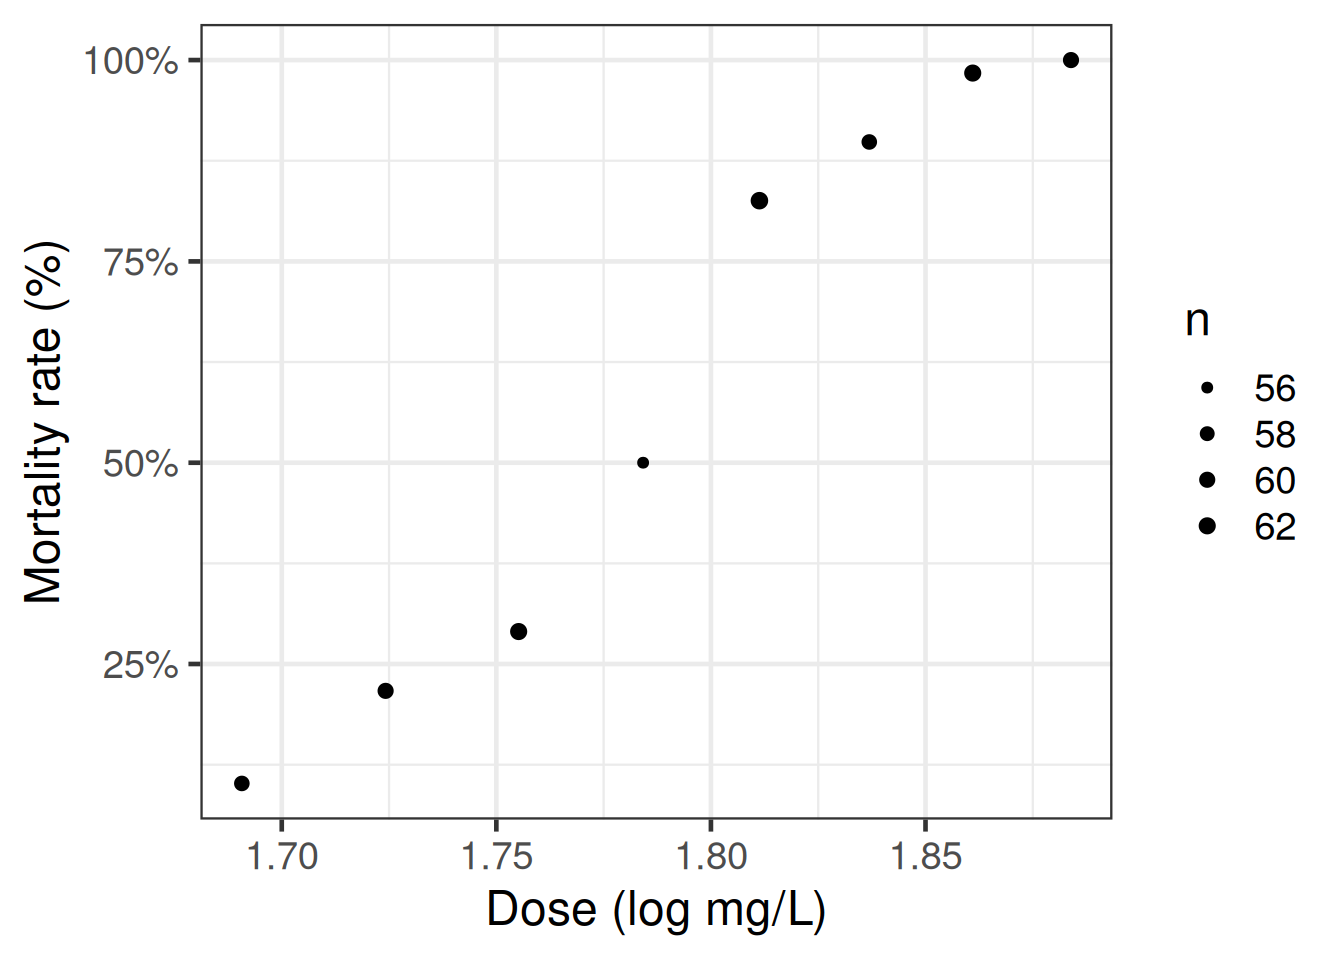
Table 1: Mortality rates of adult flour beetles after five hours’ exposure to gaseous carbon disulphide [8]. The dose column holds the base-10 logarithm of the dose in mg/L, and the models use it as is; the figures show the dose itself, in mg/L, on a log-spaced axis.
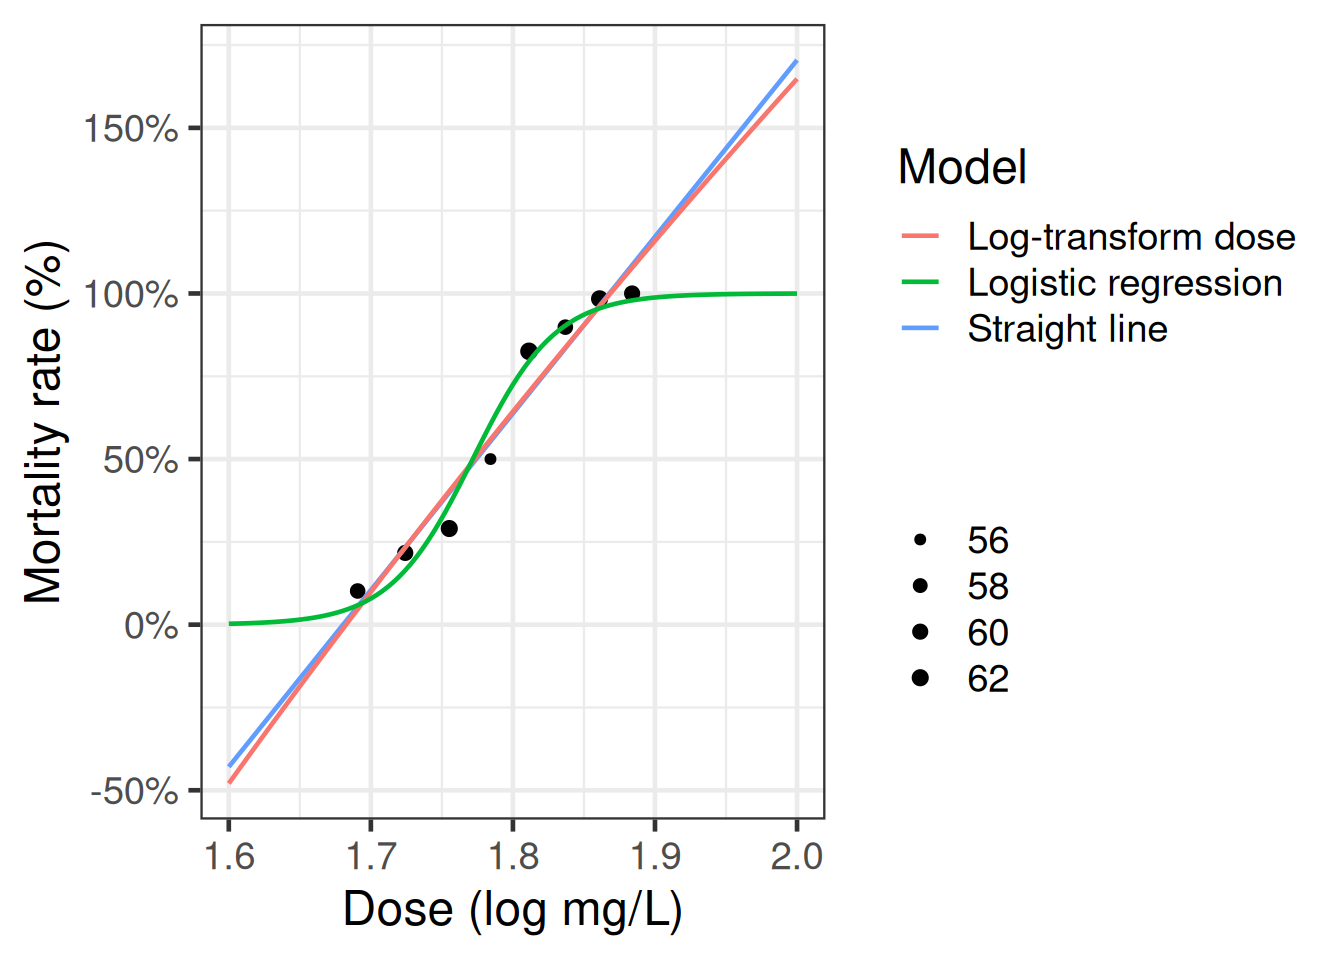
Figure 1: Mortality rates of adult flour beetles after five hours’ exposure to gaseous carbon disulphide [8]
Why don’t we use linear regression?
[R code]
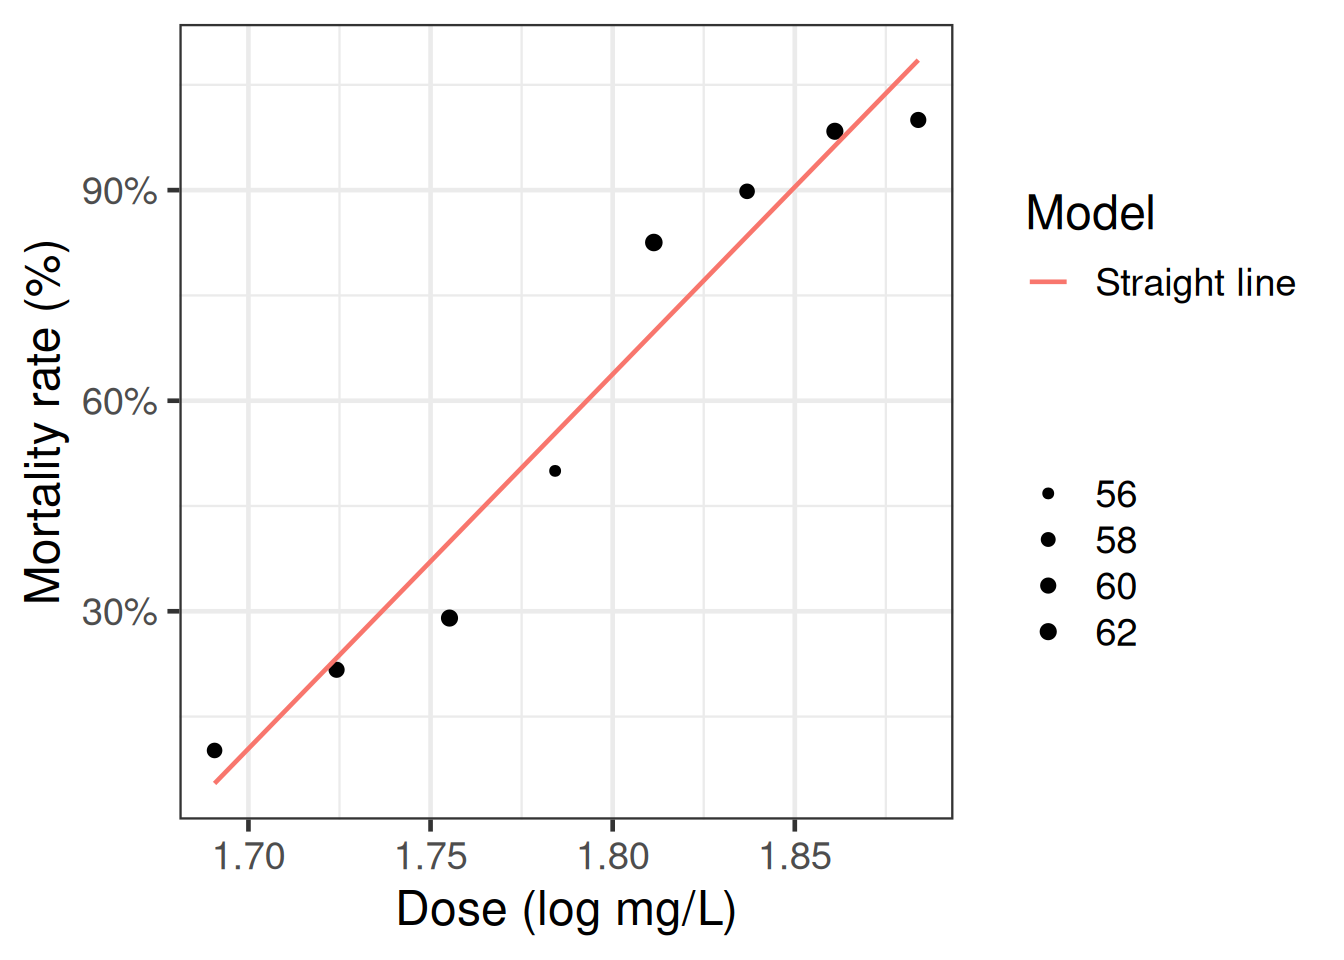
beetles_long <- beetles |>reframe(.by =everything(),outcome =c(rep(1, times = died),rep(0, times = survived) ) ) |>as_tibble()# `dose` is log10 of the dose in mg/L, and the models use it as is;# the plot functions take mg/L and convert:lm1 <- beetles_long |>lm(formula = outcome ~ dose)f_linear <-function(x) predict(lm1, newdata =data.frame(dose =log10(x)))plot2 <- plot1 +geom_function(fun = f_linear,aes(col ="Straight line") ) +labs(colour ="Model", size ="")plot2 |>print()
Figure 2: Mortality rates of adult flour beetles after five hours’ exposure to gaseous carbon disulphide [8]
Zoom out
[R code]
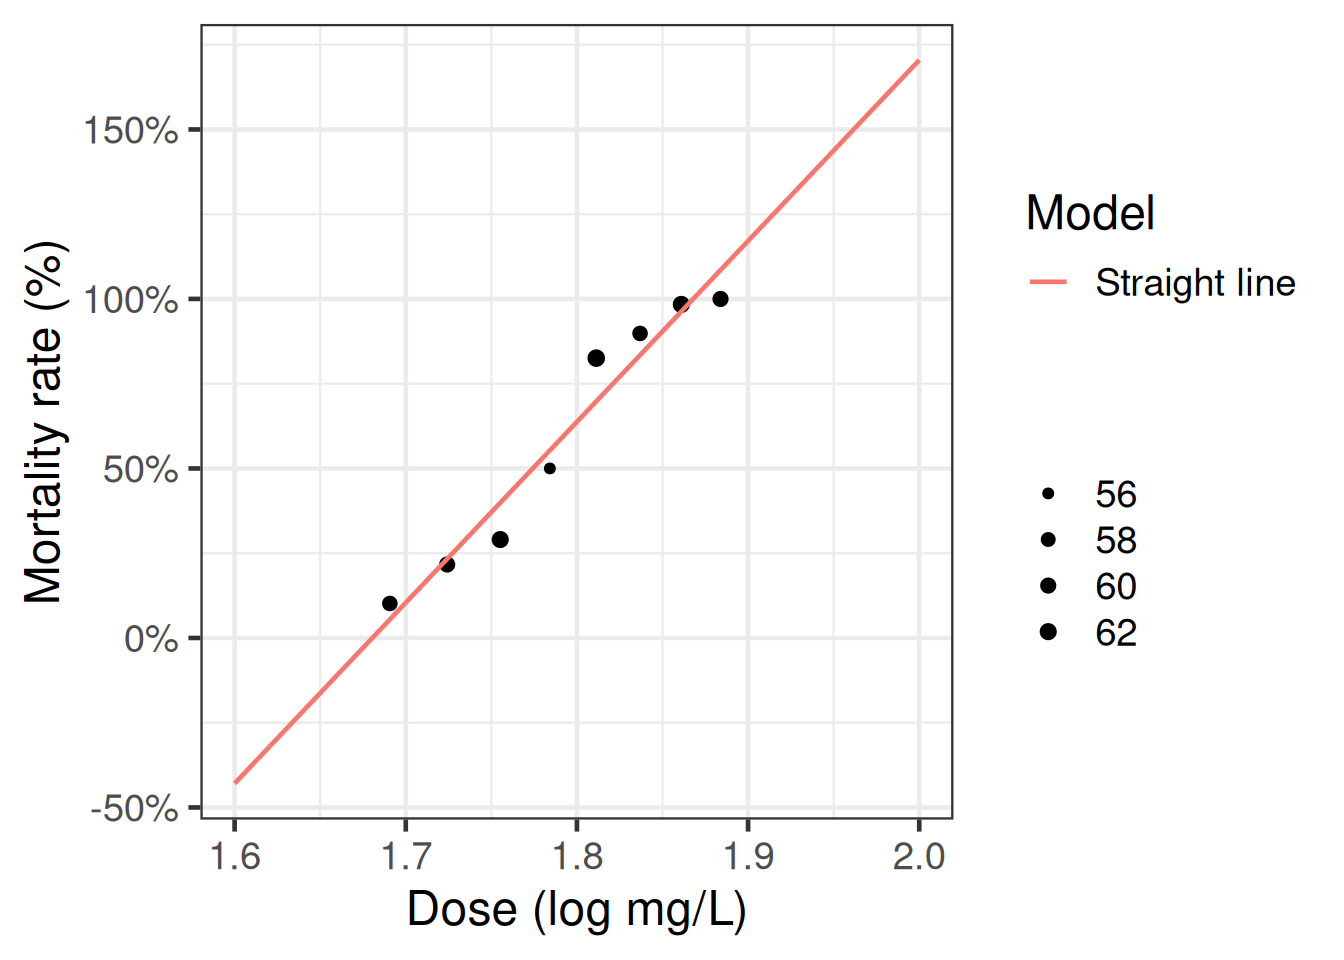
(plot2 +expand_limits(x =c(40, 100))) |>print()
Figure 3: Mortality rates of adult flour beetles after five hours’ exposure to gaseous carbon disulphide [8]
Corollary 1 (Derivative of odds function in terms of odds)\[\frac{\partial \omega}{\partial \pi} = {\mathopen{}\left(1+\omega\right)\mathclose{}}^{2}\]
\[
\begin{aligned}
\frac{\partial \pi}{\partial \omega}
&= {\mathopen{}\left(\frac{\partial \omega}{\partial \pi}\right)\mathclose{}}^{-1}
&& \text{(inverse function rule)}
\\ &= {\mathopen{}\left(\frac{1}{{\mathopen{}\left(1-\pi\right)\mathclose{}}^{2}}\right)\mathclose{}}^{-1}
&& \text{(derivative of odds function)}
\\ &= {\mathopen{}\left(1-\pi\right)\mathclose{}}^{2}
&& \text{(the reciprocal of a reciprocal is the original quantity)}
\\ &= {\mathopen{}\left(\frac{1}{1+\omega}\right)\mathclose{}}^{2}
&& \text{(substitute } 1-\pi= \frac{1}{1+\omega}\text{)}
\\ &= \frac{1}{{\mathopen{}\left(1+\omega\right)\mathclose{}}^{2}}
&& \text{(the square of a reciprocal is the reciprocal of the square)}
\end{aligned}
\]
\[
\begin{aligned}
\frac{\partial \omega}{\partial \eta}
&= \omega
&& \text{(derivative of odds w.r.t. log-odds)}
\\ &= \frac{\pi}{1-\pi}
&& \text{(odds as a function of probability)}
\end{aligned}
\]
Theorem 8 (Derivative of probability w.r.t. log-odds)\[\frac{\partial \pi}{\partial \eta} = \pi (1-\pi)\]
Corollary 3 (Derivative of probability w.r.t. linear predictor as a variance) If \(\pi = \Pr(Y=1| \mathord{\smash[b]{\underset{\raise.3ex\hbox{$\scriptstyle\sim$}}{X}}\vphantom{X}}=\mathord{\smash[b]{\underset{\raise.3ex\hbox{$\scriptstyle\sim$}}{x}}\vphantom{x}})\), then:
Proof. Since \(Y\) is a binary (0/1) outcome with \(\Pr(Y=1|\mathord{\smash[b]{\underset{\raise.3ex\hbox{$\scriptstyle\sim$}}{X}}\vphantom{X}}=\mathord{\smash[b]{\underset{\raise.3ex\hbox{$\scriptstyle\sim$}}{x}}\vphantom{x}}) = \pi\), the conditional distribution of \(Y\) given \(\mathord{\smash[b]{\underset{\raise.3ex\hbox{$\scriptstyle\sim$}}{X}}\vphantom{X}}=\mathord{\smash[b]{\underset{\raise.3ex\hbox{$\scriptstyle\sim$}}{x}}\vphantom{x}}\) is Bernoulli with parameter \(\pi\).
\[
\begin{aligned}
{\operatorname{expit}'\mathopen{}\left\{\eta\right\}\mathclose{}}
&= \frac{\partial \pi}{\partial \eta}
&& \text{(probability via the expit function: } \pi= {\operatorname{expit}\mathopen{}\left\{\eta\right\}\mathclose{}}\text{)}
\\ &= \pi(1-\pi)
&& \text{(derivative of probability w.r.t. log-odds)}
\\ &= {\operatorname{expit}\mathopen{}\left\{\eta\right\}\mathclose{}}(1 - {\operatorname{expit}\mathopen{}\left\{\eta\right\}\mathclose{}})
&& \text{(substitute } \pi= {\operatorname{expit}\mathopen{}\left\{\eta\right\}\mathclose{}}\text{)}
\end{aligned}
\]
Example 3 (Slope of expit for the beetles model)
[R code]
beetles_mid_row <-ceiling(nrow(beetles) /2)beetles_dose_mid <- beetles$dose[beetles_mid_row]beetles_eta_mid <-predict(beetles_glm_grouped, type ="link")[beetles_mid_row] |>unname()beetles_pi_mid <-predict(beetles_glm_grouped, type ="response")[beetles_mid_row] |>unname()beetles_slope_mid <- beetles_pi_mid * (1- beetles_pi_mid)
Consider the grouped-data logistic regression model for the beetles data (Table 2). At the middle (4th of 8) dose in the dataset, \(x = 1.7842\), the fitted log-odds of death is \(\hat{\eta} = 0.4277\), and the fitted probability of death is \(\hat{\pi} = {\operatorname{expit}\mathopen{}\left\{0.4277\right\}\mathclose{}} = 0.6053\). By Corollary 4, the slope of the expit function at this fitted log-odds value is:
Table 6: Matrix of logistic regression derivatives (\(p\) = number of predictors, \(\eta\stackrel{\text{def}}{=}\mathord{\smash[b]{\underset{\raise.3ex\hbox{$\scriptstyle\sim$}}{x}}\vphantom{x}} \cdot \mathord{\smash[b]{\underset{\raise.3ex\hbox{$\scriptstyle\sim$}}{\beta}}\vphantom{\beta}}\), \(\omega\stackrel{\text{def}}{=}{\operatorname{exp}\mathopen{}\left\{\eta\right\}\mathclose{}}\), \(\pi\stackrel{\text{def}}{=}\omega/ (1 + \omega)\)). Each entry is the derivative of the column quantity with respect to the row quantity. Entries marked “undef” are not defined because the vector-to-scalar map is not invertible: the scalar row quantity does not determine the vector column quantity.
Proof. Differentiating the linear predictor\(\eta(\mathord{\smash[b]{\underset{\raise.3ex\hbox{$\scriptstyle\sim$}}{x}}\vphantom{x}}) = \mathord{\smash[b]{\underset{\raise.3ex\hbox{$\scriptstyle\sim$}}{x}}\vphantom{x}}\cdot \mathord{\smash[b]{\underset{\raise.3ex\hbox{$\scriptstyle\sim$}}{\beta}}\vphantom{\beta}}\) with respect to the covariate vector \(\mathord{\smash[b]{\underset{\raise.3ex\hbox{$\scriptstyle\sim$}}{x}}\vphantom{x}}\), using the derivative of a linear combination:
\[
\begin{aligned}
\frac{\partial \eta}{\partial \mathord{\smash[b]{\underset{\raise.3ex\hbox{$\scriptstyle\sim$}}{x}}\vphantom{x}}} &= \frac{\partial}{\partial \mathord{\smash[b]{\underset{\raise.3ex\hbox{$\scriptstyle\sim$}}{x}}\vphantom{x}}} (\mathord{\smash[b]{\underset{\raise.3ex\hbox{$\scriptstyle\sim$}}{x}}\vphantom{x}}\cdot \mathord{\smash[b]{\underset{\raise.3ex\hbox{$\scriptstyle\sim$}}{\beta}}\vphantom{\beta}})
&& \text{(logistic regression's linear-predictor assumption)}
\\
&= \mathord{\smash[b]{\underset{\raise.3ex\hbox{$\scriptstyle\sim$}}{\beta}}\vphantom{\beta}}
&& \text{(derivative of a linear combination w.r.t. covariate vector)}
\end{aligned}
\tag{6}\]
Example 4 (Evaluating the gradient of the log-odds) Consider a logistic regression model with an intercept and one predictor, so \(\mathord{\smash[b]{\underset{\raise.3ex\hbox{$\scriptstyle\sim$}}{x}}\vphantom{x}}= (1, x)'\), and coefficients \(\mathord{\smash[b]{\underset{\raise.3ex\hbox{$\scriptstyle\sim$}}{\beta}}\vphantom{\beta}}= (-2, 0.5)'\). By Lemma 3:
The second entry says that increasing the predictor \(x\) by one unit changes the log-odds by \(0.5\), whatever the values of \(x\) and the intercept term.
Exercise 8 Consider a logistic regression model with a single predictor, \(X\):
Example 5 (The slope of a logistic probability curve) Suppose \(\alpha = -2\) and \(\beta = 0.5\) in the single-predictor logistic regression model of Equation 8. The code below approximates \(\frac{\partial \pi}{\partial x}\) at \(x = 1\) with a central difference, and compares it with the formula of Corollary 5:
In order to interpret \(\beta_j\): differentiate or difference \({\color{red}{\eta(\mathord{\smash[b]{\underset{\raise.3ex\hbox{$\scriptstyle\sim$}}{x}}\vphantom{x}})}}\) with respect to \({\color{red}{x_j}}\) (depending on whether \(x_j\) is continuous or discrete, respectively):
In order to find the MLE\(\hat{\mathord{\smash[b]{\underset{\raise.3ex\hbox{$\scriptstyle\sim$}}{\beta}}\vphantom{\beta}}}\): differentiate the log-likelihood function\({\color{teal}{\ell(\mathord{\smash[b]{\underset{\raise.3ex\hbox{$\scriptstyle\sim$}}{\beta}}\vphantom{\beta}})}}\) with respect to \({\color{teal}{\mathord{\smash[b]{\underset{\raise.3ex\hbox{$\scriptstyle\sim$}}{\beta}}\vphantom{\beta}}}}\):
Let \(\mathord{\smash[b]{\underset{\raise.3ex\hbox{$\scriptstyle\sim$}}{x}}\vphantom{x}}\) and \(\mathord{{\mathord{\smash[b]{\underset{\raise.3ex\hbox{$\scriptstyle\sim$}}{x}}\vphantom{x}}^*}}\) be two covariate patterns, representing two individuals or two subpopulations.
Find a concise formula to compute the odds ratio comparing covariate patterns \(\mathord{\smash[b]{\underset{\raise.3ex\hbox{$\scriptstyle\sim$}}{x}}\vphantom{x}}\) and \(\mathord{{\mathord{\smash[b]{\underset{\raise.3ex\hbox{$\scriptstyle\sim$}}{x}}\vphantom{x}}^*}}\):
Solution 9 (General formula for odds ratios in logistic regression). \[
\begin{aligned}
\text{ϙ}_{\omega}(\mathord{\smash[b]{\underset{\raise.3ex\hbox{$\scriptstyle\sim$}}{x}}\vphantom{x}},\mathord{{\mathord{\smash[b]{\underset{\raise.3ex\hbox{$\scriptstyle\sim$}}{x}}\vphantom{x}}^*}})
&\stackrel{\text{def}}{=}\frac{\omega(\mathord{\smash[b]{\underset{\raise.3ex\hbox{$\scriptstyle\sim$}}{x}}\vphantom{x}})}{\omega(\mathord{{\mathord{\smash[b]{\underset{\raise.3ex\hbox{$\scriptstyle\sim$}}{x}}\vphantom{x}}^*}})}
\\
&= \frac{{\operatorname{exp}\mathopen{}\left\{\eta(\mathord{\smash[b]{\underset{\raise.3ex\hbox{$\scriptstyle\sim$}}{x}}\vphantom{x}})\right\}\mathclose{}}}{{\operatorname{exp}\mathopen{}\left\{\eta(\mathord{{\mathord{\smash[b]{\underset{\raise.3ex\hbox{$\scriptstyle\sim$}}{x}}\vphantom{x}}^*}})\right\}\mathclose{}}}
\\
&= {\operatorname{exp}\mathopen{}\left\{{\color{red}{\eta(\mathord{\smash[b]{\underset{\raise.3ex\hbox{$\scriptstyle\sim$}}{x}}\vphantom{x}}) - \eta(\mathord{{\mathord{\smash[b]{\underset{\raise.3ex\hbox{$\scriptstyle\sim$}}{x}}\vphantom{x}}^*}})}}\right\}\mathclose{}}
\end{aligned}
\]
Lemma 4 (General formula for odds ratios in logistic regression)\[\text{ϙ}_{\omega}(\mathord{\smash[b]{\underset{\raise.3ex\hbox{$\scriptstyle\sim$}}{x}}\vphantom{x}},\mathord{{\mathord{\smash[b]{\underset{\raise.3ex\hbox{$\scriptstyle\sim$}}{x}}\vphantom{x}}^*}}) = {\operatorname{exp}\mathopen{}\left\{{\color{red}{\eta(\mathord{\smash[b]{\underset{\raise.3ex\hbox{$\scriptstyle\sim$}}{x}}\vphantom{x}}) - \eta(\mathord{{\mathord{\smash[b]{\underset{\raise.3ex\hbox{$\scriptstyle\sim$}}{x}}\vphantom{x}}^*}})}}\right\}\mathclose{}} \tag{10}\]
Corollary 6 (Shorthand general formula for odds ratios in logistic regression)\[\text{ϙ}_{\omega}(\mathord{\smash[b]{\underset{\raise.3ex\hbox{$\scriptstyle\sim$}}{x}}\vphantom{x}},\mathord{{\mathord{\smash[b]{\underset{\raise.3ex\hbox{$\scriptstyle\sim$}}{x}}\vphantom{x}}^*}}) = {\operatorname{exp}\mathopen{}\left\{{\color{red}{\Delta\eta}}\right\}\mathclose{}} \tag{11}\]
Exercise 10 (Difference in log-odds) Find a concise expression for the difference in log-odds: \[\Delta\eta\stackrel{\text{def}}{=}{\color{red}{\eta(\mathord{\smash[b]{\underset{\raise.3ex\hbox{$\scriptstyle\sim$}}{x}}\vphantom{x}}) - \eta(\mathord{{\mathord{\smash[b]{\underset{\raise.3ex\hbox{$\scriptstyle\sim$}}{x}}\vphantom{x}}^*}})}}\]
Exercise 11 Find an expression for the odds ratio\(\text{ϙ}_{\omega}(\mathord{\smash[b]{\underset{\raise.3ex\hbox{$\scriptstyle\sim$}}{x}}\vphantom{x}},\mathord{{\mathord{\smash[b]{\underset{\raise.3ex\hbox{$\scriptstyle\sim$}}{x}}\vphantom{x}}^*}})\) in terms of \(\Delta\mathord{\smash[b]{\underset{\raise.3ex\hbox{$\scriptstyle\sim$}}{x}}\vphantom{x}}\) and \(\mathord{\smash[b]{\underset{\raise.3ex\hbox{$\scriptstyle\sim$}}{\beta}}\vphantom{\beta}}\).
Theorem 9 (Odds ratio from difference in covariate patterns) The odds ratio comparing covariate patterns \(\mathord{\smash[b]{\underset{\raise.3ex\hbox{$\scriptstyle\sim$}}{x}}\vphantom{x}}\) and \(\mathord{{\mathord{\smash[b]{\underset{\raise.3ex\hbox{$\scriptstyle\sim$}}{x}}\vphantom{x}}^*}}\) is:
Example 6 (Odds ratio between adjacent beetle dose levels)
The estimated dose coefficient for that model is \(\hat{\beta}_1 = 34.270326\).
Consider the two covariate patterns given by the two lowest dose levels in the beetles data: \(\mathord{\smash[b]{\underset{\raise.3ex\hbox{$\scriptstyle\sim$}}{x}}\vphantom{x}}= (1, 1.7242)^{\top}\) and \(\mathord{{\mathord{\smash[b]{\underset{\raise.3ex\hbox{$\scriptstyle\sim$}}{x}}\vphantom{x}}^*}}= (1, 1.6907)^{\top}\) (intercept and dose). Their difference is \(\Delta\mathord{\smash[b]{\underset{\raise.3ex\hbox{$\scriptstyle\sim$}}{x}}\vphantom{x}}= \mathord{\smash[b]{\underset{\raise.3ex\hbox{$\scriptstyle\sim$}}{x}}\vphantom{x}}- \mathord{{\mathord{\smash[b]{\underset{\raise.3ex\hbox{$\scriptstyle\sim$}}{x}}\vphantom{x}}^*}}= (0, 0.0335)^{\top}\).
\[
\begin{aligned}
\hat{\text{ϙ}}_{\omega}(\mathord{\smash[b]{\underset{\raise.3ex\hbox{$\scriptstyle\sim$}}{x}}\vphantom{x}},\mathord{{\mathord{\smash[b]{\underset{\raise.3ex\hbox{$\scriptstyle\sim$}}{x}}\vphantom{x}}^*}})
&= {\operatorname{exp}\mathopen{}\left\{(\Delta\mathord{\smash[b]{\underset{\raise.3ex\hbox{$\scriptstyle\sim$}}{x}}\vphantom{x}})\cdot \hat{\beta}\right\}\mathclose{}}
&& \text{(odds ratio from difference in covariate patterns)}
\\
&= {\operatorname{exp}\mathopen{}\left\{0\cdot\hat{\beta}_0 + (0.0335)\cdot \hat{\beta}_1\right\}\mathclose{}}
&& \text{(expand the dot product)}
\\
&= {\operatorname{exp}\mathopen{}\left\{(0.0335)\cdot (34.270326)\right\}\mathclose{}}
&& \text{(substitute } \hat{\beta}_1\text{)}
\\
&= 3.152059
&& \text{(evaluate the exponential)}
\end{aligned}
\]
Corollary 8 (Log odds ratio equals the difference in log-odds)\[{\operatorname{log}\mathopen{}\left\{\text{ϙ}_{\omega}(\mathord{\smash[b]{\underset{\raise.3ex\hbox{$\scriptstyle\sim$}}{x}}\vphantom{x}},\mathord{{\mathord{\smash[b]{\underset{\raise.3ex\hbox{$\scriptstyle\sim$}}{x}}\vphantom{x}}^*}})\right\}\mathclose{}} = \Delta\eta\]
\[
\begin{aligned}
{\operatorname{log}\mathopen{}\left\{\text{ϙ}_{\omega}(\mathord{\smash[b]{\underset{\raise.3ex\hbox{$\scriptstyle\sim$}}{x}}\vphantom{x}},\mathord{{\mathord{\smash[b]{\underset{\raise.3ex\hbox{$\scriptstyle\sim$}}{x}}\vphantom{x}}^*}})\right\}\mathclose{}} &= {\operatorname{log}\mathopen{}\left\{{\operatorname{exp}\mathopen{}\left\{\Delta\eta\right\}\mathclose{}}\right\}\mathclose{}}
&& \text{(take the logarithm of both sides of the odds-ratio corollary)}
\\
&= \Delta\eta
&& \text{(natural logarithm and exponential are inverse functions)}
\end{aligned}
\tag{13}\]
Example 7 (Log odds ratio example) If the difference in log-odds between two subjects is \(\Delta\eta= 0.693\), then by Corollary 6, the odds ratio is \(\text{ϙ}_{\omega}= {\operatorname{exp}\mathopen{}\left\{0.693\right\}\mathclose{}} \approx 2.0\).
Taking the logarithm yields \({\operatorname{log}\mathopen{}\left\{\text{ϙ}_{\omega}\right\}\mathclose{}} = {\operatorname{log}\mathopen{}\left\{{\operatorname{exp}\mathopen{}\left\{0.693\right\}\mathclose{}}\right\}\mathclose{}} = 0.693 = \Delta\eta\), illustrating Corollary 8; the rounded odds ratio gives \({\operatorname{log}\mathopen{}\left\{2.0\right\}\mathclose{}} \approx 0.693\).
We estimate the coefficients \(\mathord{\smash[b]{\underset{\raise.3ex\hbox{$\scriptstyle\sim$}}{\beta}}\vphantom{\beta}}\) of the logistic regression model, which has three parts:
Subtracting the average dose from dose makes the intercept the log-odds of death at the average dose. It also moves the likelihood surface closer to the origin, which makes the surface easier to plot.
Example 8 (Evaluating gradient of odds w.r.t. coefficients) Consider a subject with covariate vector \(\mathord{\smash[b]{\underset{\raise.3ex\hbox{$\scriptstyle\sim$}}{x}}\vphantom{x}}= (1, 2)'\) and linear predictor\(\eta = \mathord{\smash[b]{\underset{\raise.3ex\hbox{$\scriptstyle\sim$}}{x}}\vphantom{x}}'\mathord{\smash[b]{\underset{\raise.3ex\hbox{$\scriptstyle\sim$}}{\beta}}\vphantom{\beta}}= 0\), so \(\omega= {\operatorname{exp}\mathopen{}\left\{0\right\}\mathclose{}} = 1\).
The gradient vector indicates that increasing \(\beta_0\) or \(\beta_1\) increases the odds at rates 1 and 2, respectively.
Corollary 9 (Gradient of odds w.r.t. coefficients in terms of probability)\[
\underbrace{\frac{\partial \omega}{\partial \mathord{\smash[b]{\underset{\raise.3ex\hbox{$\scriptstyle\sim$}}{\beta}}\vphantom{\beta}}}}_{(p+1) \times 1}
= \underbrace{\mathord{\smash[b]{\underset{\raise.3ex\hbox{$\scriptstyle\sim$}}{x}}\vphantom{x}}}_{(p+1) \times 1} \cdot \frac{\pi}{1-\pi}
\tag{19}\]
Proof. By Theorem 10 and the definition of odds in terms of probability \(\pi\):
\[
\begin{aligned}
\frac{\partial \omega}{\partial \mathord{\smash[b]{\underset{\raise.3ex\hbox{$\scriptstyle\sim$}}{\beta}}\vphantom{\beta}}}
&= {\color{red}{\mathord{\smash[b]{\underset{\raise.3ex\hbox{$\scriptstyle\sim$}}{x}}\vphantom{x}}}} {\color{teal}{\omega}}
&& \text{(gradient of odds w.r.t. coefficients)}
\\
&= {\color{red}{\mathord{\smash[b]{\underset{\raise.3ex\hbox{$\scriptstyle\sim$}}{x}}\vphantom{x}}}} \frac{\pi}{1-\pi}
&& \text{(odds in terms of probability: } \omega= \frac{\pi}{1-\pi} \text{)}
\end{aligned}
\tag{20}\]
Example 9 (Gradient of odds in terms of probability) For a model where a subject has event probability \(\pi = 0.5\) and covariate vector \(\mathord{\smash[b]{\underset{\raise.3ex\hbox{$\scriptstyle\sim$}}{x}}\vphantom{x}}= (1, 3)'\), Corollary 9 gives:
Here, \(\mathbf{X}_{\cdot j} \stackrel{\text{def}}{=}(x_{1j}, \ldots, x_{nj})\) denotes the \(j^{th}\) column of the design matrix\(\mathbf{X}\) (the \(n\)-vector of covariate \(j\)’s values across all observations), in contrast with \(\mathord{\smash[b]{\underset{\raise.3ex\hbox{$\scriptstyle\sim$}}{x}}\vphantom{x}}_i\), which denotes observation \(i\)’s covariate row vector (a \(p\)-vector).
Thus, the score equation\(\mathord{\smash[b]{\underset{\raise.3ex\hbox{$\scriptstyle\sim$}}{\ell'}}\vphantom{\ell'}} = \mathbf{0}_{(p+1) \times 1}\) means that for the MLE\(\hat{\mathord{\smash[b]{\underset{\raise.3ex\hbox{$\scriptstyle\sim$}}{\beta}}\vphantom{\beta}}}\):
the sum of the errors (aka deviations) equals 0:
\[\sum_{i=1}^n\varepsilon_i = 0\]
the sums of the errors times each covariate also equal 0:
Example 10 In our model for the beetles data, we only have an intercept plus one covariate, gas concentration (\(c\)): \[\mathord{\smash[b]{\underset{\raise.3ex\hbox{$\scriptstyle\sim$}}{x}}\vphantom{x}}= (1, c)\]
If \(c_i\) is the gas concentration for the beetle in observation \(i\), and \(\mathord{\smash[b]{\underset{\raise.3ex\hbox{$\scriptstyle\sim$}}{c}}\vphantom{c}} = (c_1, c_2, ...c_n)\), then the score equation \(\mathord{\smash[b]{\underset{\raise.3ex\hbox{$\scriptstyle\sim$}}{\ell'}}\vphantom{\ell'}} = \mathbf{0}_{2 \times 1}\) means that for the MLE \(\hat{\mathord{\smash[b]{\underset{\raise.3ex\hbox{$\scriptstyle\sim$}}{\beta}}\vphantom{\beta}}}\):
the sum of the errors (aka deviations) equals 0:
\[\sum_{i=1}^n\varepsilon_i = 0\]
the weighted sum of the error times the gas concentrations equals 0:
\[\sum_{i=1}^nc_i \varepsilon_i = 0 \]
Exercise 15 Implement and graph the score function for the beetles data
where \(\mathbf{D} \stackrel{\text{def}}{=}\text{diag}({\operatorname{Var}\mathopen{}\left(Y_i|\mathord{\smash[b]{\underset{\raise.3ex\hbox{$\scriptstyle\sim$}}{X}}\vphantom{X}}_i=\mathord{\smash[b]{\underset{\raise.3ex\hbox{$\scriptstyle\sim$}}{x}}\vphantom{x}}_i\right)\mathclose{}})\) is the diagonal matrix whose \(i^{th}\) diagonal element is \({\operatorname{Var}\mathopen{}\left(Y_i|\mathord{\smash[b]{\underset{\raise.3ex\hbox{$\scriptstyle\sim$}}{X}}\vphantom{X}}_i=\mathord{\smash[b]{\underset{\raise.3ex\hbox{$\scriptstyle\sim$}}{x}}\vphantom{x}}_i\right)\mathclose{}}\).
Remark 1 (The logistic log-likelihood is concave). The Hessian\(\ell''(\mathord{\smash[b]{\underset{\raise.3ex\hbox{$\scriptstyle\sim$}}{\beta}}\vphantom{\beta}}) = -\mathbf{X}^{\top}\mathbf{D}\mathbf{X}\) (Equation 27) is negative semi-definite for every \(\mathord{\smash[b]{\underset{\raise.3ex\hbox{$\scriptstyle\sim$}}{\beta}}\vphantom{\beta}}\), because the diagonal entries of \(\mathbf{D}\) are \({\operatorname{Var}\mathopen{}\left(Y_i|\mathord{\smash[b]{\underset{\raise.3ex\hbox{$\scriptstyle\sim$}}{X}}\vphantom{X}}_i=\mathord{\smash[b]{\underset{\raise.3ex\hbox{$\scriptstyle\sim$}}{x}}\vphantom{x}}_i\right)\mathclose{}} = \pi_i(1-\pi_i) \geq 0\). Since the diagonal entries are non-negative, \(\mathbf{D}^{1/2} \stackrel{\text{def}}{=}\text{diag}\mathopen{}\left(\sqrt{\pi_i(1-\pi_i)}\right)\mathclose{}\) is well-defined, and for any vector \(\mathord{\smash[b]{\underset{\raise.3ex\hbox{$\scriptstyle\sim$}}{v}}\vphantom{v}} \in \mathbb{R}^{p+1}\):
A twice-differentiable function whose Hessian is negative semi-definite everywhere is concave[9, Sec. 3.1.4], so the log-likelihood\(\ell(\mathord{\smash[b]{\underset{\raise.3ex\hbox{$\scriptstyle\sim$}}{\beta}}\vphantom{\beta}})\) is concave, and every stationary point (every solution of the score equation\(\mathord{\smash[b]{\underset{\raise.3ex\hbox{$\scriptstyle\sim$}}{\ell'}}\vphantom{\ell'}}(\mathord{\smash[b]{\underset{\raise.3ex\hbox{$\scriptstyle\sim$}}{\beta}}\vphantom{\beta}}) = \mathbf{0}_{(p+1) \times 1}\)) is a global maximum[9, Sec. 4.2.2]. In fact, since \(\pi_i = {\operatorname{expit}\mathopen{}\left\{\mathord{\smash[b]{\underset{\raise.3ex\hbox{$\scriptstyle\sim$}}{x}}\vphantom{x}}_i \cdot \mathord{\smash[b]{\underset{\raise.3ex\hbox{$\scriptstyle\sim$}}{\beta}}\vphantom{\beta}}\right\}\mathclose{}} \in (0,1)\) strictly, every diagonal entry \(\pi_i(1-\pi_i)\) is strictly positive; so when \(\mathbf{X}\) has full column rank, \(\mathbf{D}^{1/2}\mathbf{X}\mathord{\smash[b]{\underset{\raise.3ex\hbox{$\scriptstyle\sim$}}{v}}\vphantom{v}} = \mathbf{0}_{n \times 1}\) only for \(\mathord{\smash[b]{\underset{\raise.3ex\hbox{$\scriptstyle\sim$}}{v}}\vphantom{v}} = \mathbf{0}_{(p+1) \times 1}\), the Hessian is negative definite, the log-likelihood is strictly concave, and the maximum is unique. Consequently, when the Newton-Raphson algorithm converges, it converges to the unique global maximum likelihood estimate, not merely to a local optimum.
In logistic regression, \(\mathord{\smash[b]{\underset{\raise.3ex\hbox{$\scriptstyle\sim$}}{\beta}}\vphantom{\beta}}\) appears inside \({\operatorname{expit}\mathopen{}\left\{{\mathord{\smash[b]{\underset{\raise.3ex\hbox{$\scriptstyle\sim$}}{x}}\vphantom{x}}_i}^{\top}\mathord{\smash[b]{\underset{\raise.3ex\hbox{$\scriptstyle\sim$}}{\beta}}\vphantom{\beta}}\right\}\mathclose{}}\) in every term of Equation 29. The equations are therefore non-linear in \(\mathord{\smash[b]{\underset{\raise.3ex\hbox{$\scriptstyle\sim$}}{\beta}}\vphantom{\beta}}\). No rearrangement isolates \(\mathord{\smash[b]{\underset{\raise.3ex\hbox{$\scriptstyle\sim$}}{\beta}}\vphantom{\beta}}\) on one side. A system of \(p+1\) non-linear equations in \(p+1\) unknowns has no general solution formula.
The log-likelihood is concave, so every solution of the score equation is a global maximum. Concavity does not give a formula for such a solution.
Some models do have closed-form solutions. In the intercept-only model, the MLE of the log-odds is the log-odds of the sample proportion of the \(y_i\) that equal 1.
For covariate coefficients (\(k \neq 0\)), \(e^{\beta_k}\) is an odds ratio (the multiplicative change in odds per 1-unit increase in \(x_k\), holding all other covariates fixed). For the intercept (\(k = 0\)), \(e^{\beta_0}\) is the baseline odds (the odds when all covariates equal zero), not an odds ratio.
Table 12: Wald tests and 95% CIs for beetles logistic regression
Parameter
Log-Odds
SE
95% CI
z
p
(Intercept)
-60.72
5.18
(-71.44, -51.08)
-11.72
< .001
dose
34.27
2.91
(28.85, 40.30)
11.77
< .001
Pass exponentiate = TRUE to parameters() to report exponentiated coefficients. The intercept is then interpreted as baseline odds, while the non-intercept coefficients are odds ratios:
Table 13: Exponentiated coefficients and 95% CIs for beetles
Parameter
Odds Ratio
SE
95% CI
z
p
(Intercept)
4.27e-27
2.21e-26
(9.39e-32, 6.56e-23)
-11.72
< .001
dose
7.65e+14
2.23e+15
(3.40e+12, 3.18e+17)
11.77
< .001
6.2 Inference for predicted probabilities
Exercise 18 Given a maximum likelihood estimate\(\hat{\beta}\) and a corresponding estimated covariance matrix\(\hat{\Sigma}\stackrel{\text{def}}{=}\widehat{\operatorname{Cov}}(\hat{\beta})\), calculate a 95% confidence interval for the predicted probability \(\pi(\mathord{\smash[b]{\underset{\raise.3ex\hbox{$\scriptstyle\sim$}}{x}}\vphantom{x}}) = \Pr(Y = 1 | \mathord{\smash[b]{\underset{\raise.3ex\hbox{$\scriptstyle\sim$}}{X}}\vphantom{X}}= \mathord{\smash[b]{\underset{\raise.3ex\hbox{$\scriptstyle\sim$}}{x}}\vphantom{x}})\).
Theorem 14 (Confidence interval for a predicted probability) In a logistic regression model, let \((L, R)\) be a 95% confidence interval for the log-odds \(\eta(\mathord{\smash[b]{\underset{\raise.3ex\hbox{$\scriptstyle\sim$}}{x}}\vphantom{x}}) = \mathord{\smash[b]{\underset{\raise.3ex\hbox{$\scriptstyle\sim$}}{x}}\vphantom{x}} \cdot \mathord{\smash[b]{\underset{\raise.3ex\hbox{$\scriptstyle\sim$}}{\beta}}\vphantom{\beta}}\). Then:
is a 95% confidence interval for the predicted probability \(\pi(\mathord{\smash[b]{\underset{\raise.3ex\hbox{$\scriptstyle\sim$}}{x}}\vphantom{x}}) = \Pr(Y = 1 | \mathord{\smash[b]{\underset{\raise.3ex\hbox{$\scriptstyle\sim$}}{X}}\vphantom{X}}= \mathord{\smash[b]{\underset{\raise.3ex\hbox{$\scriptstyle\sim$}}{x}}\vphantom{x}})\).
Example 11 (Confidence interval for a beetle mortality probability) For the beetleslogistic regression model (beetles_glm_ungrouped), the code below first computes a 95% confidence interval for the log-odds at dose 1.8, then applies \(\operatorname{expit}\) to its endpoints as in Theorem 14:
The 95% confidence interval for the log-odds is (0.685, 1.253), so the 95% confidence interval for the probability of death is (0.665, 0.778), which stays inside \((0, 1)\) and contains the estimate 0.725.
Exercise 19 Find a 95% confidence interval for the log-odds \(\eta(\mathord{\smash[b]{\underset{\raise.3ex\hbox{$\scriptstyle\sim$}}{x}}\vphantom{x}}) = \mathord{\smash[b]{\underset{\raise.3ex\hbox{$\scriptstyle\sim$}}{x}}\vphantom{x}}'\mathord{\smash[b]{\underset{\raise.3ex\hbox{$\scriptstyle\sim$}}{\beta}}\vphantom{\beta}}\).
Solution 19. By the central limit theorem for MLEs, a 95% confidence interval for \(\eta(\mathord{\smash[b]{\underset{\raise.3ex\hbox{$\scriptstyle\sim$}}{x}}\vphantom{x}})\) can be constructed as:
where \(\hat\eta(\mathord{\smash[b]{\underset{\raise.3ex\hbox{$\scriptstyle\sim$}}{x}}\vphantom{x}}) = \mathord{\smash[b]{\underset{\raise.3ex\hbox{$\scriptstyle\sim$}}{x}}\vphantom{x}}'\hat{\beta}\).
Theorem 15 (Confidence interval for the log-odds) In a logistic regression model, let \(\hat{\beta}\) be the maximum likelihood estimate of \(\mathord{\smash[b]{\underset{\raise.3ex\hbox{$\scriptstyle\sim$}}{\beta}}\vphantom{\beta}}\), and let \(\hat\eta(\mathord{\smash[b]{\underset{\raise.3ex\hbox{$\scriptstyle\sim$}}{x}}\vphantom{x}}) = \mathord{\smash[b]{\underset{\raise.3ex\hbox{$\scriptstyle\sim$}}{x}}\vphantom{x}} \cdot \hat{\beta}\). For large samples, an approximate 95% confidence interval for the log-odds \(\eta(\mathord{\smash[b]{\underset{\raise.3ex\hbox{$\scriptstyle\sim$}}{x}}\vphantom{x}})\) is:
Example 12 (Confidence interval for a beetle log-odds) For the beetleslogistic regression model (beetles_glm_ungrouped), the code below applies Theorem 15 at dose 1.8, using the standard error from predict() and, as a check, the standard error from the estimated covariance matrix:
By the definition \(\hat\eta(\mathord{\smash[b]{\underset{\raise.3ex\hbox{$\scriptstyle\sim$}}{x}}\vphantom{x}}) = \mathord{\smash[b]{\underset{\raise.3ex\hbox{$\scriptstyle\sim$}}{x}}\vphantom{x}}'\hat{\beta}\) and the variance of a linear combination:
Theorem 16 (Variance of the estimated log-odds) In a logistic regression model, let \(\hat{\beta}\) be the maximum likelihood estimate of \(\mathord{\smash[b]{\underset{\raise.3ex\hbox{$\scriptstyle\sim$}}{\beta}}\vphantom{\beta}}\), let \(\Sigma \stackrel{\text{def}}{=}\operatorname{Cov}(\hat{\beta})\) be its covariance matrix, and let \(\hat\eta(\mathord{\smash[b]{\underset{\raise.3ex\hbox{$\scriptstyle\sim$}}{x}}\vphantom{x}}) = \mathord{\smash[b]{\underset{\raise.3ex\hbox{$\scriptstyle\sim$}}{x}}\vphantom{x}} \cdot \hat{\beta}\) be the estimated log-odds at covariate pattern \(\mathord{\smash[b]{\underset{\raise.3ex\hbox{$\scriptstyle\sim$}}{x}}\vphantom{x}}\). Then:
Example 13 (Variance of an estimated beetle log-odds) For the beetleslogistic regression model (beetles_glm_ungrouped), the code below applies Theorem 16 at \(\mathord{\smash[b]{\underset{\raise.3ex\hbox{$\scriptstyle\sim$}}{x}}\vphantom{x}}= (1, 1.8)^{\top}\), using the estimated covariance matrix of the coefficients in place of \(\Sigma\), and compares the result with the squared standard error from predict():
The quadratic form gives 0.02104, and the squared standard error from predict() is 0.02104, so the two agree.
Combining Equation 32 with the invariance property of MLEs gives an estimator for the variance and standard error:
Theorem 17 (Estimated variance and standard error of log-odds)\[
{\color{orange}{{\mathop{\widehat{\operatorname{Var}}}\nolimits\mathopen{}\left(\hat\eta(\mathord{\smash[b]{\underset{\raise.3ex\hbox{$\scriptstyle\sim$}}{x}}\vphantom{x}})\right)\mathclose{}}}} = {\color{orange}{{\mathord{\smash[b]{\underset{\raise.3ex\hbox{$\scriptstyle\sim$}}{x}}\vphantom{x}}}^{\top}\hat{\Sigma}\mathord{\smash[b]{\underset{\raise.3ex\hbox{$\scriptstyle\sim$}}{x}}\vphantom{x}}}}
\tag{33}\]
Proof. By Theorem 16, \({\operatorname{Var}\mathopen{}\left(\hat\eta(\mathord{\smash[b]{\underset{\raise.3ex\hbox{$\scriptstyle\sim$}}{x}}\vphantom{x}})\right)\mathclose{}} = {\mathord{\smash[b]{\underset{\raise.3ex\hbox{$\scriptstyle\sim$}}{x}}\vphantom{x}}}^{\top}\Sigma\mathord{\smash[b]{\underset{\raise.3ex\hbox{$\scriptstyle\sim$}}{x}}\vphantom{x}}\) (Equation 32). By the invariance property of MLEs, we estimate \(\Sigma\) with \(\hat{\Sigma}\stackrel{\text{def}}{=}\widehat{\operatorname{Cov}}(\hat{\beta})\), which yields Equation 33; taking the square root gives Equation 34.
Example 14 (Standard error and CI for a beetle log-odds)
Consider the covariate pattern \(\mathord{\smash[b]{\underset{\raise.3ex\hbox{$\scriptstyle\sim$}}{x}}\vphantom{x}}= (1, 1.8)^{\top}\), representing the intercept and a dose of 1.8.
By Equation 34, the estimated standard error of the log-odds is \({\mathop{\widehat{\operatorname{SE}}}\nolimits\mathopen{}\left(\hat\eta(\mathord{\smash[b]{\underset{\raise.3ex\hbox{$\scriptstyle\sim$}}{x}}\vphantom{x}})\right)\mathclose{}} = \sqrt{{\mathord{\smash[b]{\underset{\raise.3ex\hbox{$\scriptstyle\sim$}}{x}}\vphantom{x}}}^{\top}\hat{\Sigma}\mathord{\smash[b]{\underset{\raise.3ex\hbox{$\scriptstyle\sim$}}{x}}\vphantom{x}}} = 0.145056\), while the estimated log-odds itself is \(\hat\eta(\mathord{\smash[b]{\underset{\raise.3ex\hbox{$\scriptstyle\sim$}}{x}}\vphantom{x}}) = \mathord{\smash[b]{\underset{\raise.3ex\hbox{$\scriptstyle\sim$}}{x}}\vphantom{x}}'\hat{\beta}= 0.969132\).
The resulting 95% confidence interval for the log-odds is \((0.684823, 1.253441)\), and applying \(\operatorname{expit}\) to its endpoints (Equation 30) gives a 95% confidence interval for \(\pi(\mathord{\smash[b]{\underset{\raise.3ex\hbox{$\scriptstyle\sim$}}{x}}\vphantom{x}})\) of \((0.664814, 0.777895)\).
These values match the dose = 1.8 row of Table 14, which uses predict() with type = "link" and se.fit = TRUE to compute the estimated log-odds \(\hat\eta(\mathord{\smash[b]{\underset{\raise.3ex\hbox{$\scriptstyle\sim$}}{x}}\vphantom{x}}) = \mathord{\smash[b]{\underset{\raise.3ex\hbox{$\scriptstyle\sim$}}{x}}\vphantom{x}}'\hat{\beta}\) and its estimated standard error for each covariate pattern:
Table 14: Predicted log-odds and 95% CI for beetles logistic regression
dose
logodds_hat
se
ci_lower_logodds
ci_upper_logodds
pi_hat
ci_lower_prob
ci_upper_prob
1.7
-2.458
0.263
-2.974
-1.942
0.079
0.049
0.125
1.8
0.969
0.145
0.685
1.253
0.725
0.665
0.778
1.9
4.396
0.377
3.656
5.136
0.988
0.975
0.994
6.3 Inference for odds ratios
Exercise 21 Given a maximum likelihood estimate\(\hat{\beta}\) and a corresponding estimated covariance matrix\(\hat{\Sigma}\stackrel{\text{def}}{=}\widehat{\operatorname{Cov}}(\hat{\beta})\), calculate a 95% confidence interval for the odds ratio comparing covariate patterns \(\mathord{\smash[b]{\underset{\raise.3ex\hbox{$\scriptstyle\sim$}}{x}}\vphantom{x}}\) and \(\mathord{{\mathord{\smash[b]{\underset{\raise.3ex\hbox{$\scriptstyle\sim$}}{x}}\vphantom{x}}^*}}\), \(\text{ϙ}_{\omega}(\mathord{\smash[b]{\underset{\raise.3ex\hbox{$\scriptstyle\sim$}}{x}}\vphantom{x}},\mathord{{\mathord{\smash[b]{\underset{\raise.3ex\hbox{$\scriptstyle\sim$}}{x}}\vphantom{x}}^*}})\).
Theorem 18 (Confidence interval for an odds ratio) In a logistic regression model, let \(\mathord{\smash[b]{\underset{\raise.3ex\hbox{$\scriptstyle\sim$}}{x}}\vphantom{x}}\) and \(\mathord{{\mathord{\smash[b]{\underset{\raise.3ex\hbox{$\scriptstyle\sim$}}{x}}\vphantom{x}}^*}}\) be two covariate patterns, and let \((L, R)\) be a 95% confidence interval for the logarithm of the odds ratio, \({\operatorname{log}\mathopen{}\left\{\text{ϙ}_{\omega}(\mathord{\smash[b]{\underset{\raise.3ex\hbox{$\scriptstyle\sim$}}{x}}\vphantom{x}},\mathord{{\mathord{\smash[b]{\underset{\raise.3ex\hbox{$\scriptstyle\sim$}}{x}}\vphantom{x}}^*}})\right\}\mathclose{}}\). Then:
is a 95% confidence interval for \(\text{ϙ}_{\omega}(\mathord{\smash[b]{\underset{\raise.3ex\hbox{$\scriptstyle\sim$}}{x}}\vphantom{x}},\mathord{{\mathord{\smash[b]{\underset{\raise.3ex\hbox{$\scriptstyle\sim$}}{x}}\vphantom{x}}^*}})\).
Example 15 (Confidence interval for a beetle odds ratio) For the beetleslogistic regression model (beetles_glm_ungrouped), let \(\mathord{\smash[b]{\underset{\raise.3ex\hbox{$\scriptstyle\sim$}}{x}}\vphantom{x}}= (1, 1.8)^{\top}\) and \(\mathord{{\mathord{\smash[b]{\underset{\raise.3ex\hbox{$\scriptstyle\sim$}}{x}}\vphantom{x}}^*}}= (1, 1.7)^{\top}\). The code below computes a 95% confidence interval for \({\operatorname{log}\mathopen{}\left\{\text{ϙ}_{\omega}(\mathord{\smash[b]{\underset{\raise.3ex\hbox{$\scriptstyle\sim$}}{x}}\vphantom{x}},\mathord{{\mathord{\smash[b]{\underset{\raise.3ex\hbox{$\scriptstyle\sim$}}{x}}\vphantom{x}}^*}})\right\}\mathclose{}}\) and exponentiates its endpoints as in Theorem 18:
The estimated odds ratio is 30.785, with 95% confidence interval (17.396, 54.479). This interval is above 1, which reflects the higher odds of death at the higher dose.
Exercise 22 Find a 95% confidence interval for the natural logarithm of the odds ratio, \({\operatorname{log}\mathopen{}\left\{\text{ϙ}_{\omega}(\mathord{\smash[b]{\underset{\raise.3ex\hbox{$\scriptstyle\sim$}}{x}}\vphantom{x}},\mathord{{\mathord{\smash[b]{\underset{\raise.3ex\hbox{$\scriptstyle\sim$}}{x}}\vphantom{x}}^*}})\right\}\mathclose{}}\)
Theorem 19 (Confidence interval for a log odds ratio) In a logistic regression model, let \(\mathord{\smash[b]{\underset{\raise.3ex\hbox{$\scriptstyle\sim$}}{x}}\vphantom{x}}\) and \(\mathord{{\mathord{\smash[b]{\underset{\raise.3ex\hbox{$\scriptstyle\sim$}}{x}}\vphantom{x}}^*}}\) be two covariate patterns, let \(\hat{\beta}\) be the maximum likelihood estimate of \(\mathord{\smash[b]{\underset{\raise.3ex\hbox{$\scriptstyle\sim$}}{\beta}}\vphantom{\beta}}\), and let \(\widehat{\Delta\eta}\) be the estimated difference in log-odds. For large samples, an approximate 95% confidence interval for the logarithm of the odds ratio, \({\operatorname{log}\mathopen{}\left\{\text{ϙ}_{\omega}(\mathord{\smash[b]{\underset{\raise.3ex\hbox{$\scriptstyle\sim$}}{x}}\vphantom{x}},\mathord{{\mathord{\smash[b]{\underset{\raise.3ex\hbox{$\scriptstyle\sim$}}{x}}\vphantom{x}}^*}})\right\}\mathclose{}} = \Delta\eta\), is:
Example 16 (Confidence interval for a beetle log odds ratio) For the beetleslogistic regression model (beetles_glm_ungrouped), let \(\mathord{\smash[b]{\underset{\raise.3ex\hbox{$\scriptstyle\sim$}}{x}}\vphantom{x}}= (1, 1.8)^{\top}\) and \(\mathord{{\mathord{\smash[b]{\underset{\raise.3ex\hbox{$\scriptstyle\sim$}}{x}}\vphantom{x}}^*}}= (1, 1.7)^{\top}\). The code below applies Theorem 19, and compares the interval with the one obtained by scaling the confidence interval for the dose coefficient by \(0.1\), which is valid here because \(\Delta\mathord{\smash[b]{\underset{\raise.3ex\hbox{$\scriptstyle\sim$}}{x}}\vphantom{x}}= (0, 0.1)^{\top}\):
The estimated log odds ratio is 3.427, with 95% confidence interval (2.856, 3.998). The scaled interval for the dose coefficient is (2.856, 3.998), which agrees.
Theorem 20 (Variance of the estimated difference in log-odds) In a logistic regression model, let \(\hat{\beta}\) be the maximum likelihood estimate of \(\mathord{\smash[b]{\underset{\raise.3ex\hbox{$\scriptstyle\sim$}}{\beta}}\vphantom{\beta}}\), let \(\Sigma \stackrel{\text{def}}{=}\operatorname{Cov}(\hat{\beta})\) be its covariance matrix, and let \(\Delta\mathord{\smash[b]{\underset{\raise.3ex\hbox{$\scriptstyle\sim$}}{x}}\vphantom{x}}\stackrel{\text{def}}{=}\mathord{\smash[b]{\underset{\raise.3ex\hbox{$\scriptstyle\sim$}}{x}}\vphantom{x}}- \mathord{{\mathord{\smash[b]{\underset{\raise.3ex\hbox{$\scriptstyle\sim$}}{x}}\vphantom{x}}^*}}\) be the difference between two covariate patterns. Then the variance of the estimated difference in log-odds \(\widehat{\Delta\eta}= \Delta\mathord{\smash[b]{\underset{\raise.3ex\hbox{$\scriptstyle\sim$}}{x}}\vphantom{x}} \cdot \hat{\beta}\) is:
Example 17 (Variance of an estimated difference in beetle log-odds) For the beetleslogistic regression model (beetles_glm_ungrouped), let \(\mathord{\smash[b]{\underset{\raise.3ex\hbox{$\scriptstyle\sim$}}{x}}\vphantom{x}}= (1, 1.8)^{\top}\) and \(\mathord{{\mathord{\smash[b]{\underset{\raise.3ex\hbox{$\scriptstyle\sim$}}{x}}\vphantom{x}}^*}}= (1, 1.7)^{\top}\), so that \(\Delta\mathord{\smash[b]{\underset{\raise.3ex\hbox{$\scriptstyle\sim$}}{x}}\vphantom{x}}= (0, 0.1)^{\top}\). The code below applies Theorem 20, using the estimated covariance matrix of the coefficients in place of \(\Sigma\):
The quadratic form gives 0.084804. Because \(\Delta\mathord{\smash[b]{\underset{\raise.3ex\hbox{$\scriptstyle\sim$}}{x}}\vphantom{x}}\) has a zero in the intercept position, the variance should equal \(0.1^2\) times the estimated variance of the dose coefficient, which is 0.084804.
Combining Equation 39 with the invariance property of MLEs gives an estimator for the variance and standard error:
Theorem 21 (Estimated variance and standard error of difference in log-odds)\[
{\color{orange}{{\mathop{\widehat{\operatorname{Var}}}\nolimits\mathopen{}\left(\Delta{\hat\eta}\right)\mathclose{}}}} = {\color{orange}{{\Delta\mathord{\smash[b]{\underset{\raise.3ex\hbox{$\scriptstyle\sim$}}{x}}\vphantom{x}}}^{\top}\hat{\Sigma}(\Delta\mathord{\smash[b]{\underset{\raise.3ex\hbox{$\scriptstyle\sim$}}{x}}\vphantom{x}})}}
\tag{40}\]
Proof. By Theorem 20, \({\operatorname{Var}\mathopen{}\left(\widehat{\Delta\eta}\right)\mathclose{}} = {\Delta\mathord{\smash[b]{\underset{\raise.3ex\hbox{$\scriptstyle\sim$}}{x}}\vphantom{x}}}^{\top}\Sigma(\Delta\mathord{\smash[b]{\underset{\raise.3ex\hbox{$\scriptstyle\sim$}}{x}}\vphantom{x}})\) (Equation 39). By the invariance property of MLEs, we estimate \(\Sigma\) with \(\hat{\Sigma}\stackrel{\text{def}}{=}\widehat{\operatorname{Cov}}(\hat{\beta})\), which yields Equation 40; taking the square root gives Equation 41.
Example 18 (Standard error and CI for a beetle odds ratio)
Compare two covariate patterns, a dose of 1.8 versus a dose of 1.7: \(\mathord{\smash[b]{\underset{\raise.3ex\hbox{$\scriptstyle\sim$}}{x}}\vphantom{x}}= (1, 1.8)^{\top}\) and \(\mathord{{\mathord{\smash[b]{\underset{\raise.3ex\hbox{$\scriptstyle\sim$}}{x}}\vphantom{x}}^*}}= (1, 1.7)^{\top}\), so that \(\Delta\mathord{\smash[b]{\underset{\raise.3ex\hbox{$\scriptstyle\sim$}}{x}}\vphantom{x}}= \mathord{\smash[b]{\underset{\raise.3ex\hbox{$\scriptstyle\sim$}}{x}}\vphantom{x}}- \mathord{{\mathord{\smash[b]{\underset{\raise.3ex\hbox{$\scriptstyle\sim$}}{x}}\vphantom{x}}^*}}= (0, 0.1)^{\top}\).
By Equation 41, the estimated standard error of the difference in log-odds is \({\mathop{\widehat{\operatorname{SE}}}\nolimits\mathopen{}\left(\Delta\hat\eta\right)\mathclose{}} = \sqrt{{\Delta\mathord{\smash[b]{\underset{\raise.3ex\hbox{$\scriptstyle\sim$}}{x}}\vphantom{x}}}^{\top}\hat{\Sigma}(\Delta\mathord{\smash[b]{\underset{\raise.3ex\hbox{$\scriptstyle\sim$}}{x}}\vphantom{x}})} = 0.291211\), and the estimated difference in log-odds is \(\Delta\hat\eta= (\Delta\mathord{\smash[b]{\underset{\raise.3ex\hbox{$\scriptstyle\sim$}}{x}}\vphantom{x}})\cdot\hat{\beta}= 3.427033\).
The resulting 95% confidence interval for \(\Delta\eta\) is \((2.856258, 3.997807)\), so by Equation 37 the estimated odds ratio and its 95% confidence interval are \(\hat{\text{ϙ}}_{\omega}(\mathord{\smash[b]{\underset{\raise.3ex\hbox{$\scriptstyle\sim$}}{x}}\vphantom{x}},\mathord{{\mathord{\smash[b]{\underset{\raise.3ex\hbox{$\scriptstyle\sim$}}{x}}\vphantom{x}}^*}}) = e^{3.427033} = 30.785154\), with CI \((17.396309, 54.478551)\).
“The Western Collaborative Group Study (WCGS) was a large epidemiological study designed to investigate the association between the”type A” behavior pattern and coronary heart disease (CHD)“.
Exercise 24 What is “type A” behavior?
Solution 24. From Wikipedia, “Type A and Type B personality theory”:
“The hypothesis describes Type A individuals as outgoing, ambitious, rigidly organized, highly status-conscious, impatient, anxious, proactive, and concerned with time management….
The hypothesis describes Type B individuals as a contrast to those of Type A. Type B personalities, by definition, are noted to live at lower stress levels. They typically work steadily and may enjoy achievement, although they have a greater tendency to disregard physical or mental stress when they do not achieve.”
Study design
from ?faraway::wcgs:
3154 healthy young men aged 39-59 from the San Francisco area were assessed for their personality type. All were free from coronary heart disease at the start of the research. Eight and a half years later change in CHD status was recorded.
Details (from faraway::wcgs)
The WCGS began in 1960 with 3,524 male volunteers who were employed by 11 California companies. Subjects were 39 to 59 years old and free of heart disease as determined by electrocardiogram. After the initial screening, the study population dropped to 3,154 and the number of companies to 10 because of various exclusions. The cohort comprised both blue- and white-collar employees.
Baseline data collection
socio-demographic characteristics:
age
education
marital status
income
occupation
physical and physiological including:
height
weight
blood pressure
electrocardiogram
corneal arcus
biochemical measurements:
cholesterol and lipoprotein fractions;
medical and family history and use of medications;
behavioral data:
Type A interview,
smoking,
exercise
alcohol use.
Later surveys added data on:
anthropometry
triglycerides
Jenkins Activity Survey
caffeine use
The sample mean follow-up time was 8.5 years, with repeat examinations.
Load the data
Here, I load the data:
[R code]
### load the data directly from a UCSF website:library(haven)url <-paste0(# I'm breaking up the url into two chunks for readability"https://regression.ucsf.edu/sites/g/files/","tkssra6706/f/wysiwyg/home/data/wcgs.dta")wcgs <- haven::read_dta(url)
Table 16: Baseline characteristics by CHD status at end of follow-up
Characteristic
Overall
N = 3,1541
No
N = 2,8971
Yes
N = 2571
p-value
Age (years)
45.0 (42.0, 50.0)
45.0 (41.0, 50.0)
49.0 (44.0, 53.0)
<0.0012
Arcus Senilis
941 (30%)
839 (29%)
102 (40%)
<0.0013
Missing
2
0
2
Behavioral Pattern
<0.0013
A1
264 (8.4%)
234 (8.1%)
30 (12%)
A2
1,325 (42%)
1,177 (41%)
148 (58%)
B3
1,216 (39%)
1,155 (40%)
61 (24%)
B4
349 (11%)
331 (11%)
18 (7.0%)
Body Mass Index (kg/m2)
24.39 (22.96, 25.84)
24.39 (22.89, 25.84)
24.82 (23.63, 26.50)
<0.0012
Total Cholesterol
223 (197, 253)
221 (195, 250)
245 (222, 276)
<0.0012
Missing
12
12
0
Diastolic Blood Pressure
80 (76, 86)
80 (76, 86)
84 (80, 90)
<0.0012
Behavioral Pattern
<0.0013
Type B
1,565 (50%)
1,486 (51%)
79 (31%)
Type A
1,589 (50%)
1,411 (49%)
178 (69%)
Height (inches)
70.00 (68.00, 72.00)
70.00 (68.00, 72.00)
70.00 (68.00, 71.00)
0.42
Ln of Systolic Blood Pressure
4.84 (4.79, 4.91)
4.84 (4.77, 4.91)
4.87 (4.82, 4.97)
<0.0012
Ln of Weight
5.14 (5.04, 5.20)
5.13 (5.04, 5.20)
5.16 (5.09, 5.22)
<0.0012
Cigarettes per day
0 (0, 20)
0 (0, 20)
20 (0, 30)
<0.0012
Systolic Blood Pressure
126 (120, 136)
126 (118, 136)
130 (124, 144)
<0.0012
Current smoking
1,502 (48%)
1,343 (46%)
159 (62%)
<0.0013
Observation (follow up) time (days)
2,942 (2,842, 3,037)
2,952 (2,864, 3,048)
1,666 (934, 2,400)
<0.0012
Type of CHD Event
<0.0014
None
0 (0%)
0 (0%)
0 (0%)
infdeath
2,897 (92%)
2,897 (100%)
0 (0%)
silent
135 (4.3%)
0 (0%)
135 (53%)
angina
71 (2.3%)
0 (0%)
71 (28%)
4
51 (1.6%)
0 (0%)
51 (20%)
Weight (lbs)
170 (155, 182)
169 (155, 182)
175 (162, 185)
<0.0012
Weight Category
<0.0013
< 140
232 (7.4%)
217 (7.5%)
15 (5.8%)
140-170
1,538 (49%)
1,440 (50%)
98 (38%)
170-200
1,171 (37%)
1,049 (36%)
122 (47%)
> 200
213 (6.8%)
191 (6.6%)
22 (8.6%)
RECODE of age (Age)
<0.0013
35-40
543 (17%)
512 (18%)
31 (12%)
41-45
1,091 (35%)
1,036 (36%)
55 (21%)
46-50
750 (24%)
680 (23%)
70 (27%)
51-55
528 (17%)
463 (16%)
65 (25%)
56-60
242 (7.7%)
206 (7.1%)
36 (14%)
1 Median (Q1, Q3); n (%)
2 Wilcoxon rank sum test
3 Pearson’s Chi-squared test
4 Fisher’s exact test
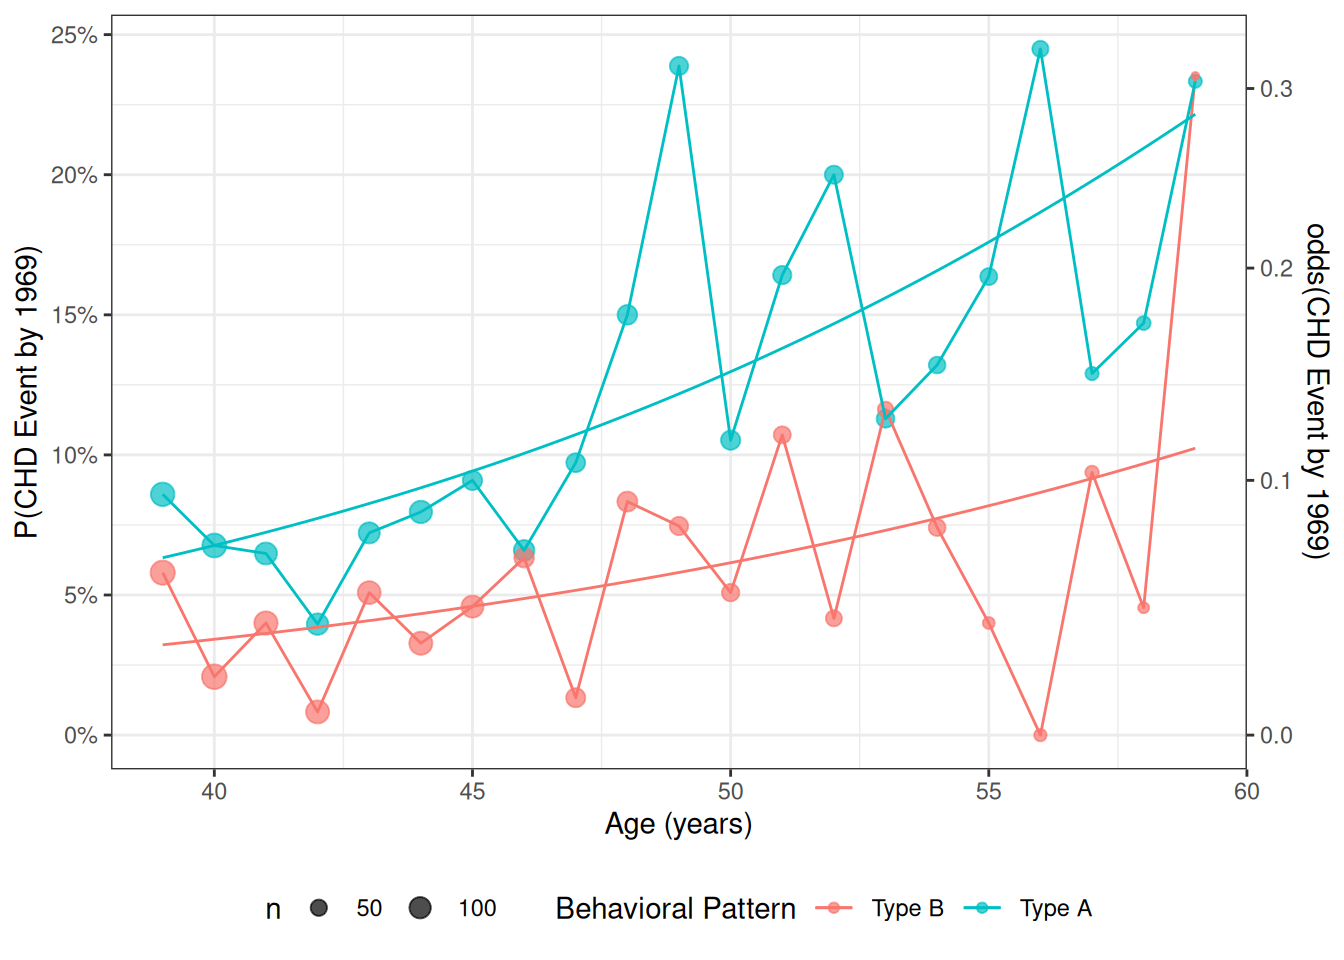
Data by age and personality type
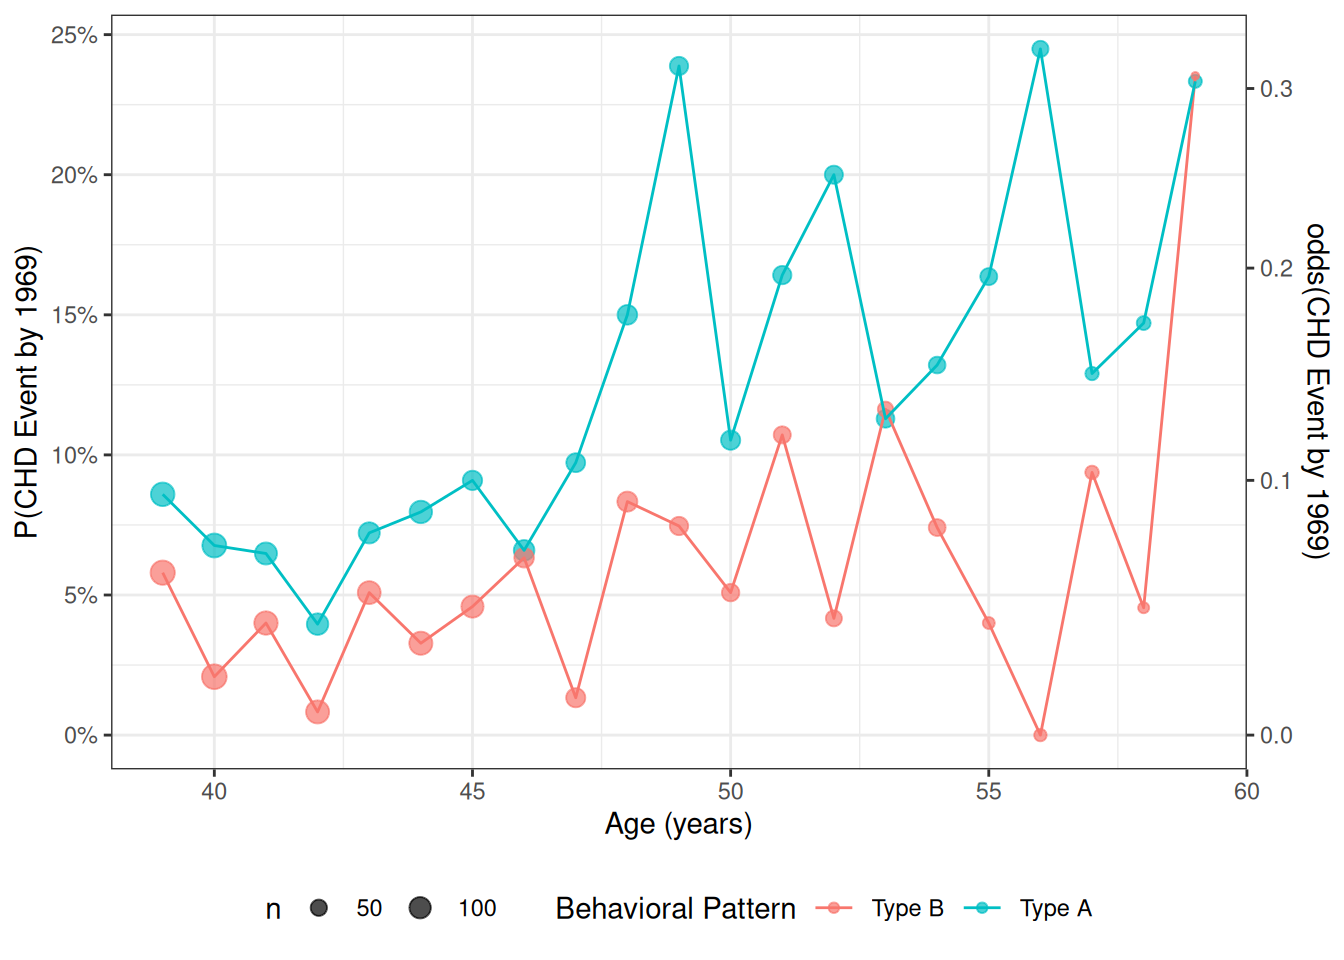
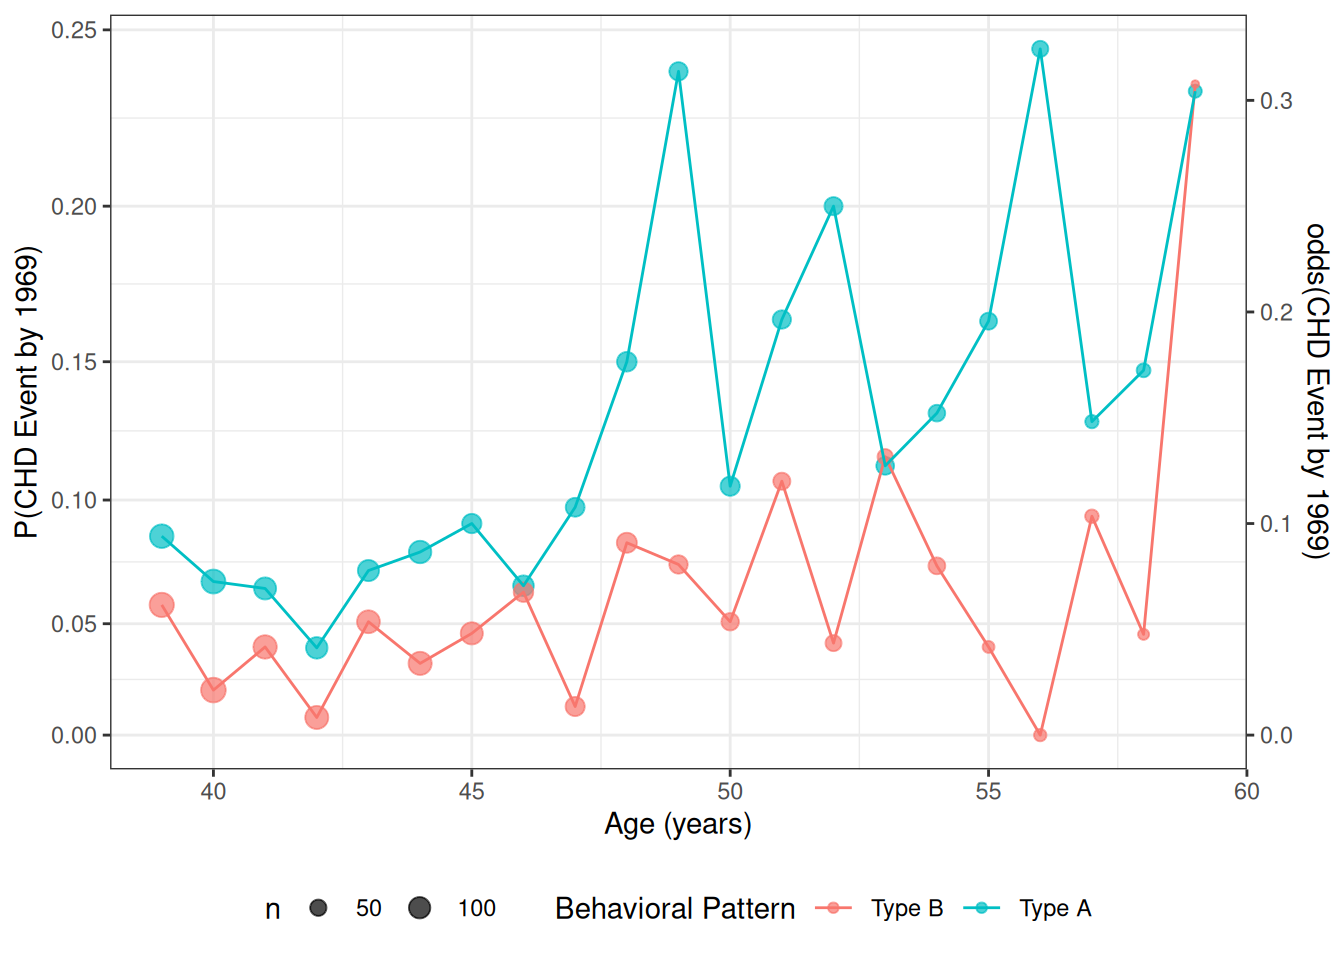
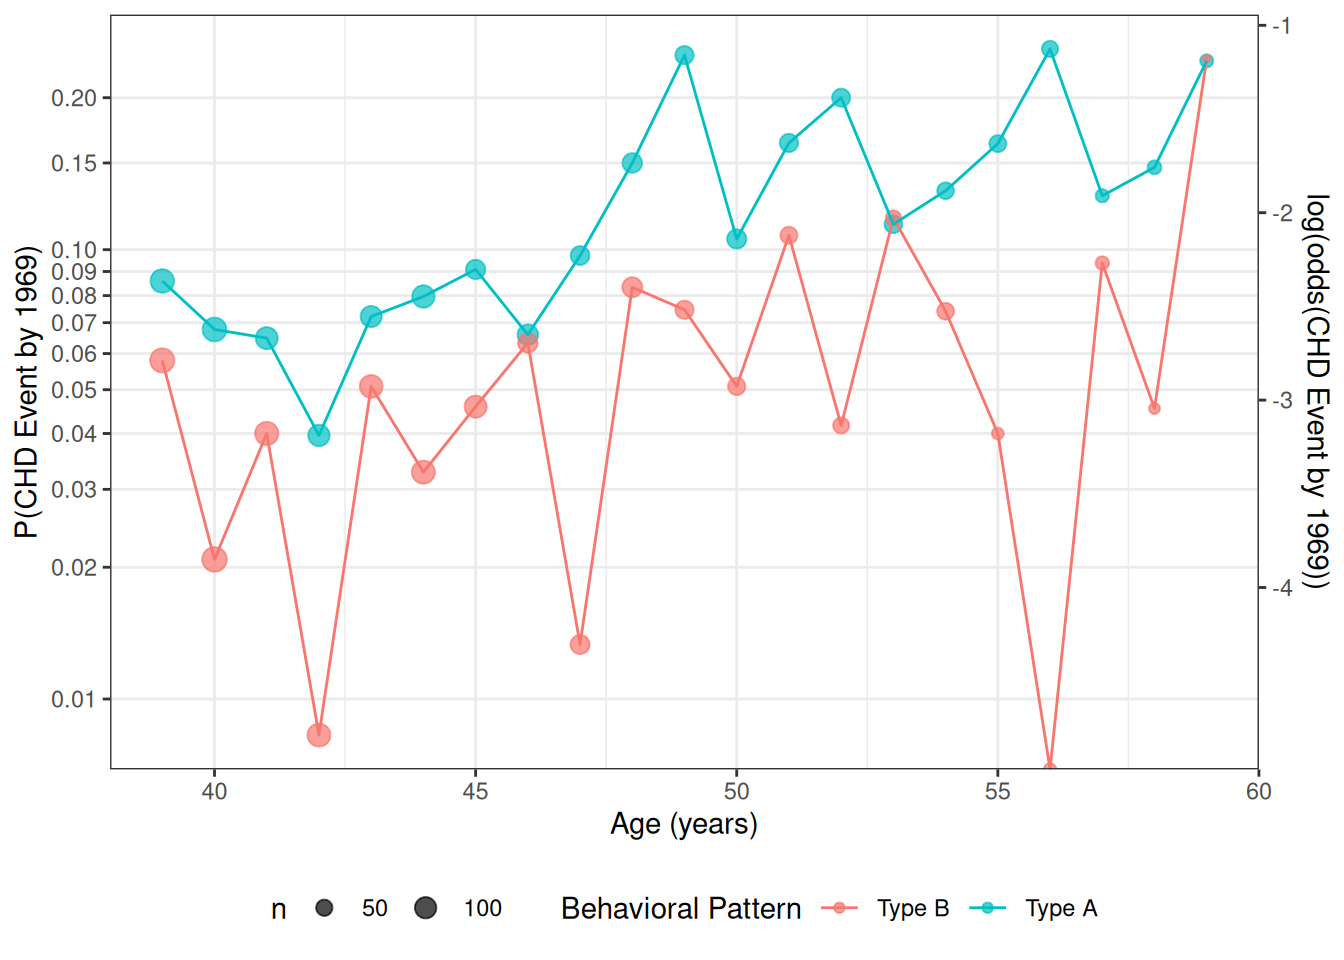
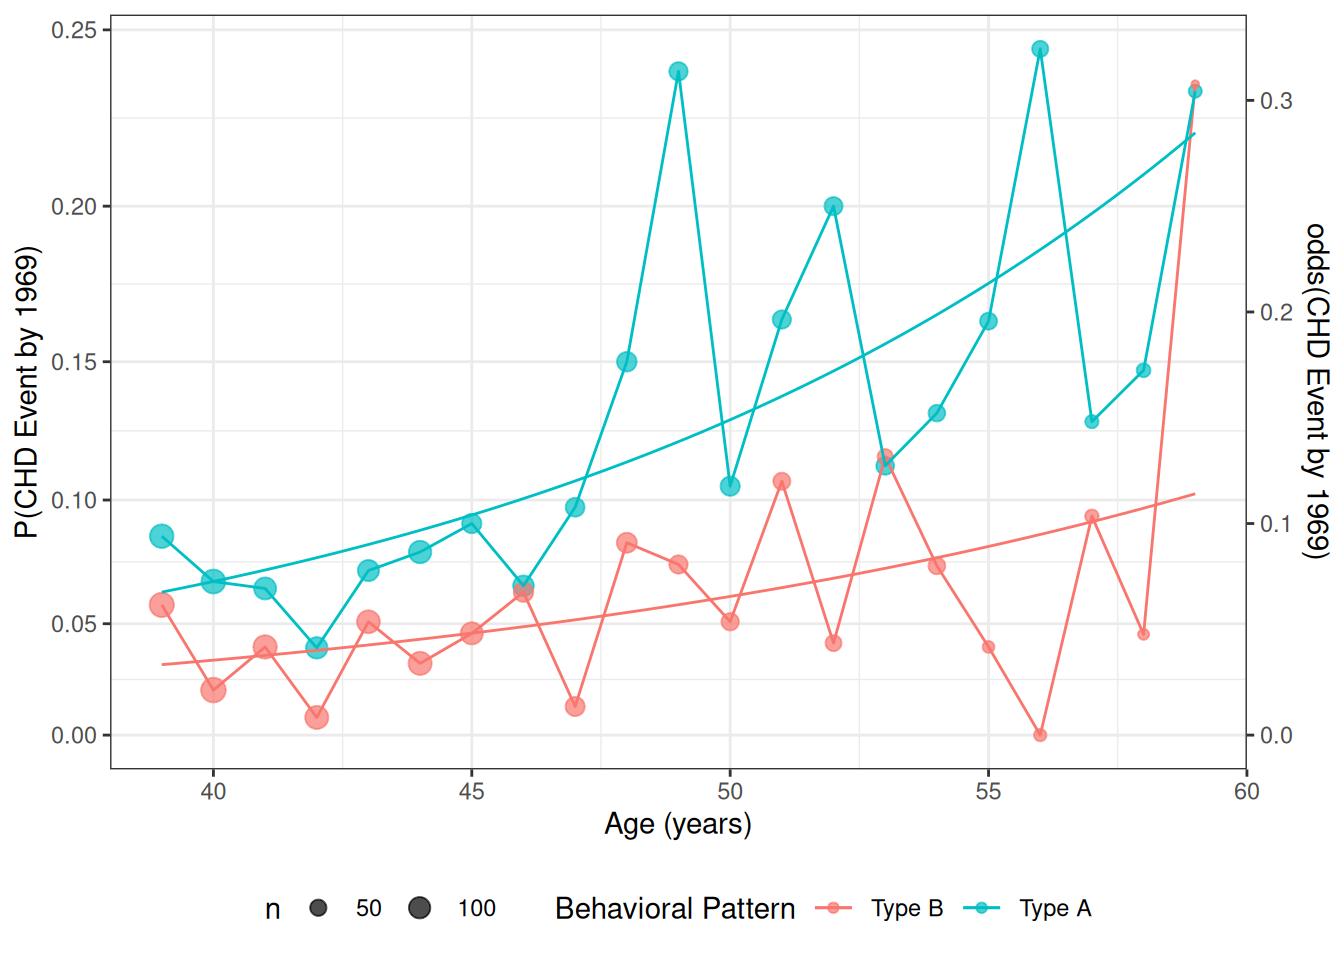
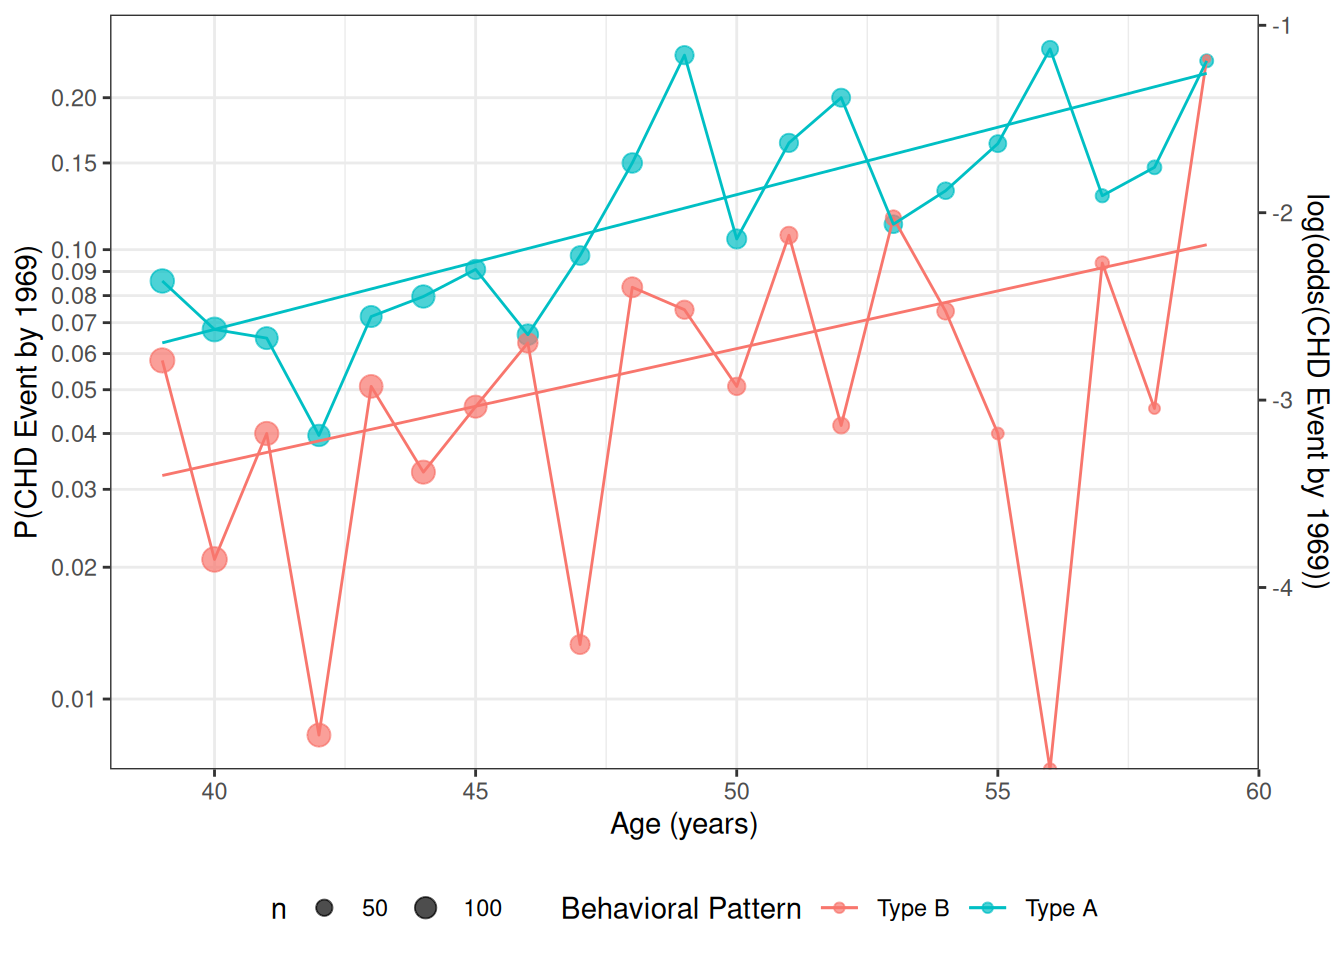
For now, we will look at the interaction between age and personality type (dibpat). To make it easier to visualize the data, we summarize the event rates for each combination of age:
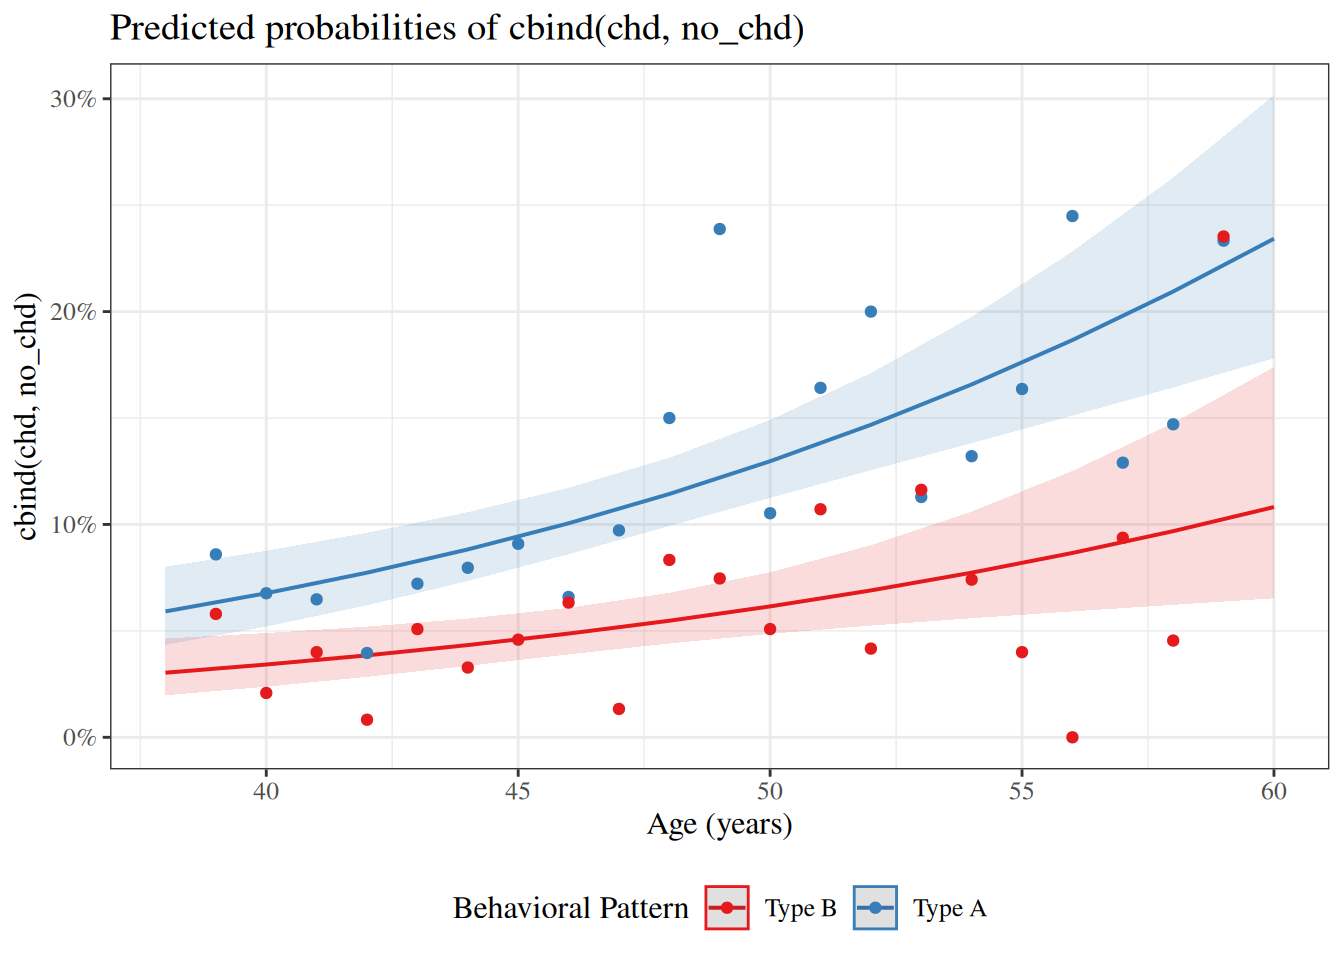
Figure 16: Fitted CHD log-odds by age and behavior pattern (log-odds scale)
Interpreting the model parameters
Exercise 25 For Equation 42, derive interpretations of \(\beta_0\), \(\beta_P\), \(\beta_A\), and \(\beta_{PA}\) on the oddsandlog-odds scales, State the interpretations concisely in math and in words.
(Hint: apply the general procedure for interpreting a regression coefficient to the log-odds linear predictor\(\eta(\mathord{\smash[b]{\underset{\raise.3ex\hbox{$\scriptstyle\sim$}}{x}}\vphantom{x}}) = \operatorname{logit}(\pi(\mathord{\smash[b]{\underset{\raise.3ex\hbox{$\scriptstyle\sim$}}{x}}\vphantom{x}}))\).)
\(\beta_{0}\) is the natural logarithm of the odds (“log-odds”) of experiencing CHD for a 0 year-old person with a type B personality; that is,
\(\text{e}^{\beta_{0}}\) is the odds of experiencing CHD for a 0 year-old with a type B personality. Here we write
\[\omega(p, a) \stackrel{\text{def}}{=}\operatorname{odds}(Y=1|P=p, A=a)\]
for the odds of CHD at covariate values \((p, a)\). Then:
\[
\begin{aligned}
{\operatorname{exp}\mathopen{}\left\{\beta_{0}\right\}\mathclose{}}
&= {\operatorname{exp}\mathopen{}\left\{\eta(P=0,A=0)\right\}\mathclose{}}
&& \text{(} \beta_0 \text{ as a log-odds)}
\\ &= \omega(P=0,A=0)
&& \text{(exponential of log-odds is odds: } \omega= {\operatorname{exp}\mathopen{}\left\{\eta\right\}\mathclose{}} \text{)}
\\ &= \frac{\Pr(Y= 1| P = 0, A = 0)}{1-\Pr(Y= 1| P = 0, A = 0)}
&& \text{(definition of odds)}
\\ &= \frac
{\Pr(Y= 1| P = 0, A = 0)}
{\Pr(Y= 0| P = 0, A = 0)}
&& \text{(complement rule: } 1 - \Pr(Y=1|\cdot) = \Pr(Y=0|\cdot) \text{)}
\end{aligned}
\]
\[
\begin{aligned}
\frac{\partial}{\partial a}\eta(P=0, A = a)
&= \frac{\partial}{\partial a} \mathopen{}\left(\beta_0 + \beta_P \cdot 0 + \beta_A a + \beta_{PA}(0\cdot a)\right)\mathclose{}
&& \text{(model equation, with } p = 0 \text{)}
\\
&= \frac{\partial}{\partial a} \mathopen{}\left(\beta_0 + 0 + \beta_A a + 0\right)\mathclose{}
&& \text{(multiplication by zero)}
\\
&= \frac{\partial}{\partial a} \mathopen{}\left(\beta_0 + \beta_A a\right)\mathclose{}
&& \text{(additive identity)}
\\
&= \frac{\partial}{\partial a}\beta_0 + \frac{\partial}{\partial a}\mathopen{}\left(\beta_A a\right)\mathclose{}
&& \text{(linearity of differentiation)}
\\
&= 0 + \beta_A
&& \text{(constants have derivative 0; derivative of a linear term)}
\\
&= \beta_A
&& \text{(additive identity)}
\end{aligned}
\]
Therefore:
\[\beta_A = \frac{\partial}{\partial a}\eta(P=0, A = a) \tag{44}\]
\(\beta_A\) is the slope of the log-odds of CHD with respect to age, for individuals with personality type B.
Alternatively:
\[
\begin{aligned}
\eta(P = 0, A = a + 1)- \eta(P = 0, A = a)
&= \mathopen{}\left(\beta_0 + \beta_P \cdot 0 + \beta_A (a+1) + \beta_{PA} (0 \cdot (a+1))\right)\mathclose{} - \mathopen{}\left(\beta_0 + \beta_P \cdot 0 + \beta_A a + \beta_{PA} (0 \cdot a)\right)\mathclose{}
&& \text{(model equation, with } p = 0 \text{)}
\\
&= \mathopen{}\left(\beta_0 + 0 + \beta_A (a+1) + 0\right)\mathclose{} - \mathopen{}\left(\beta_0 + 0 + \beta_A a + 0\right)\mathclose{}
&& \text{(multiplication by zero)}
\\
&= \mathopen{}\left(\beta_0 + \beta_A (a+1)\right)\mathclose{} - \mathopen{}\left(\beta_0 + \beta_A a\right)\mathclose{}
&& \text{(additive identity)}
\\
&= \beta_0 + \beta_A a + \beta_A - \beta_0 - \beta_A a
&& \text{(distribute)}
\\
&= \beta_{A}
&& \text{(cancel } \beta_0 \text{ and } \beta_A a \text{)}
\end{aligned}
\]
In terms of finite differences, \(\beta_{A}\) is the difference in log-odds of experiencing CHD per one-year difference in age between two individuals with type B personalities.
\[
\begin{aligned}
{\operatorname{exp}\mathopen{}\left\{\beta_{A}\right\}\mathclose{}} &= {\operatorname{exp}\mathopen{}\left\{\eta(P = 0, A = a + 1)- \eta(P = 0, A = a)\right\}\mathclose{}}
&& \text{(} \beta_A \text{ as a difference in log-odds)}
\\
&= \frac{{\operatorname{exp}\mathopen{}\left\{\eta(P = 0, A = a + 1)\right\}\mathclose{}}}{{\operatorname{exp}\mathopen{}\left\{\eta(P = 0, A = a)\right\}\mathclose{}}}
&& \text{(exponential of a difference is a ratio)}
\\
&= \frac{\omega(P = 0, A = a + 1)}{\omega(P = 0, A = a)}
&& \text{(exponential of log-odds is odds: } \omega= {\operatorname{exp}\mathopen{}\left\{\eta\right\}\mathclose{}} \text{)}
\\
&= \frac
{\operatorname{odds}(Y= 1|P=0, A = a + 1)}
{\operatorname{odds}(Y= 1|P=0, A = a)}
&& \text{(the } \omega(p, a) \text{ notation defined at } \beta_0 \text{'s interpretation)}
\\
&= \text{ϙ}_{\omega}(\Delta a = 1 | P = 0)
&& \text{(definition of the odds ratio)}
\end{aligned}
\]
The odds ratio of experiencing CHD (aka “the odds ratio”) differs by a factor of \(\text{e}^{\beta_{A}}\) per one-year difference in age between individuals with type B personality.
\(\beta_{P}\) is the difference in log-odds of experiencing CHD for a 0 year-old person with type A personality compared to a 0 year-old person with type B personality; specifically,
\[\beta_P = \eta(P = 1, A = 0) - \eta(P=0, A = 0) \tag{45}\]
\(\text{e}^{\beta_{P}}\) is the ratio of the odds (aka “the odds ratio”) of experiencing CHD, for a 0-year old individual with type A personality vs a 0-year old individual with type B personality; specifically,
\[
{\operatorname{exp}\mathopen{}\left\{\beta_{P}\right\}\mathclose{}}
= \frac
{\operatorname{odds}(Y= 1|P=1, A = 0)}
{\operatorname{odds}(Y= 1|P=0, A = 0)}
\]
\[
\begin{aligned}
\frac{\partial}{\partial a}\eta(P={\color{red}{1}}, A = a)
&= \frac{\partial}{\partial a} \mathopen{}\left(\beta_0 + \beta_P \cdot 1 + \beta_A a + \beta_{PA}(1 \cdot a)\right)\mathclose{}
&& \text{(model equation, with } p = 1 \text{)}
\\
&= \frac{\partial}{\partial a} \mathopen{}\left(\beta_0 + \beta_P + \beta_A a + \beta_{PA} a\right)\mathclose{}
&& \text{(multiplicative identity)}
\\
&= \frac{\partial}{\partial a}\beta_0 + \frac{\partial}{\partial a}\beta_P + \frac{\partial}{\partial a}\mathopen{}\left(\beta_A a\right)\mathclose{} + \frac{\partial}{\partial a}\mathopen{}\left(\beta_{PA} a\right)\mathclose{}
&& \text{(linearity of differentiation)}
\\
&= 0 + 0 + \beta_A + \beta_{PA}
&& \text{(constants have derivative 0; derivatives of linear terms)}
\\
&= {\color{red}{\beta_A + \beta_{PA}}}
&& \text{(additive identity)}
\\
\frac{\partial}{\partial a}\eta(P={\color{teal}{0}}, A = a) &= {\color{teal}{\beta_A}}
&& \text{(the type B slope, from the } \beta_A \text{ derivation)}
\end{aligned}
\]
Therefore:
\[
\begin{aligned}
\frac{\partial}{\partial a}\eta(P={\color{red}{1}}, A = a) - \frac{\partial}{\partial a}\eta(P={\color{teal}{0}}, A = a)
&= \mathopen{}\left({\color{red}{\beta_A + \beta_{PA}}}\right)\mathclose{} - {\color{teal}{\beta_A}}
&& \text{(substitute the two slopes)}
\\
&= \beta_A - \beta_A + \beta_{PA}
&& \text{(commute the addition)}
\\
&= \beta_{PA}
&& \text{(cancel } \beta_A \text{)}
\end{aligned}
\]
That slope difference implies that
\[
\begin{aligned}
\beta_{PA} &= \frac{\partial}{\partial a}\eta(P={\color{red}{1}}, A = a) - \frac{\partial}{\partial a}\eta(P={\color{teal}{0}}, A = a)
&& \text{(rearrange the difference of slopes)}
\\
&= \frac{\partial}{\partial a}\eta(P={\color{red}{1}}, A = a) - {\color{teal}{\beta_A}}
&& \text{(substitute the type B slope, } \frac{\partial}{\partial a}\eta(P=0, A=a) = \beta_A \text{)}
\end{aligned}
\]
\(\beta_{PA}\) is the difference in the slopes of log-odds over age between participants with Type A personalities and participants with Type B personalities.
Accordingly, the odds ratio of experiencing CHD per one-year difference in age differs by a factor of \(\text{e}^{\beta_{PA}}\) for participants with type A personality compared to participants with type B personality; specifically,
\[
\begin{aligned}
\text{ϙ}_{\omega}(\Delta a = 1 | P = 1)
= {\operatorname{exp}\mathopen{}\left\{\beta_{PA}\right\}\mathclose{}} \times \text{ϙ}_{\omega}(\Delta a = 1 | P = 0)
\end{aligned}
\]
or equivalently:
\[
{\operatorname{exp}\mathopen{}\left\{\beta_{PA}\right\}\mathclose{}} =
\frac
{\text{ϙ}_{\omega}(\Delta a = 1 | P = 1)}
{\text{ϙ}_{\omega}(\Delta a = 1 | P = 0)}
\]
Theorem 22 (Interpretation of the intercept in the WCGS interaction model) In the model of Equation 42, write \(\omega(p, a) \stackrel{\text{def}}{=}\operatorname{odds}(Y=1|P=p, A=a)\) for the odds of CHD at covariate values \((p, a)\). Then the intercept \(\beta_0\) is the log-odds of CHD for a person with type B personality (\(P = 0\)) and age \(0\):
\[\beta_{0} = \eta(P=0,A=0)\]
and \({\operatorname{exp}\mathopen{}\left\{\beta_0\right\}\mathclose{}}\) is the corresponding odds:
Example 19 (The fitted WCGS intercept as a log-odds) The code below compares the intercept of the fitted model (chd_glm_contrasts) with the predicted log-odds for a type B participant at age 0, and compares \({\operatorname{exp}\mathopen{}\left\{\hat\beta_0\right\}\mathclose{}}\) with the corresponding predicted odds:
The intercept is -5.8033 and the predicted log-odds is -5.8033. Also, \({\operatorname{exp}\mathopen{}\left\{\hat\beta_0\right\}\mathclose{}}\) is 0.00302 and the predicted odds is 0.00302. These values are tiny because age 0 lies far outside the observed ages, so the intercept is an extrapolation.
Theorem 23 (Interpretation of the age coefficient in the WCGS interaction model) In the model of Equation 42, write \(\omega(p, a) \stackrel{\text{def}}{=}\operatorname{odds}(Y=1|P=p, A=a)\) and \(\text{ϙ}_{\omega}(\Delta a = 1 | P = p) \stackrel{\text{def}}{=}\omega(p, a + 1) / \omega(p, a)\). Then for every age \(a\), the age coefficient \(\beta_A\) is the slope of the log-odds of CHD with respect to age among participants with type B personality (\(P = 0\)):
\[
\beta_A
= \frac{\partial}{\partial a}\eta(P=0, A = a)
= \eta(P = 0, A = a + 1)- \eta(P = 0, A = a)
\]
and \({\operatorname{exp}\mathopen{}\left\{\beta_A\right\}\mathclose{}}\) is the odds ratio per one-year difference in age among participants with type B personality:
\[{\operatorname{exp}\mathopen{}\left\{\beta_{A}\right\}\mathclose{}} = \text{ϙ}_{\omega}(\Delta a = 1 | P = 0)\]
Example 20 (The fitted WCGS age coefficient for type B participants) The code below compares the age coefficient of the fitted model (chd_glm_contrasts) with the change in predicted log-odds between ages 50 and 51 for type B participants, and compares \({\operatorname{exp}\mathopen{}\left\{\hat\beta_A\right\}\mathclose{}}\) with the corresponding ratio of predicted odds:
The age coefficient is 0.0616 and the difference in predicted log-odds is 0.0616. Also, \({\operatorname{exp}\mathopen{}\left\{\hat\beta_A\right\}\mathclose{}}\) is 1.0635 and the ratio of predicted odds is 1.0635.
Theorem 24 (Interpretation of the personality coefficient in the WCGS interaction model) In the model of Equation 42, write \(\omega(p, a) \stackrel{\text{def}}{=}\operatorname{odds}(Y=1|P=p, A=a)\). Then the personality coefficient \(\beta_P\) is the difference in log-odds of CHD between type A (\(P = 1\)) and type B (\(P = 0\)) participants at age \(0\):
\[\beta_P = \eta(P = 1, A = 0) - \eta(P=0, A = 0)\]
and \({\operatorname{exp}\mathopen{}\left\{\beta_P\right\}\mathclose{}}\) is the corresponding odds ratio:
\[
{\operatorname{exp}\mathopen{}\left\{\beta_{P}\right\}\mathclose{}}
= \frac{\omega(P=1, A = 0)}{\omega(P=0, A = 0)}
\]
Example 21 (The fitted WCGS personality coefficient) The code below compares the personality coefficient of the fitted model (chd_glm_contrasts) with the difference in predicted log-odds between type A and type B participants at age 0, and compares \({\operatorname{exp}\mathopen{}\left\{\hat\beta_P\right\}\mathclose{}}\) with the corresponding ratio of predicted odds:
The personality coefficient is 0.3044 and the difference in predicted log-odds is 0.3044. Also, \({\operatorname{exp}\mathopen{}\left\{\hat\beta_P\right\}\mathclose{}}\) is 1.3558 and the ratio of predicted odds is 1.3558.
Theorem 25 (Interpretation of the interaction coefficient in the WCGS interaction model) In the model of Equation 42, write \(\omega(p, a) \stackrel{\text{def}}{=}\operatorname{odds}(Y=1|P=p, A=a)\) and \(\text{ϙ}_{\omega}(\Delta a = 1 | P = p) \stackrel{\text{def}}{=}\omega(p, a + 1) / \omega(p, a)\). Then for every age \(a\), the interaction coefficient \(\beta_{PA}\) is the difference between the slopes of the log-odds of CHD over age for type A (\(P = 1\)) and type B (\(P = 0\)) participants:
\[\beta_{PA} = \frac{\partial}{\partial a}\eta(P=1, A = a) - \frac{\partial}{\partial a}\eta(P=0, A = a)\]
and \({\operatorname{exp}\mathopen{}\left\{\beta_{PA}\right\}\mathclose{}}\) is the ratio of the odds ratios per one-year difference in age:
\[
{\operatorname{exp}\mathopen{}\left\{\beta_{PA}\right\}\mathclose{}} =
\frac
{\text{ϙ}_{\omega}(\Delta a = 1 | P = 1)}
{\text{ϙ}_{\omega}(\Delta a = 1 | P = 0)}
\]
Example 22 (The fitted WCGS interaction coefficient) The code below compares the interaction coefficient of the fitted model (chd_glm_contrasts) with the difference between the type A and type B changes in predicted log-odds from age 50 to age 51, and compares \({\operatorname{exp}\mathopen{}\left\{\hat\beta_{PA}\right\}\mathclose{}}\) with the ratio of the two odds ratios:
The interaction coefficient is 0.0103 and the difference in the changes in predicted log-odds is 0.0103. Also, \({\operatorname{exp}\mathopen{}\left\{\hat\beta_{PA}\right\}\mathclose{}}\) is 1.0104 and the ratio of the odds ratio for type A (1.0746) to the odds ratio for type B (1.0635) is 1.0104.
See Section 5.1.1 of Vittinghoff et al. [2] for another perspective, also using the wcgs data as an example.
Exercise 26 If I give you model 1, how would you get the coefficients of model 2?
Solution 26. Model 1 is the corner-point (reference/contrast) parametrization fitted in chd_glm_contrasts, with linear predictor (Equation 42):
\[\eta(p, a) = \beta_0 + \beta_P p + \beta_A a + \beta_{PA} pa\]
Model 2 is the stratified parametrization fitted in chd_glm_strat, which gives each personality type its own intercept and its own age slope. Writing \(\gamma_B, \gamma_A\) for the stratum-specific intercepts and \(\delta_B, \delta_A\) for the stratum-specific age slopes:
\[
\eta(p, a) \stackrel{\text{def}}{=}
\gamma_B (1 - p) + \gamma_A p + \delta_B (1 - p) a + \delta_A p a
\tag{46}\]
The two parametrizations span the same set of linear-predictor functions, so both models have the same fitted linear predictor \(\eta(p, a)\). We can therefore recover the model 2 coefficients by equating the two expressions for \(\eta(p, a)\) within each personality-type stratum.
\[
\begin{aligned}
\eta(1, a)
&= \gamma_B (1 - 1) + \gamma_A \cdot 1 + \delta_B (1 - 1) a + \delta_A \cdot 1 \cdot a
&& \text{(substitute } p = 1\text{)}
\\
&= \gamma_B \cdot 0 + \gamma_A \cdot 1 + \delta_B \cdot 0 \cdot a + \delta_A \cdot 1 \cdot a
&& \text{(} 1 - 1 = 0 \text{)}
\\
&= 0 + \gamma_A + 0 + \delta_A a
&& \text{(multiply by 0 and by 1)}
\\
&= \gamma_A + \delta_A a
&& \text{(drop the zero terms)}
\end{aligned}
\]
Equating the two expressions for \(\eta(1, a)\) and applying the same two steps as in the Type B stratum (set \(a = 0\); then subtract the intercepts and set \(a = 1\)):
Solving Equation 48 for the model 1 coefficients inverts the conversion, so either parametrization determines the other:
\[
\begin{aligned}
\beta_0 &= \gamma_B
&& \text{(first equation of the summary)}
\\
\beta_P &= \gamma_A - \gamma_B
&& \text{(subtract the first equation from the second)}
\\
\beta_A &= \delta_B
&& \text{(third equation)}
\\
\beta_{PA} &= \delta_A - \delta_B
&& \text{(subtract the third equation from the fourth)}
\end{aligned}
\]
Numerical check: applying Equation 48 to the fitted model 1 coefficients (Table 17) reproduces the fitted model 2 coefficients (Table 19):
[R code]
b <-coef(chd_glm_contrasts)gamma_delta <-c("dibpatType B"=unname(b["(Intercept)"]),"dibpatType A"=unname(b["(Intercept)"] + b["dibpatType A"]),"dibpatType B:age"=unname(b["age"]),"dibpatType A:age"=unname(b["age"] + b["dibpatType A:age"]))cbind("converted from model 1"= gamma_delta,"model 2 (fitted directly)"=coef(chd_glm_strat)[names(gamma_delta)])#> converted from model 1 model 2 (fitted directly)#> dibpatType B -5.8032532 -5.8032532#> dibpatType A -5.4988618 -5.4988618#> dibpatType B:age 0.0615634 0.0615634#> dibpatType A:age 0.0719071 0.0719071
Theorem 26 (Converting between the corner-point and stratified parametrizations) Let \(\beta_0\), \(\beta_P\), \(\beta_A\) and \(\beta_{PA}\) be the coefficients of the corner-point parametrization (Equation 42). Let \(\gamma_B\) and \(\gamma_A\) be the stratum-specific intercepts, and \(\delta_B\) and \(\delta_A\) the stratum-specific age slopes, of the stratified parametrization of the same linear predictor (Equation 46). Then:
Example 23 (Converting the fitted WCGS coefficients) The code below applies Theorem 26 to the coefficients of the fitted corner-point model (chd_glm_contrasts), and compares the result with the coefficients of the model fitted directly with the stratified parametrization (chd_glm_strat):
Definition 4 (Deviance goodness-of-fit test (deviance test)) We can compare the maximized log-likelihood of our model, \(\ell(\hat\beta; \mathbf x)\), versus the log-likelihood of the full model (aka saturated model aka maximal model; see the saturated model definition), \(\ell_{\text{full}}\), which has one parameter per covariate pattern. The deviance statistic (see the deviance definition) is:
With enough data, \(D \dot \sim \chi^2(q - p)\), where \(q\) is the number of distinct covariate patterns and \(p\) is the number of \(\beta\) parameters in our model. The deviance goodness-of-fit test (or deviance test) compares \(D\) to that \(\chi^2(q-p)\) distribution.
Remark 3 (Interpreting the deviance test). A significant p-value for this deviance statistic indicates that there’s some detectable pattern in the data that our model isn’t flexible enough to catch.
Caution
The deviance statistic needs to have a large amount of data for each covariate pattern for the \(\chi^2\) approximation to hold. A guideline from Dobson and Barnett [1, Ch. 5] is that if there are \(q\) distinct covariate patterns \(x_1...,x_q\), with \(n_1,...,n_q\) observations per pattern, then the expected frequencies \(n_k \cdot \pi(x_k)\) should be at least 1 for every pattern \(k\in 1:q\).
If you have covariates measured on a continuous scale, you may not be able to use the deviance tests to assess goodness of fit.
Example 24 (Deviance test for the WCGS CHD model) Our CHD model chd_glm_contrasts was fit to individual-level observations, but its covariate patterns are just the combinations of personality type (dibpat) and whole-year age, so we can refit the same model to the grouped data and perform the deviance test:
The smallest expected event frequency across the covariate patterns is \(\min_k {\mathopen{}\left\{ n_k \cdot \hat\pi(x_k) \right\}\mathclose{}} = 1.74\), which is at least 1, so these grouped data meet the minimum-expected-frequency guideline from Dobson and Barnett [1, Ch. 5] for using the \(\chi^2\) approximation.
The grouped data have \(q = 42\) distinct covariate patterns, and the model has \(p = 4\) parameters, so the deviance statistic \(D = 45\) has \(q - p = 38\) degrees of freedom. The corresponding p-value is \(p(\chi^2(38) > 45) = 0.202\), so the deviance test finds no significant evidence of lack of fit for this model.
Hosmer-Lemeshow test
If our covariate patterns produce groups that are too small, a reasonable solution is to make bigger groups by merging some of the covariate-pattern groups together.
Definition 5 (Hosmer-Lemeshow test)Hosmer and Lemeshow [11] proposed that we group the patterns by their predicted probabilities according to the model of interest. For example, you could group all of the observations with predicted probabilities of 10% or less together, then group the observations with 11%-20% probability together, and so on; \(g=10\) categories in all.
Then we can construct a statistic \[X^2 \stackrel{\text{def}}{=}\sum_{c=1}^g \frac{(o_c - e_c)^2}{e_c}\] where \(o_c\) is the number of events observed in group \(c\), and \(e_c\) is the number of events expected in group \(c\) (based on the sum of the fitted values\(\hat\pi_i\) for observations in group \(c\)).
If each group has enough observations in it, you can compare \(X^2\) to a \(\chi^2\) distribution; by simulation, the degrees of freedom has been found to be approximately \(g-2\).
Note
The Hosmer-Lemeshow statistic depends on how the observations are grouped. Changing the number of groups \(g\), or the cut points used to form them, can change the value of \(X^2\) and its p-value for the same fitted model, so the test can reach different conclusions depending on the grouping choice. Hosmer et al. [12] compare the Hosmer-Lemeshow test against several alternative goodness-of-fit tests and document this sensitivity.
Example 25 (Hosmer-Lemeshow test for the WCGS CHD model) For our CHD model, this procedure would be:
Our statistic is \(X^2 = 1.110287\); \(p(\chi^2(1) > 1.110287) = 0.29202\), which is our p-value for detecting a lack of goodness of fit.
Unfortunately that grouping plan left us with just three categories with any observations, so instead of grouping by 10% increments of predicted probability, typically analysts use deciles of the predicted probabilities:
Now we have more evenly split categories. The p-value is \(0.56042\), still not significant.
Graphically, we have compared:
[R code]
HL_plot <-# nolint: object_name_linter HL_table |>ggplot(aes(x = pred_prob_cats1)) +geom_line(aes(y = e, x = pred_prob_cats1, group ="Expected", col ="Expected") ) +geom_point(aes(y = e, size = n, col ="Expected")) +geom_point(aes(y = o, size = n, col ="Observed")) +geom_line(aes(y = o, col ="Observed", group ="Observed")) +scale_size(range =c(1, 4)) +theme_bw() +ylab("number of CHD events") +theme(axis.text.x =element_text(angle =45))
[R code]
ggplotly(HL_plot)
Comparing models
The deviance test (Definition 4) and the Hosmer-Lemeshow test (Definition 5) assess the fit of a single model in absolute terms. To choose between two competing models, we can instead compare their fits against each other, using criteria that trade off fit against complexity:
BIC = \(-2 * \ell(\hat\theta) + p * \text{log}(n)\) [lower is better] [14] (see the BIC definition)
A larger maximized log-likelihood is not, by itself, evidence that one model is better than another: adding parameters to a model can never decrease its maximized log-likelihood, so the more complex of two nested models always fits at least as well. For nested models, the likelihood ratio test accounts for this complexity difference by testing whether the improvement in fit is larger than chance alone would produce:
Definition 6 (Likelihood ratio test statistic) Suppose a reduced model with \(p_0\) parameters is nested in a full model with \(p_1 > p_0\) parameters; that is, the reduced model is a special case of the full model. The likelihood ratio test statistic is:
where \(\hat\theta_1\) and \(\hat\theta_0\) are the maximum likelihood estimates of the full and reduced models, respectively.
Definition 7 (Likelihood ratio test (LRT)) Under the null hypothesis that the reduced model is adequate, the likelihood ratio test statistic \(\Lambda\) (Definition 6) satisfies \(\Lambda \dot \sim \chi^2(p_1 - p_0)\) by Wilks’ theorem. The likelihood ratio test (LRT) rejects the reduced model when \(\Lambda\) is large relative to that \(\chi^2(p_1 - p_0)\) distribution.
Example 26 (Testing the WCGS interaction term with a likelihood ratio test) Our CHD model chd_glm_contrasts includes a dibpat:ageinteraction term. Does that interaction term improve the fit enough to justify its extra parameter? Let’s fit the nested model without the interaction term and compare the two models with a likelihood ratio test:
\[
\begin{aligned}
\Lambda
&\stackrel{\text{def}}{=}2(\ell_{\text{full}}(\hat\theta_1) - \ell_{\text{red}}(\hat\theta_0))
&& \text{(definition of the LRT statistic)}
\\ &= 2 \times (-851.99 - (-852.08))
&& \text{(substituting the two maximized log-likelihoods)}
\\ &= 2 \times 0.09
&& \text{(subtraction)}
\\ &= 0.18
&& \text{(multiplication)}
\end{aligned}
\]
The full model has \(p_1 = 4\) parameters and the reduced model has \(p_0 = 3\), so the null distribution is \(\chi^2(p_1 - p_0) = \chi^2(1)\), and the p-value is \(p(\chi^2(1) > 0.18) = 0.674\). The LRT finds no significant evidence that the interaction term improves the fit.
The lrtest() function from the {lmtest} package performs the same test:
Both criteria are lower for the additive model (AIC: \(1710.16\) vs \(1711.98\); BIC: \(1728.33\) vs \(1736.21\)), agreeing with the LRT that the interaction term is not worth its extra parameter.
Logistic regression residuals only work for grouped data
The residual and leverage diagnostics in this section follow the logistic-regression diagnostics developed by Pregibon [15]; see also Dobson and Barnett [1, Ch. 7] and Vittinghoff et al. [2, Ch. 5] for textbook treatments.
[R code]
library(haven)url <-paste0(# I'm breaking up the url into two chunks for readability"https://regression.ucsf.edu/sites/g/files/","tkssra6706/f/wysiwyg/home/data/wcgs.dta")library(here) # provides the `here()` functionlibrary(fs) # provides the `path()` functionhere::here() |> fs::path("Data/wcgs.rda") |>load()chd_glm_contrasts <- wcgs |>glm("data"= _,"formula"= chd69 =="Yes"~ dibpat * age,"family"=binomial(link ="logit") )library(ggfortify)chd_glm_contrasts |>autoplot()
Figure 17: Residual diagnostics for WCGS model with individual-level observations
where \(k\) indexes the covariate patterns, \(\bar y_k\) is the observed proportion of events in pattern \(k\), and \(\hat\pi(x_k)\) is the fitted probability for pattern \(k\).
Example 27 (Response residuals for the WCGS CHD model) We can graph these residuals \(e_k\) (Definition 8) against the fitted values\(\hat\pi(x_k)\):
Don’t worry about these options for now; I chose them to match autoplot() as closely as I can. plot.glm and autoplot use stats::lowess instead of stats::loess; stats::lowess is older, hard to use with geom_smooth, and hard to match exactly with stats::loess; see https://support.bioconductor.org/p/2323/.]
[R code]
wcgs_response_resid_plot |>print()
Figure 19: residuals plot for wcgs model
We can see a slight fan-shape here: observations on the right have larger variance (as expected since \(var(\bar y) = \pi(1-\pi)/n\) is maximized when \(\pi = 0.5\)).
Pearson residuals
The fan-shape in the response residuals plot isn’t necessarily a concern here, since we haven’t made an assumption of constant residual variance, as we did for linear regression.
However, we might want to divide by the standard error in order to make the graph easier to interpret. Here’s one way to do that:
Definition 9 (Pearson residual) The Pearson (chi-squared) residual for covariate pattern \(k\) is: \[
\begin{aligned}
X_k &\stackrel{\text{def}}{=}\frac{\bar y_k - \hat\pi_k}{\sqrt{\hat \pi_k (1-\hat\pi_k)/n_k}}
\end{aligned}
\]
Example 28 (Pearson residuals for the WCGS CHD model) Let’s take a look at the Pearson residuals (Definition 9) for our CHD model from the WCGS data (graphed against the fitted values on the logit scale):
[R code]
library(ggfortify)
[R code]
autoplot(chd_glm_contrasts_grouped, which =1, ncol =1) |>print()
The fan-shape is gone, and these residuals don’t show any obvious signs of model fit issues.
Example 29 (Counterexample: Pearson residuals for the beetles model) If we create the same plot for the beetles model, we see some strong evidence of a lack of fit; this plot is a counterexample to a well-fitting model:
[R code]
library(glmx)library(dplyr)data(BeetleMortality)beetles <- BeetleMortality |>mutate(pct = died / n,survived = n - died,dose_c = dose -mean(dose) )beetles_glm_grouped <- beetles |>glm(formula =cbind(died, survived) ~ dose,family ="binomial" )autoplot(beetles_glm_grouped, which =1, ncol =1) |>print()
The clear pattern in the residuals signals that the straight-line logit model does not fit the beetle-mortality data well.
Pearson residuals with individual (ungrouped) data
What happens if we try to compute residuals without grouping the data by covariate pattern?
This residuals-vs-fitted plot is meaningless: with ungrouped (individual-level) data, each covariate pattern contains only one observation (\(n_k = 1\)), so each residual can take only one of two possible values, both determined by the fitted probability \(\hat\pi(x_k)\) (one value when \(y_k = 1\) and another when \(y_k = 0\)). With a single binary observation per covariate pattern, the residuals have no meaningful reference distribution to assess the model fit against; this lack of a reference distribution is why logistic regression residuals only work for grouped data, with multiple observations per covariate pattern.
Residuals plot by hand
If you want to check your understanding of what these residual plots are, try building them yourself:
[R code]
wcgs_grouped <- wcgs_grouped |>mutate(fitted = chd_glm_contrasts_grouped |>fitted(),fitted_logit = fitted |>logit(),resids = chd_glm_contrasts_grouped |>resid(type ="pearson") )wcgs_resid_plot1 <- wcgs_grouped |>ggplot(mapping =aes(x = fitted_logit,y = resids ) ) +geom_point(aes(col = dibpat) ) +geom_hline(yintercept =0) +geom_smooth(se =FALSE,method.args =list(span =2/3,degree =1,family ="symmetric",iterations =3,surface ="direct" ),method = stats::loess )# plot.glm and autoplot use stats::lowess, which is hard to use with# geom_smooth and hard to match exactly;# see https://support.bioconductor.org/p/2323/
[R code]
wcgs_resid_plot1 |>print()
Pearson chi-squared goodness of fit test
The Pearson chi-squared goodness of fit statistic is: \[X^2 = \sum_{k=1}^q X_k^2\]
Under the null hypothesis that the model in question is correct (i.e., sufficiently complex), \(X^2\ \dot \sim\ \chi^2(q-p)\).
For our CHD model, the p-value for this test is 0.265236; no significant evidence of a lack of fit at the 0.05 level.
Definition 10 (Weighted hat matrix for a GLM) For a logistic (or other) generalized linear model fit to \(q\) covariate patterns with \(p\) parameters, the weighted hat matrix is
where \(\underbrace{\mathbf{W}}_{q \times q} \stackrel{\text{def}}{=}\text{diag}\mathopen{}\left(n_k \, \hat\pi_k \, (1 - \hat\pi_k)\right)\mathclose{}\) is the diagonal matrix of binomial weights.
Definition 11 (Leverage for a GLM) Let \(\mathbf{H}\) be the weighted hat matrix (Definition 10). The leverage\(h_k\) of covariate pattern \(k\) is the \(k\)-th diagonal element of \(\mathbf{H}\).
Remark 4 (The weighted hat matrix as the GLM analog of the linear-model hat matrix). This weighted hat matrix is the GLM analog of the linear-model hat matrix; the weight matrix \(\mathbf{W}\) reduces to the identity in the ordinary-least-squares case.
Definition 12 (Standardized Pearson residual) Especially for small data sets, we might want to adjust our residuals for leverage (since outliers in \(X\) add extra variance to the residuals):
where \(X_k\) is the Pearson residual (Definition 9) and \(h_k\) is the leverage of covariate pattern \(k\) (Definition 11).
Remark 5 (Standardized Pearson residuals in R diagnostic plots). The functions autoplot() and plot.lm() use these for some of their graphs.
Deviance residuals
For large sample sizes, the Pearson and deviance residuals will be approximately the same. For small sample sizes, the deviance residuals from covariate patterns with small sample sizes can be unreliable (high variance).
Definition 13 (Deviance residual) Here \(\ell_{\text{full}}(x_k)\) is the saturated model’s log-likelihood contribution from covariate pattern \(k\), so that summing over the covariate patterns gives the full log-likelihood:
where \(h_k\) is the leverage of covariate pattern \(k\) (Definition 11).
Diagnostic plots
Definition 14
Cook’s distance for a GLM
Some of the autoplot() diagnostic panels display Cook’s distance, which measures how influential each covariate pattern is on the fit. For a generalized linear model, the Cook’s distance for covariate pattern \(k\) combines the standardized Pearson residual (Definition 12) and the leverage (Definition 11):
Remark 6 (Relation to Cook’s distance for linear models). This diagnostic is the GLM analog of Cook’s distance for linear models, and shares its closed-form structure.
Example 30 (Diagnostics for the WCGS CHD model) Let’s take a look at the full set of autoplot() diagnostics now for our CHD model:
\[
\begin{aligned}
{\mathbb{E}\mathopen{}\left[Y|X=x\right]\mathclose{}} &= {\mathbb{E}\mathopen{}\left[{\mathbb{E}\mathopen{}\left[Y | X, C\right]\mathclose{}} | X=x\right]\mathclose{}}
&& \text{(law of total expectation)}
\\ &= {\mathbb{E}\mathopen{}\left[{\color{red}{\pi(X,C)}} | X=x\right]\mathclose{}}
&& \text{(Bernoulli conditional mean: } {\mathbb{E}\mathopen{}\left[Y|X,C\right]\mathclose{}} = \pi(X,C) \text{)}
\\ &= {\mathbb{E}\mathopen{}\left[\eta_0 + \beta_X X + \beta_C C | X=x\right]\mathclose{}}
&& \text{(identity-link model definition of } \pi \text{)}
\\ &= {\mathbb{E}\mathopen{}\left[\eta_0 | X=x\right]\mathclose{}} + {\mathbb{E}\mathopen{}\left[\beta_X X | X=x\right]\mathclose{}} + {\mathbb{E}\mathopen{}\left[\beta_C C | X=x\right]\mathclose{}}
&& \text{(linearity of expectation)}
\\ &= \eta_0 + {\mathbb{E}\mathopen{}\left[\beta_X X | X=x\right]\mathclose{}} + {\mathbb{E}\mathopen{}\left[\beta_C C | X=x\right]\mathclose{}}
&& \text{(expectation of a constant)}
\\ &= \eta_0 + \beta_X {\mathbb{E}\mathopen{}\left[X | X=x\right]\mathclose{}} + \beta_C {\mathbb{E}\mathopen{}\left[C | X=x\right]\mathclose{}}
&& \text{(constant factors move outside expectations)}
\\ &= \eta_0 + \beta_X x + \beta_C {\mathbb{E}\mathopen{}\left[C | X=x\right]\mathclose{}}
&& \text{(} {\mathbb{E}\mathopen{}\left[X | X=x\right]\mathclose{}} = x \text{)}
\\ &= {\color{red}{(\eta_0 + \beta_C{\mathbb{E}\mathopen{}\left[C | X=x\right]\mathclose{}})}} + {\color{teal}{\beta_Xx}}
&& \text{(commute and regroup the terms)}
\end{aligned}
\]
If \(C \perp\!\!\!\perp X\), then \({\mathbb{E}\mathopen{}\left[C|X=x\right]\mathclose{}} = {\mathbb{E}\mathopen{}\left[C\right]\mathclose{}}\), and we can simplify further:
\[
\begin{aligned}
{\mathbb{E}\mathopen{}\left[Y|X=x\right]\mathclose{}} &= {\color{red}{(\eta_0 + \beta_C {\mathbb{E}\mathopen{}\left[C|X=x\right]\mathclose{}})}} + {\color{teal}{\beta_Xx}}
&& \text{(marginal mean under the identity link)}
\\
&= {\color{red}{(\eta_0 + \beta_C {\mathbb{E}\mathopen{}\left[C\right]\mathclose{}})}} + {\color{teal}{\beta_Xx}}
&& \text{(} C \perp\!\!\!\perp X \text{, so } {\mathbb{E}\mathopen{}\left[C|X=x\right]\mathclose{}} = {\mathbb{E}\mathopen{}\left[C\right]\mathclose{}} \text{)}
\\&= {\color{red}{\eta_0^*}} + {\color{teal}{\beta_Xx}}
&& \text{(definition: } \eta_0^* \stackrel{\text{def}}{=}\eta_0 + \beta_C {\mathbb{E}\mathopen{}\left[C\right]\mathclose{}} \text{)}
\end{aligned}
\]
Then:
\[
\begin{aligned}
\frac{\partial}{\partial x} {\mathbb{E}\mathopen{}\left[Y|X=x\right]\mathclose{}}
&= \frac{\partial}{\partial x} \mathopen{}\left({\color{red}{\eta_0^*}} + {\color{teal}{\beta_Xx}}\right)\mathclose{}
&& \text{(marginal mean when } C \perp\!\!\!\perp X \text{)}
\\ &= \frac{\partial}{\partial x}\eta_0^* + \frac{\partial}{\partial x}\mathopen{}\left(\beta_X x\right)\mathclose{}
&& \text{(linearity of differentiation)}
\\ &= 0 + \frac{\partial}{\partial x}\mathopen{}\left(\beta_X x\right)\mathclose{}
&& \text{(} \eta_0^* \text{ does not depend on } x \text{)}
\\ &= 0 + \beta_X
&& \text{(derivative of a linear term)}
\\ &= {\color{teal}{\beta_X}}
&& \text{(additive identity)}
\end{aligned}
\]
The conditional slope is the same:
\[
\begin{aligned}
\frac{\partial}{\partial x} {\mathbb{E}\mathopen{}\left[Y|X=x,C=c\right]\mathclose{}}
&= \frac{\partial}{\partial x} \mathopen{}\left(\eta_0 + \beta_Xx + \beta_Cc\right)\mathclose{}
&& \text{(identity-link model definition of } \pi \text{)}
\\ &= 0 + \beta_X + 0
&& \text{(term-by-term: only } \beta_X x \text{ depends on } x \text{)}
\\ &= {\color{teal}{\beta_X}}
&& \text{(additive identity)}
\end{aligned}
\]
In other words, for a model with an identity link function, if covariates \(X\) and \(C\) are independent, then the slope with respect to \(X\) doesn’t depend on whether \(C\) is included in the model (and an analogous result holds if \(X\) is discrete or categorical).
Exercise 27 What are the expressions for \({\mathbb{E}\mathopen{}\left[Y|X=x\right]\mathclose{}}\) and \(\frac{\partial}{\partial x} {\mathbb{E}\mathopen{}\left[Y|X=x\right]\mathclose{}}\) for the identity-link model in Equation 50, if \({\mathbb{E}\mathopen{}\left[C|X=x\right]\mathclose{}} = \gamma_0 + \gamma_x x\)?
Solution 27. \[
\begin{aligned}
{\mathbb{E}\mathopen{}\left[Y|X=x\right]\mathclose{}}
&= {\mathbb{E}\mathopen{}\left[\pi(x, C)|X=x\right]\mathclose{}}
&& \text{(law of total expectation, conditional on } X = x \text{)}
\\ &= {\mathbb{E}\mathopen{}\left[\eta_0 + \beta_Xx + \beta_C C|X=x\right]\mathclose{}}
&& \text{(identity-link model)}
\\ &= \eta_0 + \beta_Xx + \beta_C {\mathbb{E}\mathopen{}\left[C|X=x\right]\mathclose{}}
&& \text{(linearity of expectation)}
\\ &= \eta_0 + \beta_Xx + \beta_C (\gamma_0 + \gamma_x x)
&& \text{(substitute } {\mathbb{E}\mathopen{}\left[C|X=x\right]\mathclose{}} = \gamma_0 + \gamma_x x \text{)}
\\ &= \eta_0 + \beta_Xx + \beta_C \gamma_0 + \beta_C \gamma_x x
&& \text{(distribute)}
\\ &= (\eta_0 + \beta_C \gamma_0) + (\beta_X + \beta_C \gamma_x) x
&& \text{(commute and regroup the terms)}
\end{aligned}
\]
\[
\begin{aligned}
\frac{\partial}{\partial x}{\mathbb{E}\mathopen{}\left[Y|X=x\right]\mathclose{}}
&= \frac{\partial}{\partial x}\mathopen{}\left\{(\eta_0 + \beta_C \gamma_0) + (\beta_X + \beta_C \gamma_x) x\right\}\mathclose{}
&& \text{(marginal mean from the derivation of } {\mathbb{E}\mathopen{}\left[Y|X=x\right]\mathclose{}} \text{)}
\\ &= \frac{\partial}{\partial x}(\eta_0 + \beta_C \gamma_0) + \frac{\partial}{\partial x}\mathopen{}\left\{(\beta_X + \beta_C \gamma_x) x\right\}\mathclose{}
&& \text{(linearity of differentiation)}
\\ &= \beta_X + \beta_C \gamma_x
&& \text{(constants have derivative 0; derivative of a linear term)}
\end{aligned}
\]
The marginal mean is still linear in \(x\), but its slope \(\beta_X + \beta_C \gamma_x\) differs from the conditional slope \(\beta_X\) unless \(\beta_C = 0\) or \(\gamma_x = 0\).
Theorem 27 (Marginal mean under an identity link when the covariates are associated) In the identity-link model of Equation 50, suppose \({\mathbb{E}\mathopen{}\left[C|X=x\right]\mathclose{}} = \gamma_0 + \gamma_x x\). Then:
Example 32 (A marginal mean under an identity link) Suppose \(\eta_0 = 0.1\), \(\beta_X = 0.05\) and \(\beta_C = 0.1\) in the identity-link model of Equation 50, and \({\mathbb{E}\mathopen{}\left[C|X=x\right]\mathclose{}} = 1 + 0.5 x\), so that \(\gamma_0 = 1\) and \(\gamma_x = 0.5\). The code below computes \({\mathbb{E}\mathopen{}\left[Y|X=2\right]\mathclose{}}\) by substituting \({\mathbb{E}\mathopen{}\left[C|X=2\right]\mathclose{}}\) into the model, and from the formula of Theorem 27:
Example 33 (A marginal slope under an identity link) Take the parameter values of Example 32. Because the marginal mean is linear in \(x\), the change in \({\mathbb{E}\mathopen{}\left[Y|X=x\right]\mathclose{}}\) from \(x = 2\) to \(x = 3\) equals its slope. The code below computes that change, and the slope from Corollary 10:
The change is 0.1 and the slope formula gives 0.1, so the two agree. The slope exceeds the conditional slope \(\beta_X = 0.05\), because \(\beta_C \gamma_x = 0.05\) is positive.
Exercise 28 What are the expressions for \({\mathbb{E}\mathopen{}\left[Y|X=x\right]\mathclose{}}\) and \(\frac{\partial}{\partial x} {\mathbb{E}\mathopen{}\left[Y|X=x\right]\mathclose{}}\), if instead of the identity-link model in Equation 50, \[\pi(x,c) = \eta_0 + \beta_Xx + \beta_Cc +\beta_{XC}xc\] and \({\mathbb{E}\mathopen{}\left[C|X=x\right]\mathclose{}} = \gamma_0 + \gamma_x x\)?
Solution 28. \[
\begin{aligned}
{\mathbb{E}\mathopen{}\left[Y|X=x\right]\mathclose{}}
&= {\mathbb{E}\mathopen{}\left[\pi(x, C)|X=x\right]\mathclose{}}
&& \text{(law of total expectation, conditional on } X = x \text{)}
\\ &= {\mathbb{E}\mathopen{}\left[\eta_0 + \beta_Xx + \beta_C C + \beta_{XC}xC|X=x\right]\mathclose{}}
&& \text{(interaction model)}
\\ &= \eta_0 + \beta_Xx + \beta_C {\mathbb{E}\mathopen{}\left[C|X=x\right]\mathclose{}} + \beta_{XC}x {\mathbb{E}\mathopen{}\left[C|X=x\right]\mathclose{}}
&& \text{(linearity of expectation)}
\\ &= \eta_0 + \beta_Xx + (\beta_C + \beta_{XC}x){\mathbb{E}\mathopen{}\left[C|X=x\right]\mathclose{}}
&& \text{(factor out } {\mathbb{E}\mathopen{}\left[C|X=x\right]\mathclose{}} \text{)}
\\ &= \eta_0 + \beta_Xx + (\beta_C + \beta_{XC}x)(\gamma_0 + \gamma_x x)
&& \text{(substitute } {\mathbb{E}\mathopen{}\left[C|X=x\right]\mathclose{}} = \gamma_0 + \gamma_x x \text{)}
\\ &= \eta_0 + \beta_Xx + \beta_C\gamma_0 + \beta_C\gamma_x x + \beta_{XC}\gamma_0 x + \beta_{XC}\gamma_x x^2
&& \text{(distribute)}
\\ &= (\eta_0 + \beta_C\gamma_0) + (\beta_X + \beta_C\gamma_x + \beta_{XC}\gamma_0) x + \beta_{XC}\gamma_x x^2
&& \text{(commute and regroup the terms)}
\end{aligned}
\]
\[
\begin{aligned}
\frac{\partial}{\partial x}{\mathbb{E}\mathopen{}\left[Y|X=x\right]\mathclose{}}
&= \frac{\partial}{\partial x}\mathopen{}\left\{(\eta_0 + \beta_C\gamma_0) + (\beta_X + \beta_C\gamma_x + \beta_{XC}\gamma_0) x + \beta_{XC}\gamma_x x^2\right\}\mathclose{}
&& \text{(marginal mean from the derivation of } {\mathbb{E}\mathopen{}\left[Y|X=x\right]\mathclose{}} \text{)}
\\ &= \frac{\partial}{\partial x}(\eta_0 + \beta_C\gamma_0) + \frac{\partial}{\partial x}\mathopen{}\left\{(\beta_X + \beta_C\gamma_x + \beta_{XC}\gamma_0) x\right\}\mathclose{} + \frac{\partial}{\partial x}\mathopen{}\left(\beta_{XC}\gamma_x x^2\right)\mathclose{}
&& \text{(linearity of differentiation)}
\\ &= (\beta_X + \beta_C\gamma_x + \beta_{XC}\gamma_0) + 2\beta_{XC}\gamma_x x
&& \text{(constants have derivative 0; derivative of a linear term; power rule)}
\end{aligned}
\]
So, answering the hint: yes — adding the interaction term changes the functional form of \({\mathbb{E}\mathopen{}\left[Y|X=x\right]\mathclose{}}\). The marginal mean is now quadratic in \(x\) (whenever \(\beta_{XC} \neq 0\) and \(\gamma_x \neq 0\)), even though the conditional model is linear in \(x\) for each fixed \(c\), and the marginal slope now varies with \(x\).
Theorem 28 (Marginal mean under an identity link with an interaction) Suppose \(\pi(x,c) = \eta_0 + \beta_Xx + \beta_Cc +\beta_{XC}xc\) and \({\mathbb{E}\mathopen{}\left[C|X=x\right]\mathclose{}} = \gamma_0 + \gamma_x x\). Then:
Example 34 (A marginal mean under an identity link with an interaction) Suppose \(\eta_0 = 0.1\), \(\beta_X = 0.05\), \(\beta_C = 0.1\) and \(\beta_{XC} = 0.02\), and \({\mathbb{E}\mathopen{}\left[C|X=x\right]\mathclose{}} = 1 + 0.5 x\), so that \(\gamma_0 = 1\) and \(\gamma_x = 0.5\). The code below computes \({\mathbb{E}\mathopen{}\left[Y|X=2\right]\mathclose{}}\) by substituting \({\mathbb{E}\mathopen{}\left[C|X=2\right]\mathclose{}}\) into the model, and from the formula of Theorem 28:
Example 35 (A marginal slope under an identity link with an interaction) Take the parameter values of Example 34. Because the marginal mean is now quadratic in \(x\), its slope varies with \(x\). The code below approximates the slope at \(x = 2\) and \(x = 4\) with a central difference, and compares it with the formula of Corollary 11:
At \(x = 2\) and \(x = 4\), the central differences are 0.16, 0.2 and the formula gives 0.16, 0.2, so the two agree, and the slope increases with \(x\).
10.2 Deriving risk ratios and risk differences from logistic regression models
Apply the expit function (definition) to the linear predictor for each covariate pattern to compute the (estimated) risks,
Then take the differences or ratios of the risks, as needed.
For example, suppose we have a logistic regression model with a binary exposure \(A\) and a covariate \(Z\):
\[
{\operatorname{logit}\mathopen{}\left\{\Pr(Y = 1 | A, Z)\right\}\mathclose{}} = \beta_0 + \beta_A A + \beta_Z Z
\tag{51}\]
Definition 15 (Conditional predicted risk (conditional risk)) The conditional predicted risk (or conditional risk) for an individual with exposure \(A = a\) and covariate \(Z = z\) is the population probability
\[
\pi(a, z) \stackrel{\text{def}}{=}\Pr(Y = 1 \mid A = a, Z = z).
\]
Under the logistic model in Equation 51, this population risk equals
Definition 16 (Conditional risk difference) The conditional risk difference comparing exposure levels \(a = 1\) vs. \(a = 0\) at a fixed covariate value \(z\) is, using the conditional predicted risk (Definition 15):
Definition 17 (Conditional risk ratio) The conditional risk ratio comparing exposure levels \(a = 1\) vs. \(a = 0\) at a fixed covariate value \(z\) is, using the conditional predicted risk (Definition 15):
Example 36 (Numerical example: conditional RD and RR at a fixed covariate value) Using the WCGS data with dibpat (behavior pattern) as the exposure and chd69 (coronary heart disease by 1969) as the outcome, adjusted for age:
These values are conditional estimates: both hold age fixed at 50 and compare only the two exposure levels at that one age.
Marginal vs. conditional effects
Note that these risk differences and risk ratios are conditional on the covariate value \(z\). In many applications, we want to summarize the effect across the population, which requires computing a marginal risk difference or risk ratio.
Definition 18 (Observed marginal risk) The observed marginal risk under exposure level \(A = a\) is:
\[\pi(a) \stackrel{\text{def}}{=}\Pr(Y = 1 \mid A = a)\]
Example 37 (Illustration: observed marginal risk) Continuing the WCGS example (Example 36):
The observed marginal risk among the Type A men (\(A = 1\)) is \(\pi(1) = \Pr(Y = 1 \mid A = 1)\). The proportion of the Type A men who developed CHD by 1969 estimates it:
\[
\hat{\pi}(1) = 0.112
\]
Definition 18 collapses the outcome over everything else in one step. When the model also conditions on covariates \(Z\), we can unpack \(\pi(a)\) as the covariate-specific risk \(\pi(a, z)\) averaged over the distribution of \(Z\) among those with \(A = a\):
Theorem 29 (Marginal risk as a conditional expectation)\[\pi(a) = {\mathbb{E}\mathopen{}\left[{\color{teal}{\pi(a, Z)}} \mid {\color{red}{A = a}}\right]\mathclose{}}\]
where \({\color{teal}{\pi(a, z)}}\) is the conditional predicted risk (Definition 15).
Proof. \[
\begin{aligned}
\pi(a)
&= \Pr(Y = 1 \mid A = a)
&& \text{[definition of observed marginal risk]}
\\
&= \int \Pr(Y = 1 \mid Z=z, A = a)\, {\color{red}{f_{Z \mid A}(z \mid a)}}\, dz
&& \text{[law of total probability]}
\\
&= \int {\color{teal}{\pi(a, z)}}\, {\color{red}{f_{Z \mid A}(z \mid a)}}\, dz
&& \text{[definition of conditional risk]}
\\
&= {\mathbb{E}\mathopen{}\left[{\color{teal}{\pi(a, Z)}} \mid {\color{red}{A = a}}\right]\mathclose{}}
&& \text{[definition of conditional expectation]}
\end{aligned}
\]
Example 38 (Observed marginal risk by standardization) Take \(Z\) to be an indicator for age 50 or older. Among the WCGS men with \(A = 1\) (Type A):
the age-specific risks are \(\pi(1, 0) = 0.089\) (under 50) and \(\pi(1, 1) = 0.159\) (50 or older), and \(\Pr(Z = 1 \mid A = 1) = 0.329\) of the Type A men are 50 or older. Then Theorem 29 gives:
In causal inference, potential outcomes\(Y^a\) represent the outcome each unit would have under exposure level \(a\). Population-level causal estimands summarize these potential outcomes:
Definition 19 (Potential mean (mean potential outcome)) The potential mean (or mean potential outcome) under treatment \(A = a\) is the expected value of the potential outcome\(Y^a\):
Remark 7 (Interpretation of the potential mean). The potential mean is what the average outcome would be if the entire population were assigned treatment \(a\).
Example 39 (Illustration: potential mean) Suppose, hypothetically, that if every man in the WCGS cohort had exhibited Type A behavior pattern (\(a = 1\)), the fraction who would go on to develop CHD by 1969 were close to the fraction actually observed among the men who really did have that behavior pattern, \(\hat{\pi}(1) = 0.112\) (Example 37). Under that supposition, the potential mean is \(\mu_1 = {\mathbb{E}\mathopen{}\left[Y^1\right]\mathclose{}} = 0.112\).
For a binary outcome, the potential mean is a probability, which we give its own name:
Definition 20 (Causal marginal risk (potential probability, potential marginal risk)) For a binary outcome\(Y \in \{0, 1\}\), the potential mean (Definition 19) is a probability, which we call the causal marginal risk (also: potential probability, potential marginal risk) under exposure level \(a\):
\[\pi_a \stackrel{\text{def}}{=}\Pr(Y^a = 1)\]
We use the term causal marginal risk throughout.
Example 40 (Illustration: causal marginal risk) Continuing Example 39, under that same supposition the causal marginal risk is \(\pi_1 = \Pr(Y^1 = 1) = 0.112\) — the fraction who would develop CHD if every man in the cohort had Type A behavior pattern.
Theorem 30 (Causal marginal risk equals potential mean) The matching values in Example 39 and Example 40 are no coincidence: the causal marginal risk (Definition 20) is a special case of the potential mean (Definition 19):
Example 41 (Illustration: causal marginal risk equals potential mean) With \(\pi_1 = 0.112\) as in Example 40, reading the potential mean as an expectation gives the same value:
Conditional exchangeability licenses adding the conditioning on \(A = a\); positivity (\(\Pr(A = a \mid Z = z) > 0\) wherever \(f_Z(z) > 0\)) guarantees that conditional risk is defined in every stratum; and consistency replaces the potential outcome\(Y^a\) with the observed \(Y\).
Example 42 (Causal marginal risk by standardization) Continuing Example 38 with the same age-specific risks \(\pi(1, 0) = 0.089\) and \(\pi(1, 1) = 0.159\), now weight by the age distribution of the whole WCGS population rather than just the Type A men:
[R code]
p_z1_pop <-mean(wcgs_clean$age_ge50)
\(\Pr(Z = 1) = 0.287\) of the whole population is 50 or older — a smaller share than among the Type A men (\(\Pr(Z = 1 \mid A = 1) = 0.329\)), since behavior pattern and age are associated in this cohort. Then Theorem 31 gives:
This causal marginal risk differs (slightly) from the observed marginal risk\(\hat{\pi}(1) = 0.112\) because the Type A men skew somewhat older than the WCGS population as a whole.
We can now place the observed and causal marginal risks side by side:
Remark 8 (Observed vs. causal marginal risk). The two risks differ in what they define — one conditions on the observed exposure \(A = a\), the other on a potential outcome\(Y^a\) — and, once unpacked through \({\color{teal}{\pi(a, z)}} = \Pr(Y = 1 \mid A = a, Z = z)\), in the distribution of \(Z\) they average over:
The observed marginal risk\(\pi(a)\) (Theorem 29) weights \({\color{teal}{\pi(a, z)}}\) by the covariate distribution \({\color{red}{f_{Z \mid A}(z \mid a)}}\)among those actually exposed to\(A = a\), so it inherits any association between \(A\) and \(Z\) (that is, any confounding).
The causal marginal risk\(\pi_a\) (Theorem 31) weights \({\color{teal}{\pi(a, z)}}\) by the whole population’s covariate distribution \({\color{red}{f_{Z}(z)}}\), which is the same for every exposure level \(a\); that common weighting is what makes the causal contrast \(\pi_1 - \pi_0\) an apples-to-apples comparison.
When \(A\) and \(Z\) are associated, the two risks diverge; they coincide in the absence of such association.
Proof. When \(Z \perp\!\!\!\perp A\) the conditional and marginal distributions of \(Z\) coincide, \({\color{red}{f_{Z \mid A}(z \mid a)}} = {\color{red}{f_Z(z)}}\), so Theorem 29 and Theorem 31 give:
Under complete randomization of \(A\), the design delivers \(Z \perp\!\!\!\perp A\) together with the other two identification assumptions as parallel consequences — conditional exchangeability (randomized \(A\) is independent of the potential outcomes, hence also independent given \(Z\)) and positivity (every level has positive probability in each stratum) — so consistency and randomization alone suffice [18, Ch. 2–3]. (Marginal independence \(Z \perp\!\!\!\perp A\) on its own does not imply exchangeability; randomization is the stronger design assumption that yields all three.)
Example 43 (Illustration: coincidence under randomization) Take the same age-specific risks \(\pi(1, 0) = 0.089\) and \(\pi(1, 1) = 0.159\) of Example 38, but now suppose \(A\) had been randomized, so the exposed would carry the population’s age distribution instead of the actual, older-skewing one: \(\Pr(Z = 1 \mid A = 1) = \Pr(Z = 1) = 0.287\). Then the observed marginal risk would be
Two related procedures estimate these marginal risks from a fitted regression model:
Definition 21 (G-computation (g-formula, standardization))G-computation (also called the g-formula or standardization) is a procedure for estimating the causal marginal risk\(\pi_a\) (Definition 20) from observed data [19], see also [18, Ch. 13]:
Fit a regression model for \(\hat\pi(a, z) = \widehat{\Pr}(Y = 1 \mid A = a, Z = z)\)
For each observation \(i\), predict the risk under exposure level \(a\), writing \(\hat\pi_{a,i} \stackrel{\text{def}}{=}\hat\pi(a, z_i)\) for short
Average these predicted risks over the observed covariate distribution:
The following example carries out this procedure on the WCGS data.
Example 44 (Estimated causal marginal risks (WCGS)) Continuing with the same WCGS data and fitted model (wcgs_clean and fit) introduced in Example 36 — dibpat (behavior pattern) as the exposure and chd69 (coronary heart disease by 1969) as the outcome, adjusted for age:
The causal marginal risks\(\hat\pi_a = \frac{1}{n}\sum_{i=1}^n\hat\pi_{a,i}\) standardize the fitted risks \(\hat\pi_{a,i} = \hat\pi(a, z_i)\) over the full covariate distribution (Definition 21):
Under the identification assumptions of Theorem 31, this procedure consistently estimates the causal marginal risk:
Theorem 32 (Consistency of g-computation) Suppose:
the data \((Y_i, A_i, Z_i)\), \(i = 1, \dots, n\), are i.i.d. draws from the population;
the outcome regression is correctly specified, so the fitted coefficients are consistent, \(\hat\beta \overset{p}{\to} \beta^*\) (standard MLE consistency for a correctly specified GLM; see Agresti [20], Chapter 4);
the identification assumptions of Theorem 31 hold;
the predictor vectors are uniformly bounded, \(\|x_{a,i}\| \le B < \infty\) (as holds when covariates are bounded).
Proof. Split the estimator into the average of the true conditional risks plus an estimation-error term:
\[
\begin{aligned}
\hat\pi_a
&= \frac{1}{n}\sum_{i=1}^n\hat\pi(a, z_i)
&& \text{[definition of the estimator]}
\\
&= \frac{1}{n}\sum_{i=1}^n{\color{teal}{\pi(a, z_i)}}
+ \frac{1}{n}\sum_{i=1}^n\mathopen{}\left(\hat\pi(a, z_i) - {\color{teal}{\pi(a, z_i)}}\right)\mathclose{}
&& \text{[add and subtract the true risks]}
\end{aligned}
\]
The estimation-error term converges to zero in probability. By assumption, the fitted coefficients are consistent, \(\hat\beta \overset{p}{\to} \beta^*\). Express the fitted and true risks as the logistic link of the linear predictor, \(\hat\pi(a, z_i) \stackrel{\text{def}}{=}{\operatorname{expit}\mathopen{}\left\{x_{a,i}'\hat\beta\right\}\mathclose{}}\) and \({\color{teal}{\pi(a, z_i)}} \stackrel{\text{def}}{=}{\operatorname{expit}\mathopen{}\left\{x_{a,i}'\beta^*\right\}\mathclose{}}\), and recall that \(\operatorname{expit}\) is Lipschitz with constant \(\tfrac{1}{4}\) (its derivative\({\operatorname{expit}\mathopen{}\left\{u\right\}\mathclose{}}\,(1 - {\operatorname{expit}\mathopen{}\left\{u\right\}\mathclose{}})\) is at most \(\tfrac{1}{4}\)). Then
\[
\begin{aligned}
\mathopen{}\left|\hat\pi(a, z_i) - {\color{teal}{\pi(a, z_i)}}\right|\mathclose{}
&= \mathopen{}\left|{\operatorname{expit}\mathopen{}\left\{x_{a,i}'\hat\beta\right\}\mathclose{}} - {\operatorname{expit}\mathopen{}\left\{x_{a,i}'\beta^*\right\}\mathclose{}}\right|\mathclose{}
&& \text{[risk as logistic link of the linear predictor]}
\\
&\le \tfrac{1}{4}\mathopen{}\left|x_{a,i}'\hat\beta - x_{a,i}'\beta^*\right|\mathclose{}
&& \text{[$\operatorname{expit}$ is $\tfrac{1}{4}$-Lipschitz, by the mean value theorem]}
\\
&= \tfrac{1}{4}\mathopen{}\left|x_{a,i}'(\hat\beta - \beta^*)\right|\mathclose{}
&& \text{[factor out $x_{a,i}'$]}
\\
&\le \tfrac{1}{4}\,\|x_{a,i}\|\,\|\hat\beta - \beta^*\|
&& \text{[Cauchy-Schwarz]}
\\
&\le \tfrac{B}{4}\,\|\hat\beta - \beta^*\|
&& \text{[boundedness condition $\|x_{a,i}\| \le B$]}
\end{aligned}
\]
(a uniform bound that pointwise convergence of the individual terms, correlated through the shared \(\hat\beta\), would not provide on its own). The remaining term averages the true risks over an i.i.d. sample \(z_1, \dots, z_n\) from the marginal distribution\(f_Z\), so the weak law of large numbers gives
\[
\frac{1}{n}\sum_{i=1}^n{\color{teal}{\pi(a, z_i)}}
\overset{p}{\to} {\mathbb{E}\mathopen{}\left[{\color{teal}{\pi(a, Z)}}\right]\mathclose{}}.
\qquad \text{[weak law of large numbers]}
\]
The WCGS estimate \(\hat\pi_1\) computed in Example 44 is a realization of the estimator that Theorem 32 covers: as the sample grows, that estimate is guaranteed to converge to the causal marginal risk \(\pi_1\).
Definition 22 (Predictive margins) A predictive margin is the fitted risk \(\hat\pi(a, z)\) averaged over a chosen set of observations \(S\)the term is due to [21], [22] develop the underlying standardization-as-prediction framework:
using the shorthand \(\hat\pi_{a,i} = \hat\pi(a, z_i)\) from Definition 21, where \(|S|\) is the number of observations in \(S\). The choice of the averaging set \(S\) determines which estimand the margin targets; the two standard choices each have their own name.
Remark 9 (Where the term “predictive margins” is used). The term “predictive margins” is commonly used in social science and in Stata’s margins command.
Definition 23 (Full-sample predictive margin) The full-sample predictive margin averages the fitted risks over the whole sample\(S = \{1, \dots, n\}\):
Example 45 (Illustration: full-sample predictive margin) In the WCGS example (Example 44), the g-computation estimate \(\hat\pi_1\) is simultaneously the full-sample predictive margin \(\widehat{\text{PM}}(1)\): both are the same average \(\frac{1}{n}\sum_{i=1}^n\hat\pi_{1,i}\) of the fitted Type A risks over the whole sample.
Corollary 13 (Full-sample predictive margin estimates the causal marginal risk) The full-sample predictive margin is consistent for the causal marginal risk \(\pi_a\) (Definition 20):
Proof. The full-sample predictive margin \(\frac{1}{n}\sum_{i=1}^n\hat\pi_{a,i}\) is, term for term, the g-computation estimator\(\hat\pi_a\) of Definition 21, so its consistency for \(\pi_a\) is exactly Theorem 32.
Definition 24 (Exposed-subgroup predictive margin) The exposed-subgroup predictive margin averages the fitted risks only over the observations actually exposed to \(A = a\), \(S = \{i : A_i = a\}\), and we give it its own symbol \(\hat\pi_a(a)\):
where \(n_a\) is the number of observations with \(A_i = a\). The subscript records the treatment level the risks are predicted under, and the argument records the subgroup averaged over; the full-sample margin \(\hat\pi_a\) averages over everyone instead.
Example 46 (Illustration: exposed-subgroup predictive margin) Continuing Example 38, where the exposed (\(A = 1\)) have \(\Pr(Z = 1 \mid A = 1) = 0.329\) and age-specific risks \(\pi(1, 0) = 0.089\) and \(\pi(1, 1) = 0.159\), averaging the fitted risks over the exposed subgroup gives
Theorem 33 (Exposed-subgroup predictive margin estimates the observed marginal risk) With the data \((Y_i, A_i, Z_i)\), \(i = 1, \dots, n\), drawn i.i.d. from the population, under correct model specification, and with the predictor vectors uniformly bounded (\(\|x_{a,i}\| \le B < \infty\), as in Theorem 32), the exposed-subgroup predictive margin is consistent for the observed marginal risk \(\pi(a)\) (Definition 18):
\[\hat\pi_a(a) \overset{p}{\to} \pi(a)\]
Proof. Split the estimator into the average of the true conditional risks over the exposed subgroup plus an estimation-error term:
The estimation-error term converges to zero in probability by the same bounded-predictor Lipschitz bound as in Theorem 32: \(\frac{1}{n_a}\sum_{i : A_i = a}\mathopen{}\left|\hat\pi(a, z_i) - {\color{teal}{\pi(a, z_i)}}\right|\mathclose{}
\le \tfrac{B}{4}\,\|\hat\beta - \beta^*\| \overset{p}{\to} 0\). The observations with \(A_i = a\) are an i.i.d. sample from the conditional distribution \(f_{Z \mid A}(z \mid a)\), so the weak law of large numbers gives
\[
\frac{1}{n_a} \sum_{i : A_i = a} {\color{teal}{\pi(a, z_i)}}
\overset{p}{\to} {\mathbb{E}\mathopen{}\left[{\color{teal}{\pi(a, Z)}} \mid A = a\right]\mathclose{}}.
\qquad \text{[weak law of large numbers]}
\]
Combining the three steps, \(\hat\pi_a(a) \overset{p}{\to} \pi(a)\).
The WCGS exposed-subgroup predictive margin from Example 46 is therefore consistent for the observed marginal risk \(\pi(1)\) by Theorem 33.
Lemma 10 (Exposed-subgroup predictive margin reproduces the observed proportion) If the fitted model includes the exposure \(A\) as a categorical covariate, the exposed-subgroup predictive margin equals the observed event proportion in that subgroup exactly, in any finite sample:
Proof. The maximum-likelihood score equations for a logistic GLM set \(\sum_{i} x_{ij} (Y_i - \hat\mu_i) = 0\) for each covariate column \(x_{\cdot j}\), where \(\hat\mu_i = \hat\pi(A_i, z_i)\) is observation \(i\)’s fitted risk. Because \(A\) enters as a categorical covariate, the indicator column for level \(a\) contributes the score equation
(For the reference level, which has no indicator column of its own, the same identity follows by subtracting the non-reference indicator score equations from the intercept score equation \(\sum_{i=1}^n (Y_i - \hat\mu_i) = 0\).)
For an observation with \(A_i = a\) we have \(\hat\mu_i = \hat\pi(a, z_i)\), so dividing by \(n_a\) gives \(\hat\pi_a(a) = \frac{1}{n_a}\sum_{i : A_i = a}\hat\pi(a, z_i)
= \frac{1}{n_a}\sum_{i : A_i = a} Y_i = \bar Y_a\).
The following example applies these predictive margins to the same WCGS data.
Example 47 (Estimated observed marginal risks (WCGS)) Continuing the WCGS example (Example 44), the observed marginal risks\(\pi(a) = \Pr(Y=1 \mid A=a)\) can be estimated in two equivalent ways.
Directly, as the sample proportion of events within each exposure group:
Or via predictive margins (Definition 22): average the model’s fitted risks over the subgroup actually exposed to \(A = a\), keeping each man’s own covariates and observed exposure:
[R code]
fitted_risk <-predict(fit, type ="response")pi1_obs_pm <-mean(fitted_risk[wcgs_clean$dibpat =="Type A"])pi0_obs_pm <-mean(fitted_risk[wcgs_clean$dibpat =="Type B"])
The two estimates agree exactly (to displayed precision), as Lemma 10 guarantees: because the model includes dibpat as a covariate, the exposed-subgroup predictive margin reproduces the raw event proportion in each dibpat group.
Note that \(\hat\pi(1) \neq \hat\pi_1\) and \(\hat\pi(0) \neq \hat\pi_0\) (Example 44): because age is associated with behavioral pattern (Type A and Type B men have different age distributions), the observed marginal and causal marginal risks differ. Standardization via g-computation adjusts for this difference.
Contrasting marginal risks across exposure levels gives the corresponding marginal risk differences:
Definition 25 (Observed marginal risk difference (OMRD)) The observed marginal risk difference (OMRD) is:
To quantify uncertainty for risk difference or risk ratio estimates derived from logistic regression models (e.g., to calculate SEs, CIs, and p-values), you will need to use the bootstrap, the multivariate delta method, or some other special technique.
The bootstrap is generally the most straightforward approach and does not require deriving complex formulas.
The bootstrap is a resampling method that allows us to estimate the sampling distribution of a statistic without making strong parametric assumptions. The method was introduced by Efron [25]; Efron and Tibshirani [26] give a book-length treatment. For an introduction to the bootstrap, see Bootstrap Confidence Intervals.
Definition 27 (Bootstrap algorithm for a marginal risk difference) To construct a bootstrap confidence interval for a marginal risk difference:
For \(b = 1, \ldots, B\) (see Section 10.2.4.1 for guidance on choosing \(B\)):
Draw a bootstrap sample of size \(n\) with replacement from the original data
Fit the logistic regression model to the bootstrap sample
Compute the marginal risk difference from the fitted model
The bootstrap distribution of the \(B\) risk difference estimates approximates the sampling distribution
Construct a confidence interval using the percentile method (e.g., the 2.5th and 97.5th percentiles for a 95% CI)
Example 50 (Example: CHD risk and behavioral pattern) We’ll use the Western Collaborative Group Study (WCGS) data to illustrate computing marginal risk differences from a logistic regression model.
The research question is: what is the marginal effect of Type A behavioral pattern on CHD risk, adjusting for age?
We define helper functions for g-computation — these helper functions are reused in the bootstrap loop of Section 10.2.2.0.3 — and extract the point estimate already computed in Example 49 for the contrast comparing Type A to Type B behavioral patterns:
[R code]
make_counterfactual_datasets <-function(data, exposure_var, exposed_level, unexposed_level) {if (!is.factor(data[[exposure_var]])) {stop("The exposure variable must be a factor.") } exposure_levels <-levels(data[[exposure_var]])if (!all(c(exposed_level, unexposed_level) %in% exposure_levels)) {stop(sprintf(paste0("Specified exposure levels '%s' and '%s' ","are not in factor levels: %s" ), exposed_level, unexposed_level,paste(exposure_levels, collapse =", ") ) ) } data_exposed <- data data_exposed[[exposure_var]] <-factor(rep(exposed_level, nrow(data_exposed)),levels = exposure_levels ) data_unexposed <- data data_unexposed[[exposure_var]] <-factor(rep(unexposed_level, nrow(data_unexposed)),levels = exposure_levels )list(data_exposed = data_exposed,data_unexposed = data_unexposed )}compute_marginal_rd <-function(model, data, exposure_var, exposed_level, unexposed_level) { counterfactual_data <-make_counterfactual_datasets(data = data,exposure_var = exposure_var,exposed_level = exposed_level,unexposed_level = unexposed_level ) data_exposed <- counterfactual_data$data_exposed data_unexposed <- counterfactual_data$data_unexposed risk_exposed <-predict( model,newdata = data_exposed,type ="response" ) risk_unexposed <-predict( model,newdata = data_unexposed,type ="response" )mean(risk_exposed) -mean(risk_unexposed)}# rd_hat is defined in _sec-marginal-risk-differences.qmd (chunk wcgs-causal-marginal-rd);# alias it here so both computation paths stay in syncmarginal_rd_est <- rd_hat
Bootstrap confidence interval
Now we use the bootstrap to estimate the standard error and construct a 95% confidence interval. In the non-parametric bootstrap, each iteration applies both the model-fitting step and the covariate standardization to the same bootstrap resample. This joint refit-and-restandardize approach mirrors the original world in the bootstrap world and is standard practice for this type of estimator[26, Ch. 6]. (An alternative would hold the covariates at the observed values, but is less common for g-computation estimators.)
[R code]
# Set seed for reproducibilityset.seed(20260512)# Number of bootstrap iterations in this rendered example# (illustrative only; use >= 2000 for final CIs)B <-300boot_estimates <-numeric(B)for (b in1:B) { boot_indices <-sample(seq_len(nrow(wcgs_clean)),size =nrow(wcgs_clean),replace =TRUE ) boot_data <- wcgs_clean[boot_indices, ] boot_fit <-glm( chd69_binary ~ dibpat + age,data = boot_data,family =binomial(link ="logit") ) boot_estimates[b] <-compute_marginal_rd(model = boot_fit,data = boot_data,exposure_var ="dibpat",exposed_level ="Type A",unexposed_level ="Type B" )}boot_se <-sd(boot_estimates)# percentile method: quantiles of the bootstrap distributionci_lower <-as.numeric(quantile(boot_estimates, 0.025))ci_upper <-as.numeric(quantile(boot_estimates, 0.975))
[R code]
tibble(Estimate = marginal_rd_est,`Std. Error`= boot_se,`95% CI Lower`= ci_lower,`95% CI Upper`= ci_upper) |> knitr::kable(digits =4)
Figure 22: Bootstrap distribution of the marginal risk difference (Type A vs Type B behavioral pattern, adjusted for age). Red dashed line: point estimate. Green dotted lines: 95% CI bounds.
Interpretation
Under the identification assumptions (Consistency, Conditional Exchangeability, and Positivity), we estimate that Type A behavioral pattern causally increases CHD risk by 5.62 percentage points compared to Type B behavioral pattern, after standardizing over the observed age distribution (95% CI: 3.7 to 7.32 percentage points).
Because this rendered example uses 300 bootstrap samples, the displayed standard error and confidence interval are illustrative. For final inferential reporting, rerun with at least 2000 bootstrap samples.
A 95% CI that excludes zero does not by itself imply practical or clinical importance; also interpret the estimated risk difference magnitude.
Alternative: Using the boot package
The boot package provides a more streamlined interface for bootstrap inference. Here’s how to compute the same confidence interval using boot::boot():
[R code]
library(boot)statistic_fn <-function(data, indices) { boot_data <- data[indices, ] boot_fit <-glm( chd69_binary ~ dibpat + age,data = boot_data,family =binomial(link ="logit") )compute_marginal_rd(model = boot_fit,data = boot_data,exposure_var ="dibpat",exposed_level ="Type A",unexposed_level ="Type B" )}set.seed(20260512)boot_results <-boot(data = wcgs_clean,statistic = statistic_fn,# Keep the rendered example fast; increase to 2000+ for final analyses.R =300)boot_resultsboot.ci(boot_results, type =c("perc", "bca"))
The boot package provides several types of confidence intervals, including the percentile method (perc) and the bias-corrected and accelerated (BCa) method (bca), which can provide better coverage in some situations. The BCa method is more demanding than the percentile method: its bias-correction and acceleration estimates are unstable at the illustrative R = 300 used here (and can warn or fail outright), so use a substantially larger R (at least 2000) before relying on bca intervals.
Computing marginal risk ratios
Contrasting marginal risks by ratio rather than by difference gives the corresponding marginal risk ratios:
Definition 28 (Observed marginal risk ratio (OMRR)) The observed marginal risk ratio (OMRR) is:
The point estimates in Example 51 and Example 52 use the same fitted model as Example 49. To quantify their uncertainty, we bootstrap the marginal risk ratio, modifying the statistic function to compute ratios instead of differences:
[R code]
library(boot)compute_marginal_rr <-function(model, data, exposure_var, exposed_level, unexposed_level) { counterfactual_data <-make_counterfactual_datasets(data = data,exposure_var = exposure_var,exposed_level = exposed_level,unexposed_level = unexposed_level ) data_exposed <- counterfactual_data$data_exposed data_unexposed <- counterfactual_data$data_unexposed risk_exposed <-predict( model,newdata = data_exposed,type ="response" ) risk_unexposed <-predict( model,newdata = data_unexposed,type ="response" )mean(risk_exposed) /mean(risk_unexposed)}statistic_fn_rr <-function(data, indices) { boot_data <- data[indices, ] boot_fit <-glm( chd69_binary ~ dibpat + age,data = boot_data,family =binomial(link ="logit") )compute_marginal_rr(model = boot_fit,data = boot_data,exposure_var ="dibpat",exposed_level ="Type A",unexposed_level ="Type B" )}set.seed(20260512)boot_results_rr <-boot(data = wcgs_clean,statistic = statistic_fn_rr,# Keep the rendered example fast; increase to 2000+ for final analyses.R =300)# BCa intervals can be unstable at this small R;# increase to R = 2000+ before relying on bca results.boot_ci_rr <-boot.ci(boot_results_rr, type =c("perc", "bca"))cat("Marginal Risk Ratio (Type A vs Type B):",round(boot_results_rr$t0, 3), "\n")cat("95% Percentile CI: (",round(boot_ci_rr$percent[4], 3), ",",round(boot_ci_rr$percent[5], 3), ")\n")
Notes and caveats
Definition 30 (Collapsibility) An estimand\(\theta\) is collapsible with respect to a covariate \(Z\) if the population-level estimand equals the marginal-distribution-weighted average of stratum-specific estimands:
Definition 31 (Collapsibility bias) In the setting of Definition 30, collapsibility bias is the discrepancy that arises when \(\theta \neq {\mathbb{E}\mathopen{}\left[\theta(Z)\right]\mathclose{}}\).
By LOTUS (the Law of the Unconscious Statistician), Equation 52 expands into a weighted sum or integral over \(Z\)’s distribution, depending on whether \(Z\) is discrete or continuous:
Theorem 34 (Which estimands are collapsible?) For causalestimands (Definition 20), and under the identification assumptions of Theorem 31, the collapsibility criterion (Definition 30) is evaluated with respect to the marginal distribution \(f_Z(z)\). Additive (difference) measures are collapsible; ratio and log-odds measures are not collapsible in general.
For observational estimands (Definition 18), the marginal measure uses the conditional distribution \(f_{Z \mid A}(z \mid a)\) as weights rather than the marginal \(f_Z(z)\). Collapsibility with respect to \(f_Z\) therefore holds in particular when \(Z \perp\!\!\!\perp A\) (no confounding).
Proof. Additive measures are collapsible by linearity of expectation, applying the causal-marginal-risk identity (Theorem 31) to each potential probability:
Ratio and log-odds measures are not collapsible in general: Example 53 gives a counterexample in which the marginal risk ratio and odds ratio differ from the marginal-distribution-weighted average of their stratum-specific values, and Equation 54 derives the discrepancy algebraically for the risk-ratio case.
For the observational case, when \(Z \perp\!\!\!\perp A\) the conditional weights coincide with the marginal ones, \(f_{Z \mid A}(z \mid a) = f_Z(z)\), so by Theorem 29:
\[
\begin{aligned}
\pi(a)
&= {\mathbb{E}\mathopen{}\left[\pi(a,Z) \mid A = a\right]\mathclose{}}
&& \text{[observed marginal risk theorem: law of total expectation, given $A = a$]}
\\
&= {\mathbb{E}\mathopen{}\left[\pi(a,Z)\right]\mathclose{}},
&& \text{[$Z \perp\!\!\!\perp A$: conditioning on $A = a$ does not change $Z$'s distribution]}
\end{aligned}
\]
establishing that \(\pi(a)\) equals the \(f_Z\)-weighted stratum average, which is collapsibility with respect to \(f_Z\), requiring only \(Z \perp\!\!\!\perp A\), not the full identification assumptions.
Example 53 (Collapsibility: numerical illustration) Continuing the WCGS example with dibpat as the exposure, chd69 as the outcome, and age 50 or older as \(Z\) (Example 38): the causal marginal risk (Definition 20) standardizes both exposure groups’ stratum-specific risks to the same population age distribution \(f_Z(z)\) (Remark 8), so this standardization is exactly the common weighting Definition 30 requires – no simplifying assumptions needed:
The marginal risk difference equals the weighted average of the conditional risk differences exactly, as Theorem 34 guarantees. The marginal risk ratio and marginal odds ratio both differ from the weighted average of their conditional counterparts – though the risk ratio’s discrepancy only shows up in the fourth decimal place here, because the conditional risk ratios happen to be nearly homogeneous across the two age strata (\(2.105\) vs. \(2.100\)).
Non-collapsibility is distinct from effect-measure modification. The conditional odds ratios vary more across strata (\(2.213\) vs. \(2.308\)), and for the risk ratio, that near-homogeneity is exactly what keeps its discrepancy small here: if the conditional risk ratio were instead constant across strata, the marginal risk ratio would reproduce it exactly, just like the risk difference. The odds ratio’s discrepancy is different in kind: even if the conditional odds ratio were held constant across strata, the marginal odds ratio would generally still differ from it (and lie closer to the null) [18, Ch. 4], [27], [28], whereas a constant conditional risk difference or risk ratio always reproduces the corresponding marginal measure exactly.
Important considerations when computing marginal effects
Target population: The marginal effect is specific to the covariate distribution in your sample. If your sample is not representative of your target population, you may want to use standardization or weighting.
so there is no collapsibility bias from averaging over a covariate \(Z\). Risk ratios are not collapsible in general: when the conditional RR varies across strata, the marginal RR does not equal the marginal-distribution-weighted average of conditional RRs, \({\mathbb{E}\mathopen{}\left[\text{RR}(Z)\right]\mathclose{}}\), because a ratio of expectations is not the same as an expectation of ratios:
\[
\begin{aligned}
\frac{\pi_1}{\pi_0}
&= \frac{{\mathbb{E}\mathopen{}\left[\pi(1, Z)\right]\mathclose{}}}{{\mathbb{E}\mathopen{}\left[\pi(0, Z)\right]\mathclose{}}}
&& \text{[causal marginal risk theorem]}
\\
&\neq {\mathbb{E}\mathopen{}\left[\frac{\pi(1, Z)}{\pi(0, Z)}\right]\mathclose{}}
&& \text{[ratio of expectations, not expectation of ratios]}
\\
&= {\mathbb{E}\mathopen{}\left[\text{RR}(Z)\right]\mathclose{}}.
&& \text{[definition of conditional risk ratio]}
\end{aligned}
\tag{54}\]
Unlike the odds ratio, though, this discrepancy is entirely a consequence of the conditional RR varying across strata: when the conditional risk ratio is instead constant, \(\text{RR}(z) = r\) for every \(z\), the marginal RR reproduces it exactly:
so \(\pi_1 / \pi_0 = r\): like the risk difference, the risk ratio is collapsible under a homogeneous conditional effect.
Odds ratios are non-collapsible in a stronger sense than risk ratios: even when the conditional OR is the same in every stratum, the marginal OR is generally different from it (closer to the null) [18, Ch. 4], [27], [28], whereas a constant conditional RD or RR always reproduces the corresponding marginal RD or RR exactly (the marginal RD is the average \({\mathbb{E}\mathopen{}\left[\text{RD}(Z)\right]\mathclose{}}\) of the stratum-specific RDs by Theorem 34, and the average of a constant is that constant).
Bootstrap sample size: A confidence interval needs more bootstrap resamples than a standard error, because it depends on the tails of the bootstrap distribution rather than just its spread [26, Ch. 6], [29, Ch. 2]. As a conservative rule of thumb, use at least 1000 iterations for standard errors and at least 2000 for confidence intervals. More iterations give more stable estimates but take longer to compute.
Alternative methods: The multivariate delta method can also be used to compute standard errors analytically, but the formulas are complex. The margins package in R provides implementations of the delta method for marginal effects.
Case-control studies: These methods are not valid for case-control studies, where sampling is stratified by outcome. In case-control designs, only odds ratios can be estimated consistently (see Odds Ratios in Case-Control Studies).
10.3 Other link functions for Bernoulli outcomes
Alternatively, if you want to estimate risk ratios more directly from the model, you can sometimes change the link function from \({\operatorname{logit}\mathopen{}\left\{\right\}\mathclose{}}\) to \({\operatorname{log}\mathopen{}\left\{\right\}\mathclose{}}\); then you can obtain risk ratios by exponentiating coefficients 1, just like we did for odds ratios with the logit link:
We can compare the two link functions by plotting their fitted germination probabilities across the range of the storage covariate, alongside the observed proportions:
[R code]
library(tidyr)anthers_fitted_grid <-data.frame(storage =seq(min(anthers_sum$storage),max(anthers_sum$storage),length.out =100 ) ) |>mutate(`Log link`=predict(anthers_glm_log, pick(storage), type ="response"),`Logit link`=predict(anthers_glm_logit, pick(storage), type ="response") ) |>pivot_longer(cols =c(`Log link`, `Logit link`),names_to ="Link function",values_to ="fitted" )anthers_observed <- anthers_sum |>mutate(proportion = y / n)ggplot() +geom_line(data = anthers_fitted_grid,mapping =aes(x = storage, y = fitted, color =`Link function`) ) +geom_point(data = anthers_observed,mapping =aes(x = storage, y = proportion),size =3 ) +labs(x ="Storage condition",y ="Fitted probability of germination" ) +theme_bw()
Figure 23: Fitted germination probabilities from the log-link and logit-link models for the anthers data, with the observed proportions as points. The two link functions nearly coincide here because the model is saturated (two parameters fit to two storage conditions), so both reproduce the observed proportions at the data points and differ only slightly in between.
In practice, fitting a binomial model with link = "log" often fails to converge, producing errors about not finding good starting values for the estimation procedure. This convergence failure is likely because the model is producing fitted probabilities greater than 1.
When this happens, you can instead switch the outcome distribution from binomial to Poisson and fit a Poisson regression model (we will see those soon!). Note that this substitution is a change in model structure — a different outcome distribution — not just a different way of fitting the same model. With a Poisson outcome distribution, you won’t get warnings about fitted probabilities greater than 1, but that distribution isn’t quite right for binary outcomes. Despite this mismatch, Poisson regression is the usual fallback when the log-binomial model fails to converge.
This probability is always in \((0, 1)\), regardless of the values of \(\beta_0\), \(\beta_1\), or \(x\).
Log link (Researcher B):
\[
\pi(x) = e^{\beta_0 + \beta_1 x}
\]
This exponential expression is always positive, but may exceed 1.
(b)
For the log-link model, \(\pi(x) \leq 1\) requires \(e^{\beta_0 + \beta_1 x} \leq 1\).
Since the exponential function is increasing, this requirement is equivalent to \[
\beta_0 + \beta_1 x \leq 0
\qquad \text{for all } x > 0.
\]
Because this must hold for all positive \(x\), a positive slope \(\beta_1 > 0\) is not possible on this unbounded domain: for sufficiently large \(x\), we would have \(\beta_0 + \beta_1 x > 0\). Thus we need \(\beta_1 \leq 0\). Also, to keep \(\beta_0 + \beta_1 x \leq 0\) for \(x\) arbitrarily close to 0, we need \(\beta_0 \leq 0\). So the parameter constraint is \(\beta_0 \leq 0\) and \(\beta_1 \leq 0\).
(c)
The logit link is more commonly used for binary outcomes.
One practical advantage: the logit link automatically constrains\(\pi(x) \in (0,1)\) for any real values of \(\beta_0\), \(\beta_1\), and \(x\), eliminating the risk of predicted probabilities outside \([0,1]\). Additionally, the logit link yields odds ratios as the natural measure of association, which are widely used in epidemiology (see Vittinghoff et al. [2, Ch. 5]).
Odds function (def) \[{\operatorname{odds}\mathopen{}\left\{\pi\right\}\mathclose{}} \stackrel{\text{def}}{=}\frac{\pi}{1-\pi}\]
Probability to odds (thm, cor) \[\omega= \frac{\pi}{1-\pi} = {\operatorname{odds}\mathopen{}\left\{\pi\right\}\mathclose{}}\]
Simplified odds expressions; odds of a non-event (thm, cor) \[{\operatorname{odds}\mathopen{}\left\{\pi\right\}\mathclose{}} = \frac{1}{\pi^{-1}-1} = {\mathopen{}\left(\pi^{-1}-1\right)\mathclose{}}^{-1},
\qquad \omega(\neg A) = \frac{1-\pi}{\pi} = \pi^{-1}-1\]
Odds ratio (def) \[\text{ϙ}(\omega_1, \omega_2) \stackrel{\text{def}}{=}\frac{\omega_1}{\omega_2}\]
OR as ratio of probability ratios (thm) \[\text{ϙ}(\omega_1, \omega_2)
= \frac{\omega_1}{\omega_2}
= \frac{\mathopen{}\left(\frac{\pi_1}{1-\pi_1}\right)\mathclose{}}{\mathopen{}\left(\frac{\pi_2}{1-\pi_2}\right)\mathclose{}}\]
Odds ratios are reversible, marginally and conditionally (thm, thm) \[\text{ϙ}_{\omega}(A|B) = \text{ϙ}_{\omega}(B|A),
\qquad \text{ϙ}_{\omega}(A|B,C) = \text{ϙ}_{\omega}(B|A,C)\]
Inverse-odds and probability recovery
Odds to probability (thm) \[\pi = \frac{\omega}{1+\omega}\]
Inverse-odds function (def; recovers probability by cor) \[{\operatorname{invodds}\mathopen{}\left\{\omega\right\}\mathclose{}} \stackrel{\text{def}}{=}\frac{\omega}{1 + \omega},
\qquad \pi= {\operatorname{invodds}\mathopen{}\left\{\omega\right\}\mathclose{}}\]
One minus inverse-odds, and its complement (lem, cor) \[1 - \pi= \frac{1}{1+\omega},
\qquad 1+\omega= \frac{1}{1-\pi}\]
Log-odds (logit) and expit
Log-odds, and log-odds from probability (def, thm) \[\eta\stackrel{\text{def}}{=}{\operatorname{log}\mathopen{}\left\{\omega\right\}\mathclose{}},
\qquad \eta= {\operatorname{log}\mathopen{}\left\{\frac{\pi}{1-\pi}\right\}\mathclose{}}\]
Logit function, and expanded form (def, thm) \[\operatorname{logit}(\pi) \stackrel{\text{def}}{=}{\operatorname{log}\mathopen{}\left\{{\operatorname{odds}\mathopen{}\left\{\pi\right\}\mathclose{}}\right\}\mathclose{}} = {\operatorname{log}\mathopen{}\left\{\frac{\pi}{1-\pi}\right\}\mathclose{}}\]
Odds and probability from log-odds (lem, thm) \[\omega= {\operatorname{exp}\mathopen{}\left\{\eta\right\}\mathclose{}},
\qquad \pi= \frac{{\operatorname{exp}\mathopen{}\left\{\eta\right\}\mathclose{}}}{1+{\operatorname{exp}\mathopen{}\left\{\eta\right\}\mathclose{}}}\]
Odds minus probability (thm) \[\omega- \pi = \frac{\pi^2}{1-\pi}, \quad \text{where } \omega= \frac{\pi}{1-\pi}\]
OR as RR times a correction factor (thm) \[\text{ϙ}(\omega_1, \omega_2)
= \rho(\pi_1, \pi_2) \cdot \frac{1-\pi_2}{1-\pi_1}\] When \(\pi_1\) and \(\pi_2\) are both small, the correction factor is close to 1, so the odds ratio is close to the risk ratio.
Throughout this summary, \(\mathord{\smash[b]{\underset{\raise.3ex\hbox{$\scriptstyle\sim$}}{\beta}}\vphantom{\beta}}= (\beta_0, \beta_1, \ldots, \beta_p)\) is the \((p+1) \times 1\) coefficient vector (including the intercept), \(\mathbf{X}\) is the \(n \times (p+1)\) design matrix whose \(i^{\text{th}}\) row is \({\mathord{\smash[b]{\underset{\raise.3ex\hbox{$\scriptstyle\sim$}}{x}}\vphantom{x}}_i}^{\top}\), and \(\mathord{\smash[b]{\underset{\raise.3ex\hbox{$\scriptstyle\sim$}}{\varepsilon}}\vphantom{\varepsilon}}\) is the \(n \times 1\) error vector with components \(\varepsilon_i \stackrel{\text{def}}{=}y_i - \pi_i\).
Score function as sum of components (lem, thm) \[\mathord{\smash[b]{\underset{\raise.3ex\hbox{$\scriptstyle\sim$}}{\ell'}}\vphantom{\ell'}}(\mathord{\smash[b]{\underset{\raise.3ex\hbox{$\scriptstyle\sim$}}{\beta}}\vphantom{\beta}}) = \sum_{i=1}^n\mathord{\smash[b]{\underset{\raise.3ex\hbox{$\scriptstyle\sim$}}{\ell'_i}}\vphantom{\ell'_i}}(\mathord{\smash[b]{\underset{\raise.3ex\hbox{$\scriptstyle\sim$}}{\beta}}\vphantom{\beta}}),
\qquad \ell_i'(\mathord{\smash[b]{\underset{\raise.3ex\hbox{$\scriptstyle\sim$}}{\beta}}\vphantom{\beta}}) = \mathord{\smash[b]{\underset{\raise.3ex\hbox{$\scriptstyle\sim$}}{x}}\vphantom{x}}_i \varepsilon_i\]
This estimating equation has no closed-form solution in general; \(\hat{\mathord{\smash[b]{\underset{\raise.3ex\hbox{$\scriptstyle\sim$}}{\beta}}\vphantom{\beta}}}\) must be computed by numerical iteration.
Concavity (rem): the Hessian is negative semi-definite for every \(\mathord{\smash[b]{\underset{\raise.3ex\hbox{$\scriptstyle\sim$}}{\beta}}\vphantom{\beta}}\) (negative definite when \(\mathbf{X}\) has full column rank), so the log-likelihood is concave and every solution of the score equation is a global maximum.
For \(k \neq 0\), \(e^{\beta_k}\) is an odds ratio; for \(k = 0\), \(e^{\beta_0}\) is the baseline odds.
Odds ratios in logistic regression
General OR formula (lem) \[\text{ϙ}_{\omega}(\mathord{\smash[b]{\underset{\raise.3ex\hbox{$\scriptstyle\sim$}}{x}}\vphantom{x}},\mathord{{\mathord{\smash[b]{\underset{\raise.3ex\hbox{$\scriptstyle\sim$}}{x}}\vphantom{x}}^*}}) = {\operatorname{exp}\mathopen{}\left\{\eta(\mathord{\smash[b]{\underset{\raise.3ex\hbox{$\scriptstyle\sim$}}{x}}\vphantom{x}}) - \eta(\mathord{{\mathord{\smash[b]{\underset{\raise.3ex\hbox{$\scriptstyle\sim$}}{x}}\vphantom{x}}^*}})\right\}\mathclose{}}\]
Difference in log-odds; OR in terms of \(\Delta\eta\) (def, cor) \[\Delta\eta\stackrel{\text{def}}{=}\eta(\mathord{\smash[b]{\underset{\raise.3ex\hbox{$\scriptstyle\sim$}}{x}}\vphantom{x}}) - \eta(\mathord{{\mathord{\smash[b]{\underset{\raise.3ex\hbox{$\scriptstyle\sim$}}{x}}\vphantom{x}}^*}}),
\qquad \text{ϙ}_{\omega}(\mathord{\smash[b]{\underset{\raise.3ex\hbox{$\scriptstyle\sim$}}{x}}\vphantom{x}},\mathord{{\mathord{\smash[b]{\underset{\raise.3ex\hbox{$\scriptstyle\sim$}}{x}}\vphantom{x}}^*}}) = {\operatorname{exp}\mathopen{}\left\{\Delta\eta\right\}\mathclose{}}\]
\(\Delta\eta\) from covariates (lem) \[\Delta\eta= (\mathord{\smash[b]{\underset{\raise.3ex\hbox{$\scriptstyle\sim$}}{x}}\vphantom{x}}- \mathord{{\mathord{\smash[b]{\underset{\raise.3ex\hbox{$\scriptstyle\sim$}}{x}}\vphantom{x}}^*}})\cdot\mathord{\smash[b]{\underset{\raise.3ex\hbox{$\scriptstyle\sim$}}{\beta}}\vphantom{\beta}}\]
Difference in covariate patterns; \(\Delta\eta\) from \(\Delta\mathord{\smash[b]{\underset{\raise.3ex\hbox{$\scriptstyle\sim$}}{x}}\vphantom{x}}\) (def, cor) \[\Delta\mathord{\smash[b]{\underset{\raise.3ex\hbox{$\scriptstyle\sim$}}{x}}\vphantom{x}}\stackrel{\text{def}}{=}\mathord{\smash[b]{\underset{\raise.3ex\hbox{$\scriptstyle\sim$}}{x}}\vphantom{x}}- \mathord{{\mathord{\smash[b]{\underset{\raise.3ex\hbox{$\scriptstyle\sim$}}{x}}\vphantom{x}}^*}},
\qquad \Delta\eta= \Delta\mathord{\smash[b]{\underset{\raise.3ex\hbox{$\scriptstyle\sim$}}{x}}\vphantom{x}}\cdot \mathord{\smash[b]{\underset{\raise.3ex\hbox{$\scriptstyle\sim$}}{\beta}}\vphantom{\beta}}\]
OR in terms of \(\Delta\mathord{\smash[b]{\underset{\raise.3ex\hbox{$\scriptstyle\sim$}}{x}}\vphantom{x}}\) (thm) \[\text{ϙ}_{\omega}(\mathord{\smash[b]{\underset{\raise.3ex\hbox{$\scriptstyle\sim$}}{x}}\vphantom{x}},\mathord{{\mathord{\smash[b]{\underset{\raise.3ex\hbox{$\scriptstyle\sim$}}{x}}\vphantom{x}}^*}}) = {\operatorname{exp}\mathopen{}\left\{(\Delta\mathord{\smash[b]{\underset{\raise.3ex\hbox{$\scriptstyle\sim$}}{x}}\vphantom{x}}) \cdot \mathord{\smash[b]{\underset{\raise.3ex\hbox{$\scriptstyle\sim$}}{\beta}}\vphantom{\beta}}\right\}\mathclose{}}\]
Log OR equals \(\Delta\eta\) (cor) \[{\operatorname{log}\mathopen{}\left\{\text{ϙ}_{\omega}(\mathord{\smash[b]{\underset{\raise.3ex\hbox{$\scriptstyle\sim$}}{x}}\vphantom{x}},\mathord{{\mathord{\smash[b]{\underset{\raise.3ex\hbox{$\scriptstyle\sim$}}{x}}\vphantom{x}}^*}})\right\}\mathclose{}} = \Delta\eta\]
Inference for log-odds and odds ratios
Estimated SE of log-odds (thm) \[{\mathop{\widehat{\operatorname{Var}}}\nolimits\mathopen{}\left(\hat\eta(\mathord{\smash[b]{\underset{\raise.3ex\hbox{$\scriptstyle\sim$}}{x}}\vphantom{x}})\right)\mathclose{}} = \underbrace{{\mathord{\smash[b]{\underset{\raise.3ex\hbox{$\scriptstyle\sim$}}{x}}\vphantom{x}}}^{\top}}_{1 \times (p+1)}\underbrace{\hat{\Sigma}}_{(p+1) \times (p+1)}\underbrace{\mathord{\smash[b]{\underset{\raise.3ex\hbox{$\scriptstyle\sim$}}{x}}\vphantom{x}}}_{(p+1) \times 1},
\qquad {\mathop{\widehat{\operatorname{SE}}}\nolimits\mathopen{}\left(\hat\eta(\mathord{\smash[b]{\underset{\raise.3ex\hbox{$\scriptstyle\sim$}}{x}}\vphantom{x}})\right)\mathclose{}} = \sqrt{{\mathord{\smash[b]{\underset{\raise.3ex\hbox{$\scriptstyle\sim$}}{x}}\vphantom{x}}}^{\top}\hat{\Sigma}\mathord{\smash[b]{\underset{\raise.3ex\hbox{$\scriptstyle\sim$}}{x}}\vphantom{x}}}\]
Estimated SE of \(\Delta\widehat{\eta}\) (thm) \[{\mathop{\widehat{\operatorname{Var}}}\nolimits\mathopen{}\left(\Delta{\hat\eta}\right)\mathclose{}} = \underbrace{{\Delta\mathord{\smash[b]{\underset{\raise.3ex\hbox{$\scriptstyle\sim$}}{x}}\vphantom{x}}}^{\top}}_{1 \times (p+1)}\underbrace{\hat{\Sigma}}_{(p+1) \times (p+1)}\underbrace{(\Delta\mathord{\smash[b]{\underset{\raise.3ex\hbox{$\scriptstyle\sim$}}{x}}\vphantom{x}})}_{(p+1) \times 1},
\qquad {\mathop{\widehat{\operatorname{SE}}}\nolimits\mathopen{}\left(\Delta{\hat\eta}\right)\mathclose{}} = \sqrt{{\Delta\mathord{\smash[b]{\underset{\raise.3ex\hbox{$\scriptstyle\sim$}}{x}}\vphantom{x}}}^{\top}\hat{\Sigma}(\Delta\mathord{\smash[b]{\underset{\raise.3ex\hbox{$\scriptstyle\sim$}}{x}}\vphantom{x}})}\]
CI for an odds ratio (eq; details in sec): exponentiate the endpoints of the CI for \(\Delta\eta\): \[\text{ϙ}_{\omega}(\mathord{\smash[b]{\underset{\raise.3ex\hbox{$\scriptstyle\sim$}}{x}}\vphantom{x}},\mathord{{\mathord{\smash[b]{\underset{\raise.3ex\hbox{$\scriptstyle\sim$}}{x}}\vphantom{x}}^*}}) \in (e^L, e^R),
\qquad (L, R) = \widehat{\Delta\eta}\mp 1.96 \cdot {\mathop{\widehat{\operatorname{SE}}}\nolimits\mathopen{}\left(\widehat{\Delta\eta}\right)\mathclose{}}\]
Case-control studies (section): outcome-stratified sampling breaks estimation of risks, risk ratios, and the components of the disease odds ratio (def), but the exposure odds ratio (def) is estimable, and it equals the disease odds ratio by reversibility (thm).
Details in sec; here \(q\) is the number of distinct covariate patterns, \(p\) is the number of \(\beta\) parameters, and \(\ell_{\text{full}}\) is the saturated-model log-likelihood.
Deviance test (def) \[D \stackrel{\text{def}}{=}2(\ell_{\text{full}} - \ell(\hat{\beta}; \mathbf x)),
\qquad D \ \dot{\sim} \ \chi^2(q - p)\]
Hosmer-Lemeshow test (def; \(g\) groups by predicted probability) \[X^2 \stackrel{\text{def}}{=}\sum_{c=1}^g \frac{(o_c - e_c)^2}{e_c} \ \dot{\sim} \ \chi^2(g-2)\]
Pearson chi-squared GOF test (sum of squared Pearson residuals, def) \[X^2 = \sum_{k=1}^q X_k^2 \ \dot{\sim} \ \chi^2(q-p)\]
AIC and BIC [lower is better] (AIC[13]; BIC[14]) \[\text{AIC} = -2 \ell(\hat{\theta}) + 2p,
\qquad \text{BIC} = -2 \ell(\hat{\theta}) + p {\operatorname{log}\mathopen{}\left\{n\right\}\mathclose{}}\]
Likelihood ratio test (def; for nested models with \(p_0 < p_1\) parameters — here \(\ell_1\) and \(\ell_0\) are the two fitted models’ log-likelihoods, not the saturated model’s) \[\Lambda \stackrel{\text{def}}{=}2(\ell_1(\hat{\theta}_1) - \ell_0(\hat{\theta}_0)),
\qquad \Lambda \ \dot{\sim} \ \chi^2(p_1 - p_0) \text{ under } H_0\] by Wilks’ theorem.
Residual-based diagnostics
Residuals are computed per covariate pattern \(k\) (grouped data); \(h_k\) denotes the leverage of pattern \(k\) (def).
Observed marginal risk (def; standardization form by thm) \[\pi(a) \stackrel{\text{def}}{=}\Pr(Y = 1 \mid A = a) = {\mathbb{E}\mathopen{}\left[\pi(a, Z) \mid A = a\right]\mathclose{}}\]
Potential mean and causal marginal risk (def, def; identification form by thm) \[\mu_a \stackrel{\text{def}}{=}{\mathbb{E}\mathopen{}\left[Y^a\right]\mathclose{}},
\qquad \pi_a \stackrel{\text{def}}{=}\Pr(Y^a = 1) = {\mathbb{E}\mathopen{}\left[\pi(a, Z)\right]\mathclose{}}\]
No confounding: observed = causal (cor; the two estimands are contrasted in rem) \[Z \perp\!\!\!\perp A \implies \pi(a) = \pi_a\]
G-computation estimator (def; consistent for \(\pi_a\) by thm) \[\hat\pi_a \stackrel{\text{def}}{=}\frac{1}{n}\sum_{i=1}^n\hat\pi_{a,i},
\qquad \hat\pi_{a,i} \stackrel{\text{def}}{=}\hat\pi(a, z_i)\]
Predictive margins (def; full-sample form def is consistent for \(\pi_a\) by cor) \[\widehat{\text{PM}}(a \mid S) \stackrel{\text{def}}{=}\frac{1}{|S|} \sum_{i \in S} \hat\pi_{a,i},
\qquad \widehat{\text{PM}}(a) \stackrel{\text{def}}{=}\frac{1}{n}\sum_{i=1}^n\hat\pi_{a,i} = \hat\pi_a\]
Exposed-subgroup predictive margin (def; consistent for \(\pi(a)\) by thm; equals \(\bar Y_a\) exactly by lem) \[\hat\pi_a(a) \stackrel{\text{def}}{=}\frac{1}{n_a} \sum_{i : A_i = a} \hat\pi_{a,i} = \bar Y_a\]
Bootstrap SE and CI for marginal contrasts (def; see Bootstrap Confidence Intervals and exm): resample the data with replacement \(B\) times; refit the logistic model and recompute the marginal contrast on each resample; the bootstrap SE is the standard deviation of the \(B\) estimates, and a 95% percentile CI uses their 2.5th and 97.5th percentiles.
Collapsibility (def): an estimand \(\theta\) is collapsible with respect to \(Z\) if \[\theta \stackrel{\text{def}}{=}{\mathbb{E}\mathopen{}\left[\theta(Z)\right]\mathclose{}}\]Risk differences are collapsible; risk ratios and odds ratios are not collapsible in general (thm; counterexample in exm).
References
[1]
A. J. Dobson and A. G. Barnett, An introduction to generalized linear models, 4th ed. CRC press, 2018. Available: https://doi.org/10.1201/9781315182780
[2]
E. Vittinghoff, D. V. Glidden, S. C. Shiboski, and C. E. McCulloch, Regression methods in biostatistics: Linear, logistic, survival, and repeated measures models, 2nd ed. Springer, 2012. Available: https://doi.org/10.1007/978-1-4614-1353-0
J. Starmer, “StatQuest with JoshStarmer.” YouTube channel. Available: https://statquest.org/
[6]
R. McElreath, Statistical rethinking : A Bayesian course with examples in R and Stan, Second edition. in Chapman & hall/CRC texts in statistical science series. Boca Raton, FL: CRC Press, 2020.
C. I. Bliss, “The calculation of the dosage-mortality curve,”Annals of Applied Biology, vol. 22, no. 1, pp. 134–167, 1935, doi: 10.1111/j.1744-7348.1935.tb07713.x.
R. H. Rosenman, R. J. Brand, C. D. Jenkins, M. Friedman, R. Straus, and M. Wurm, “Coronary heart disease in the Western Collaborative Group Study: Final follow-up experience of 8 1/2 years,”JAMA, vol. 233, no. 8, pp. 872–877, 1975, doi: 10.1001/jama.1975.03260080034016.
[11]
D. W. Hosmer and S. Lemeshow, “Goodness of fit tests for the multiple logistic regression model,”Communications in Statistics — Theory and Methods, vol. 9, no. 10, pp. 1043–1069, 1980, Available: https://doi.org/10.1080/03610928008827941
H. Akaike, “A new look at the statistical model identification,”IEEE Transactions on Automatic Control, vol. 19, no. 6, pp. 716–723, 1974, Available: https://doi.org/10.1109/TAC.1974.1100705
[14]
G. Schwarz, “Estimating the dimension of a model,”The Annals of Statistics, vol. 6, no. 2, pp. 461–464, 1978, Available: https://doi.org/10.1214/aos/1176344136
[15]
D. Pregibon, “Logistic regression diagnostics,”The Annals of Statistics, vol. 9, no. 4, pp. 705–724, 1981, Available: https://doi.org/10.1214/aos/1176345513
[16]
D. L. Sackett, J. J. Deeks, and D. G. Altman, “Down with odds ratios!”BMJ Evidence-Based Medicine, vol. 1, no. 6, p. 164, 1996.
[17]
E. C. Norton, B. E. Dowd, M. M. Garrido, and M. L. Maciejewski, “Requiem for odds ratios,”Health Services Research, vol. 59, no. 4, p. e14337, 2024, doi: https://doi.org/10.1111/1475-6773.14337.
J. Robins, “A new approach to causal inference in mortality studies with a sustained exposure period—application to control of the healthy worker survivor effect,”Mathematical Modelling, vol. 7, no. 9–12, pp. 1393–1512, 1986, doi: 10.1016/0270-0255(86)90088-6.
B. I. Graubard and E. L. Korn, “Predictive margins with survey data,”Biometrics, vol. 55, no. 2, pp. 652–659, 1999, doi: 10.1111/j.0006-341X.1999.00652.x.
[22]
P. W. Lane and J. A. Nelder, “Analysis of covariance and standardization as instances of prediction,”Biometrics, vol. 38, no. 3, pp. 613–621, 1982, doi: 10.2307/2530043.
[23]
T. Hastie, R. Tibshirani, and J. Friedman, The elements of statistical learning: Data mining, inference, and prediction, 2nd ed. Springer, 2009. doi: 10.1007/978-0-387-84858-7.
[24]
G. James, D. Witten, T. Hastie, and R. Tibshirani, An introduction to statistical learning: With applications in R, 2nd ed. Springer, 2021. doi: 10.1007/978-1-0716-1418-1.
[25]
B. Efron, “Bootstrap methods: Another look at the jackknife,”The Annals of Statistics, vol. 7, no. 1, pp. 1–26, 1979, Available: https://doi.org/10.1214/aos/1176344552
[26]
B. Efron and R. J. Tibshirani, An introduction to the bootstrap. in Monographs on statistics and applied probability, no. 57. New York: Chapman & Hall/CRC, 1993. Available: https://doi.org/10.1201/9780429246593
[27]
S. Greenland, J. M. Robins, and J. Pearl, “Confounding and collapsibility in causal inference,”Statistical Science, vol. 14, no. 1, pp. 29–46, 1999, Available: https://doi.org/10.1214/ss/1009211805
[28]
S. Greenland and J. M. Robins, “Identifiability, exchangeability, and epidemiological confounding,”International Journal of Epidemiology, vol. 15, no. 3, pp. 413–419, 1986, Available: https://doi.org/10.1093/ije/15.3.413
[29]
A. C. Davison and D. V. Hinkley, Bootstrap methods and their application. in Cambridge series in statistical and probabilistic mathematics, no. 1. Cambridge: Cambridge University Press, 1997. Available: https://doi.org/10.1017/CBO9780511802843