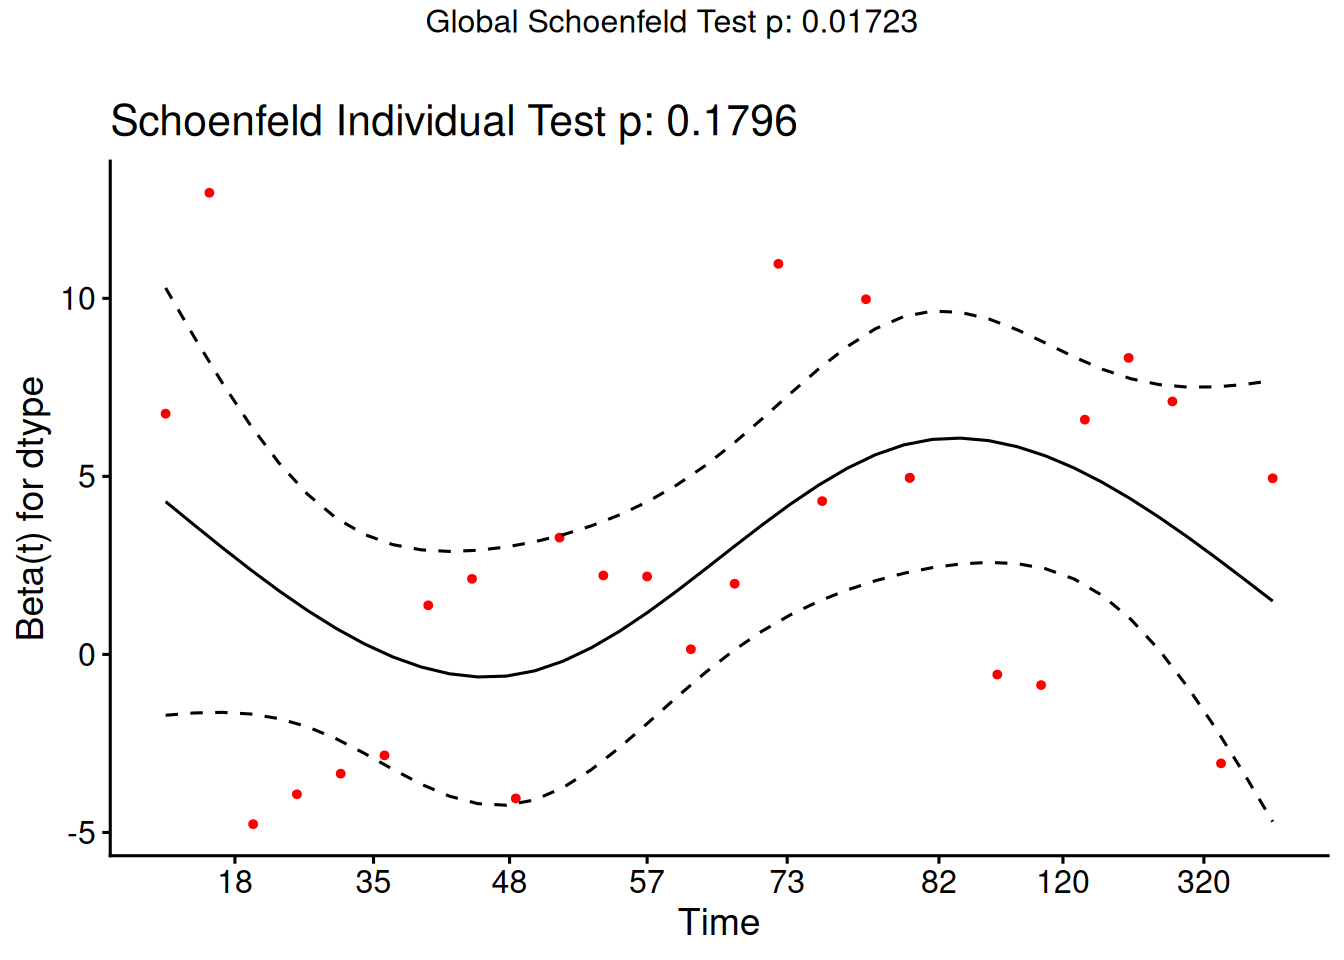
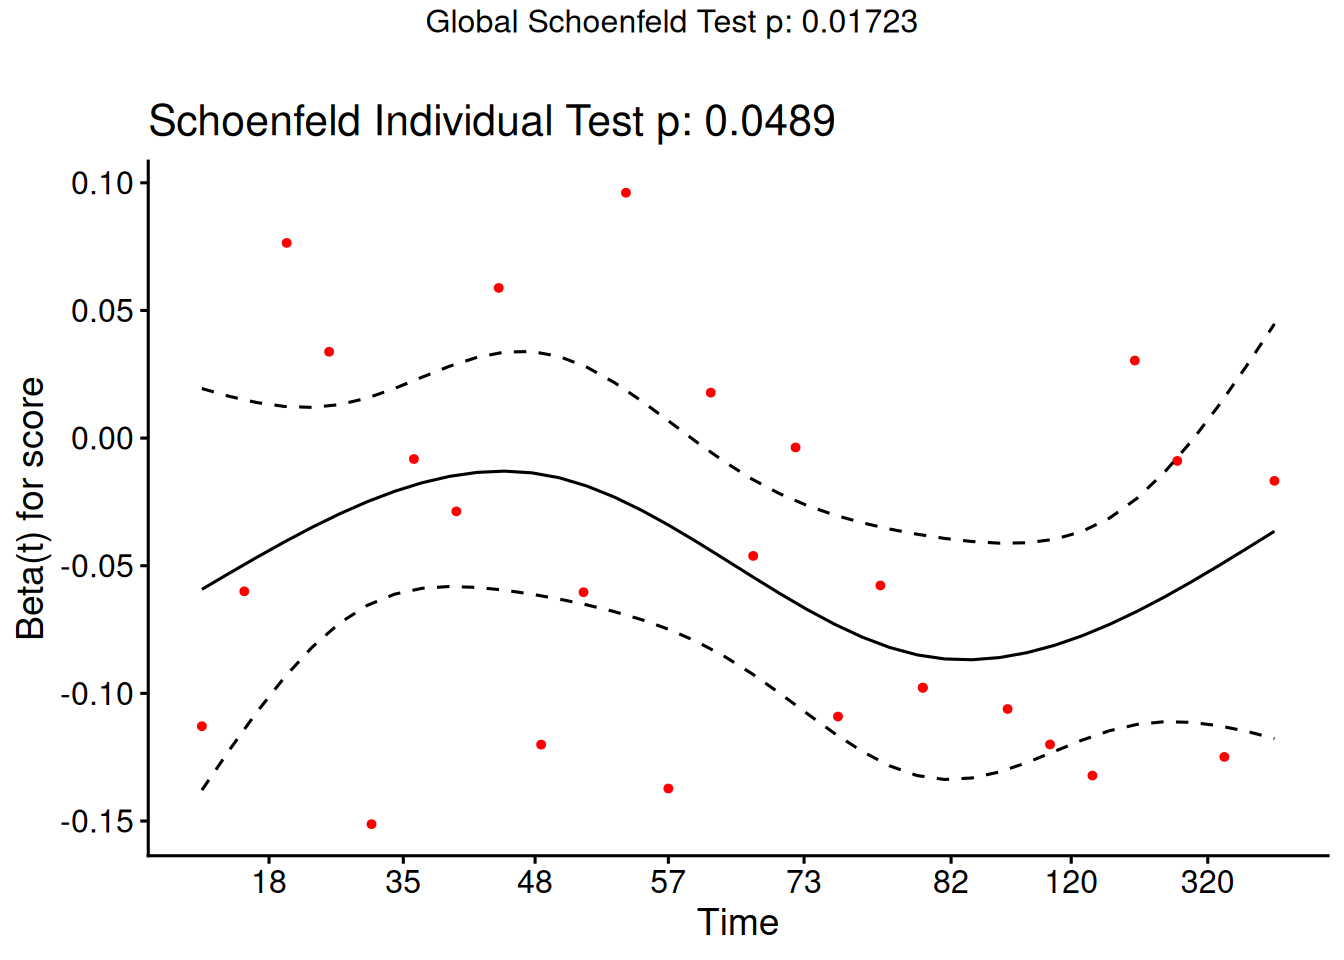
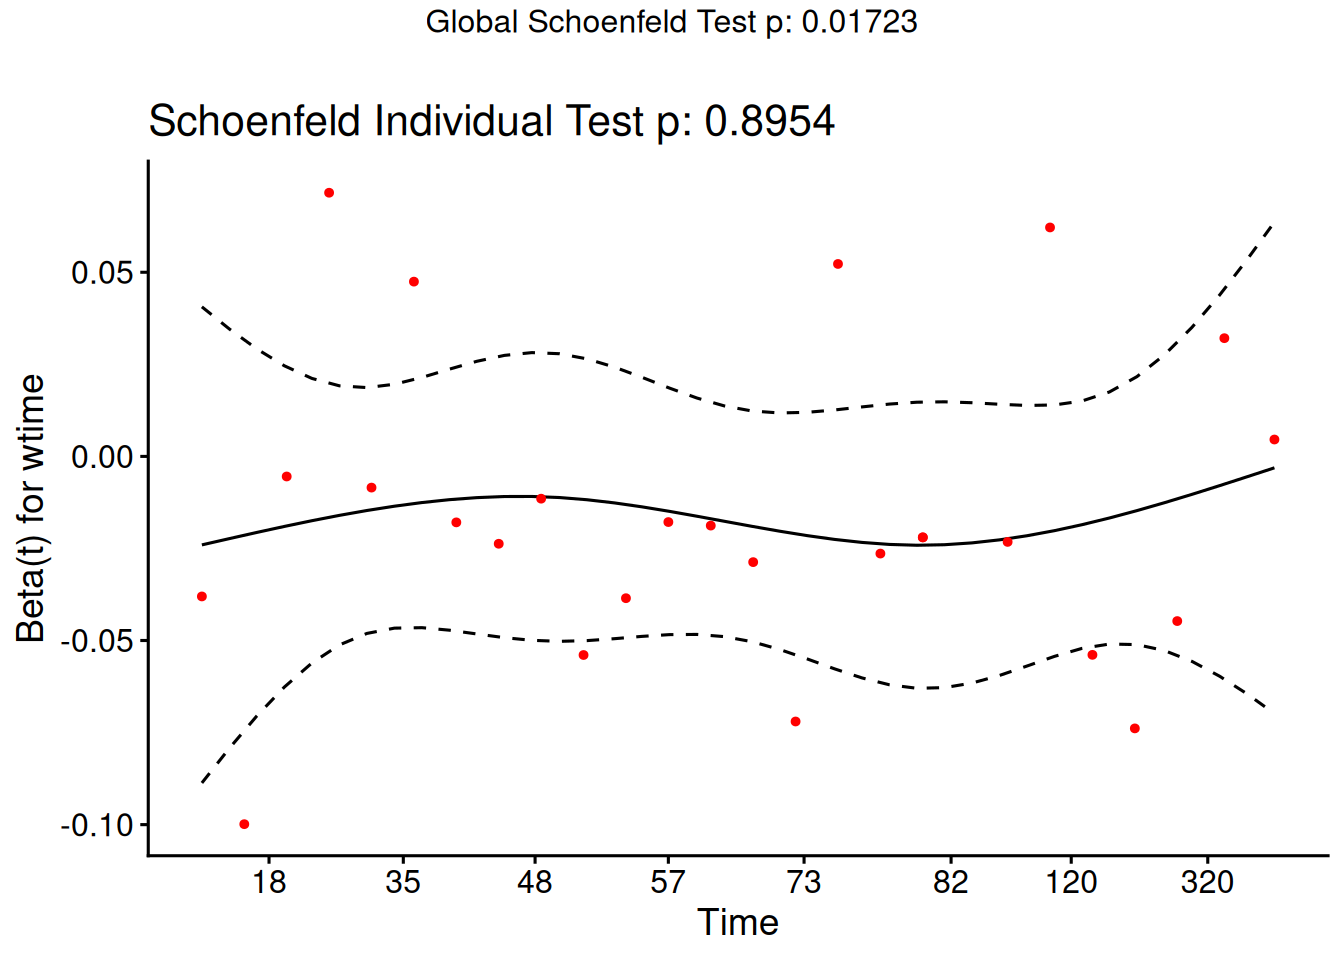
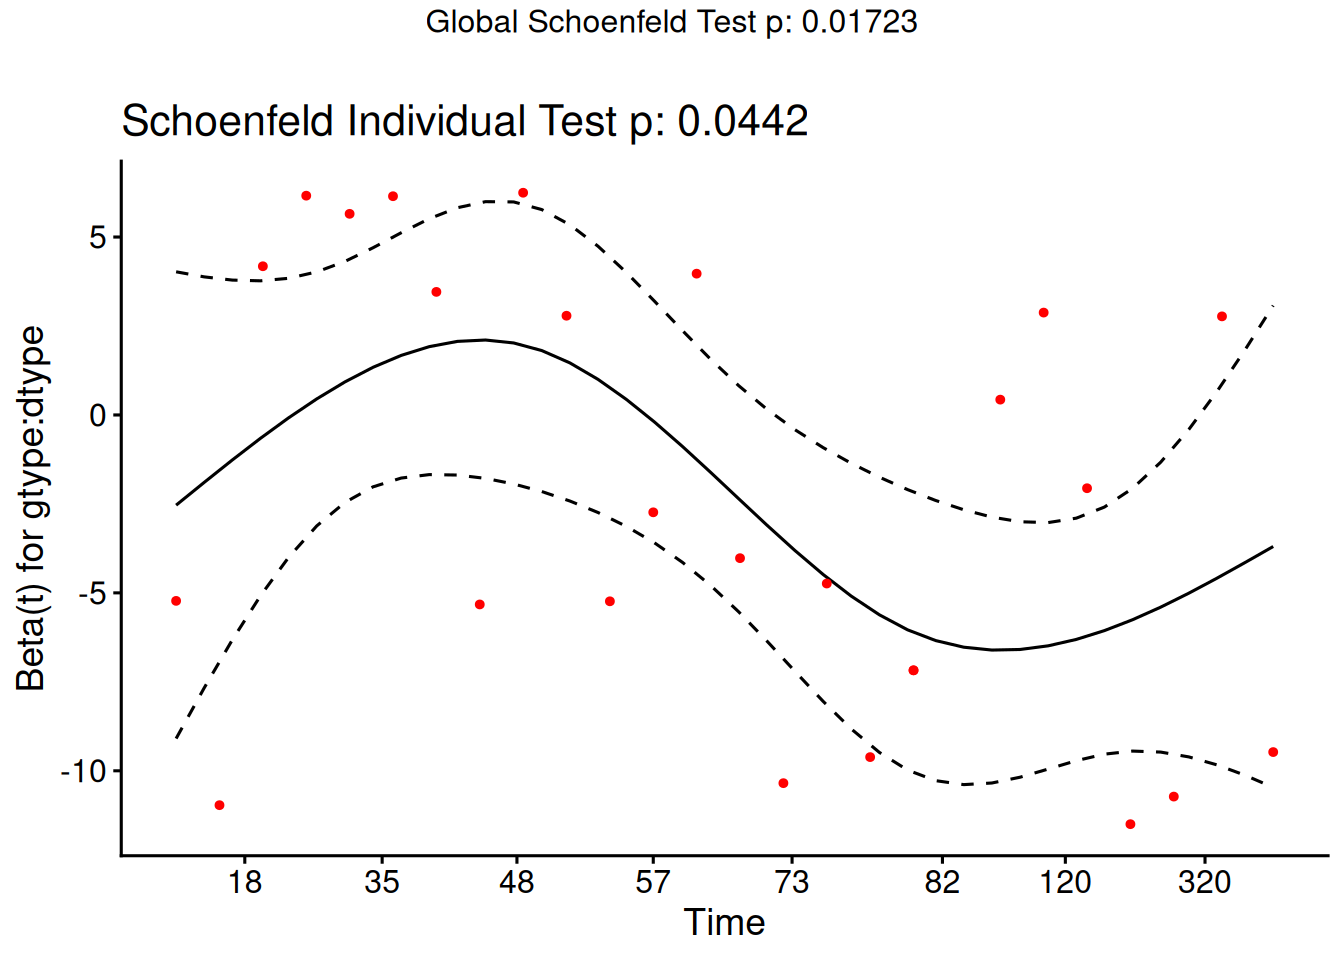
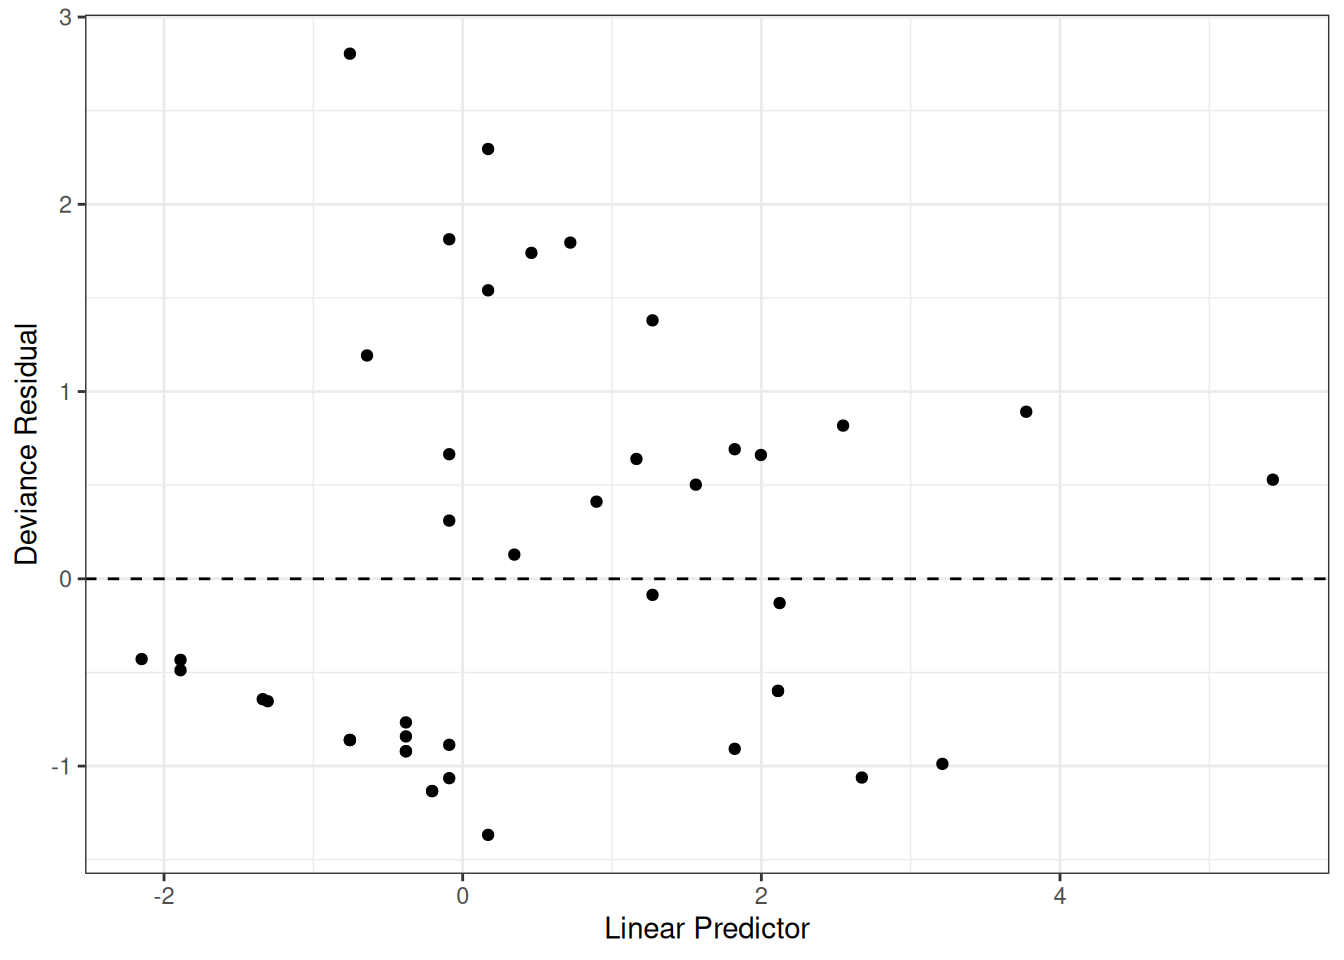
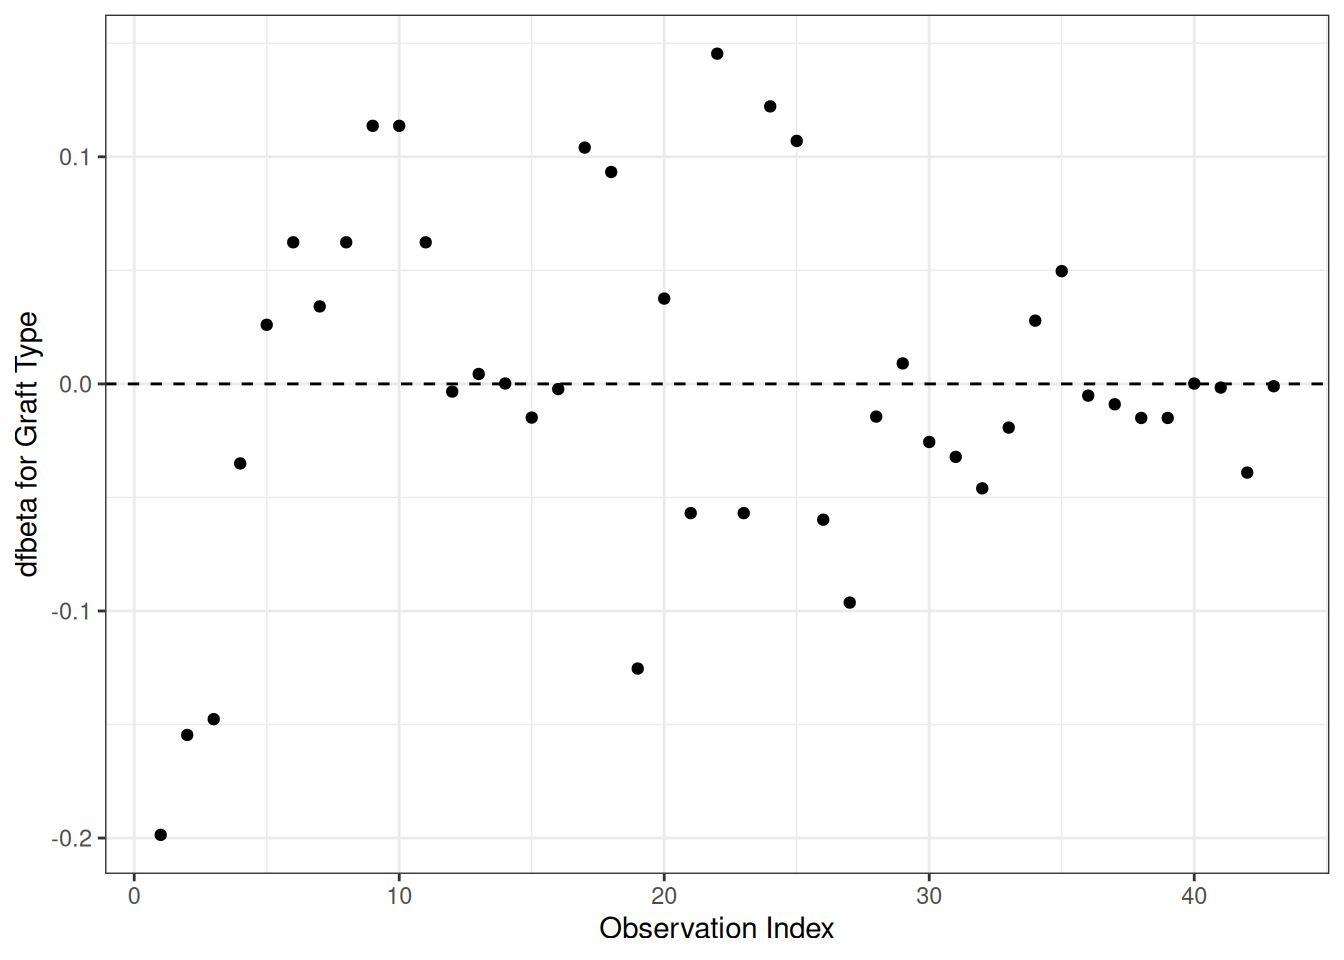
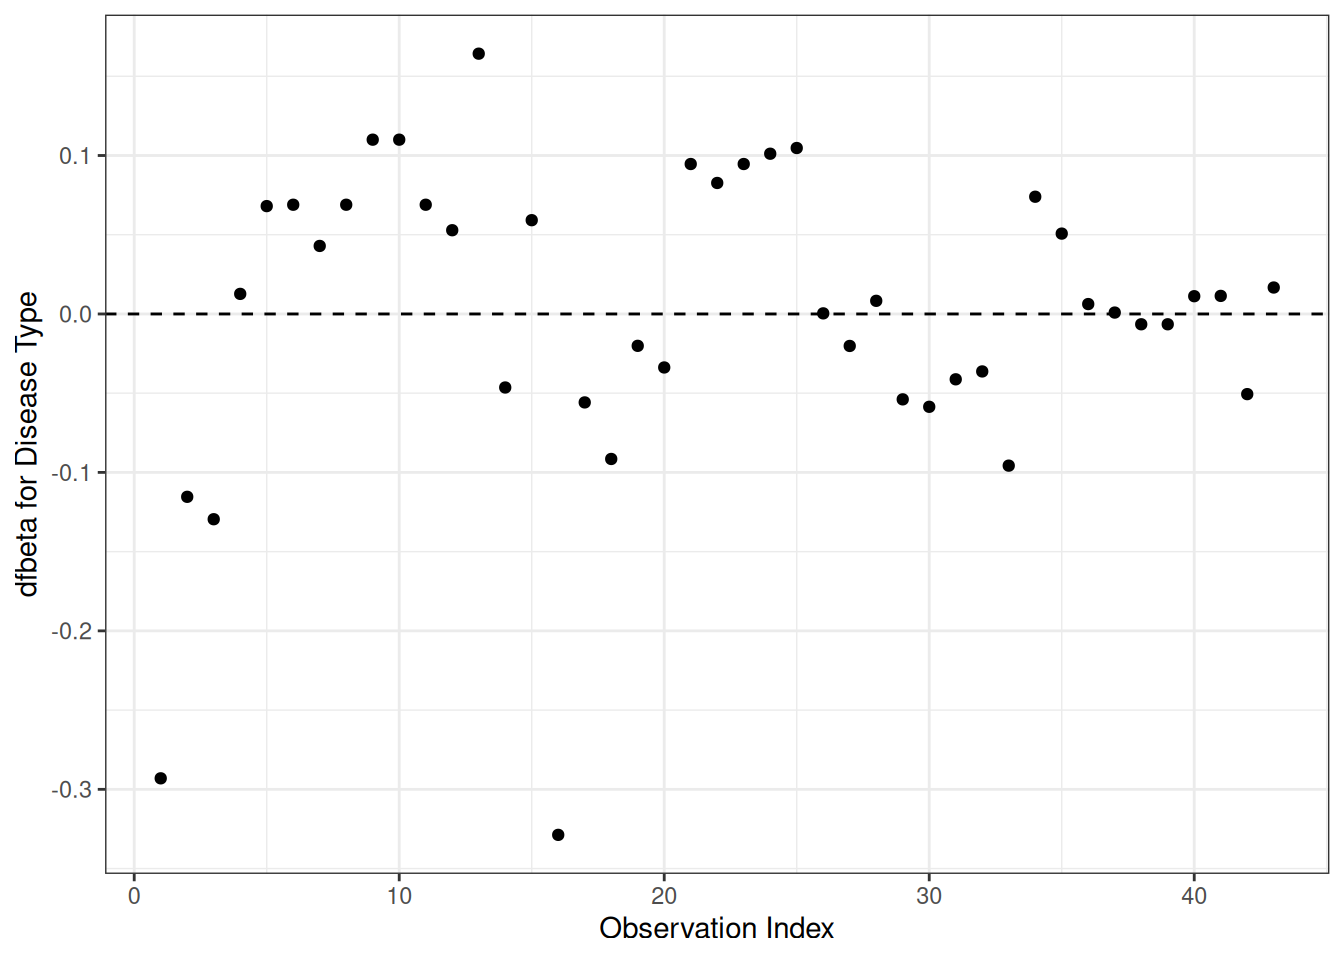
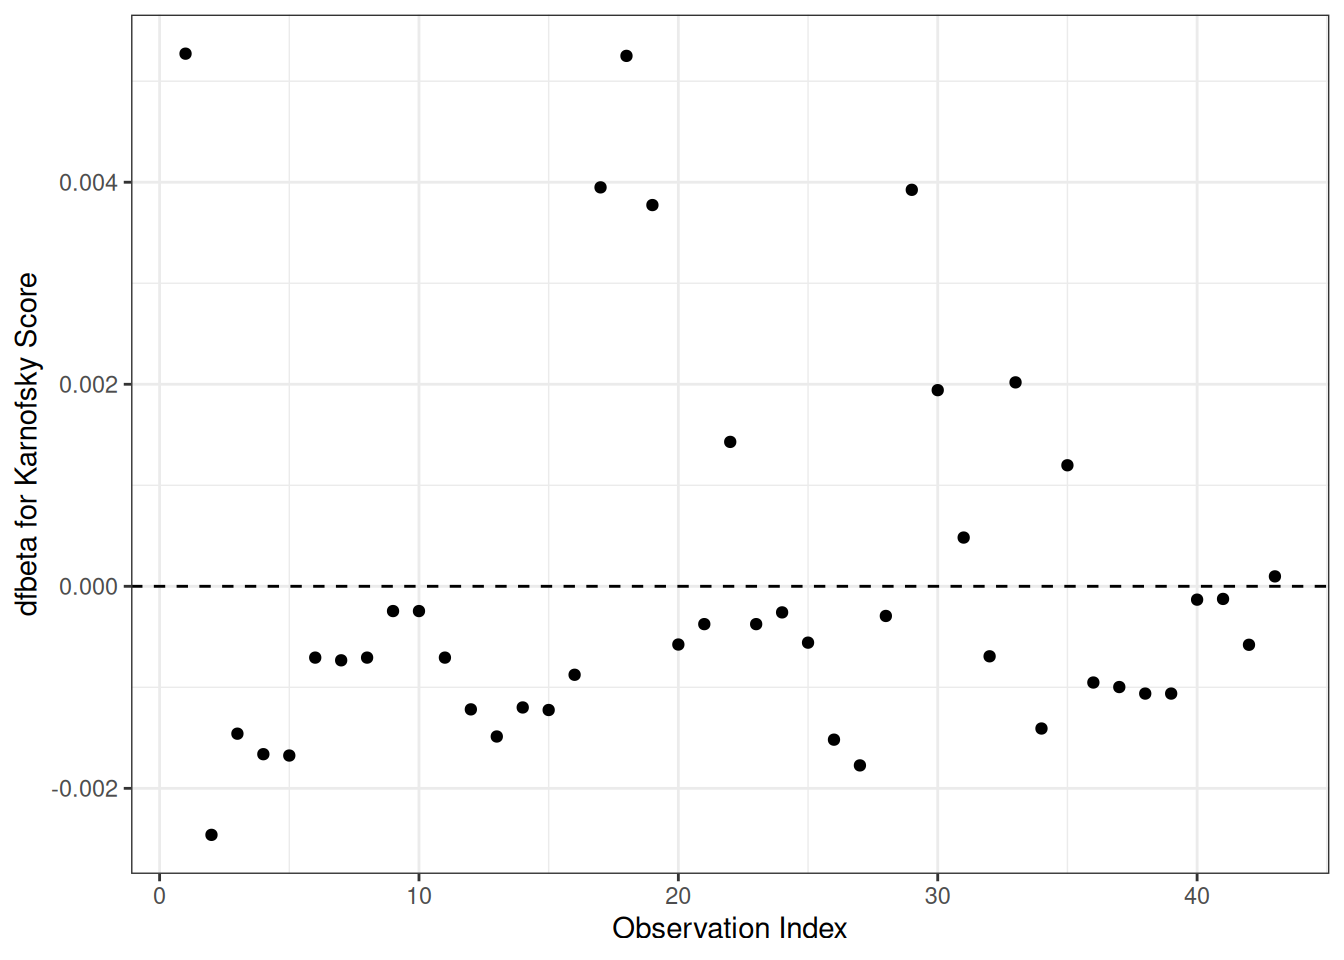
Functions from these packages will be used throughout this document:
[R code]
library(conflicted) # check for conflicting function definitions# printr is not loaded here: it inserts help-file output into markdown outputlibrary(rmarkdown) # Convert R Markdown documents into a variety of formats.library(pander) # format tables for markdownlibrary(ggplot2) # graphicslibrary(ggfortify) # help with graphicslibrary(dplyr) # manipulate datalibrary(tibble) # `tibble`s extend `data.frame`slibrary(magrittr) # `%>%` and other additional piping toolslibrary(haven) # import Stata fileslibrary(knitr) # format R output for markdownlibrary(tidyr) # Tools to help to create tidy datalibrary(plotly) # interactive graphicslibrary(dobson) # datasets from Dobson and Barnett 2018library(parameters) # format model output tables for markdownlibrary(haven) # import Stata fileslibrary(latex2exp) # use LaTeX in R code (for figures and tables)library(fs) # filesystem path manipulationslibrary(survival) # survival analysislibrary(survminer) # survival analysis graphicslibrary(KMsurv) # datasets from Klein and Moeschbergerlibrary(parameters) # format model output tables forlibrary(webshot2) # convert interactive content to static for pdflibrary(forcats) # functions for categorical variables ("factors")library(stringr) # functions for dealing with stringslibrary(lubridate) # functions for dealing with dates and times# Summarizes key information about statistical objects in tidy tibbleslibrary(broom)# Provides suite of functions to work with regression model# `broom::tidy()` tibbleslibrary(broom.helpers)
Here are some R settings I use in this document:
[R code]
rm(list =ls()) # delete any data that's already loaded into Rconflicts_prefer(dplyr::filter)ggplot2::theme_set( ggplot2::theme_bw() +# ggplot2::labs(col = "") + ggplot2::theme(legend.position ="bottom",text = ggplot2::element_text(size =12, family ="serif") ))knitr::opts_chunk$set(message =FALSE)options(digits =6)panderOptions("big.mark", ",")pander::panderOptions("table.emphasize.rownames", FALSE)pander::panderOptions("table.split.table", Inf)# use the `filter()` function from dplyr() by defaultconflicts_prefer(dplyr::filter)legend_text_size <-9run_graphs <-TRUE
Theorem 1 (Survival function of the exponential distribution) If \(T\) has an exponential distribution with rate \(\lambda > 0\), then for \(t \ge 0\):
Example 1 (Survival probability of an exponential time) Suppose an event time \(T\) is exponential with rate \(\lambda = 0.1\) events per year. By Theorem 1, the probability of surviving past 5 years is \(\operatorname{S}(5) = e^{-\lambda \cdot 5}\). The code below computes this value from the formula and from R’s exponential distribution function:
Example 2 (Hazard of an exponential time at several times) Suppose an event time \(T\) is exponential with rate \(\lambda = 0.1\) events per year. The hazard is the density divided by the survival function. The code below computes it at three times:
The hazards at 1, 5 and 20 years are 0.1, 0.1, 0.1, all equal to \(\lambda =\) 0.1, as Theorem 2 states.
2 Understanding proportional hazards models
Video lecture
David Rocke’s Epi 204 lecture Survival Regression with the Cox Model I (slides) builds from Kaplan-Meier and Nelson-Aalen estimates for the bmt data to the Cox proportional hazards model and its partial likelihood [1].
Definition 1 (conditional hazard) The conditional hazard of outcome\(T\) at value \(t\), given covariate vector\(\mathord{\smash[b]{\underset{\raise.3ex\hbox{$\scriptstyle\sim$}}{x}}\vphantom{x}}\), is the conditional density of the event\(T=t\), given \(T \ge t\) and \(\mathord{\smash[b]{\underset{\raise.3ex\hbox{$\scriptstyle\sim$}}{X}}\vphantom{X}}= \mathord{\smash[b]{\underset{\raise.3ex\hbox{$\scriptstyle\sim$}}{x}}\vphantom{x}}\):
Definition 4 (Baseline survival function) The baseline survival function is the survival function for an individual whose covariates are all equal to their default values.
Proof. \[
\begin{aligned}
{\operatorname{exp}\mathopen{}\left\{\eta(t|\mathord{\smash[b]{\underset{\raise.3ex\hbox{$\scriptstyle\sim$}}{x}}\vphantom{x}})\right\}\mathclose{}}
&\stackrel{\text{def}}{=}{\operatorname{exp}\mathopen{}\left\{{\operatorname{log}\mathopen{}\left\{{\lambda}(t|\mathord{\smash[b]{\underset{\raise.3ex\hbox{$\scriptstyle\sim$}}{x}}\vphantom{x}})\right\}\mathclose{}}\right\}\mathclose{}} && \text{(definition of log-hazard)} \\
&= {\lambda}(t|\mathord{\smash[b]{\underset{\raise.3ex\hbox{$\scriptstyle\sim$}}{x}}\vphantom{x}}) && \text{(the exponential function inverts the logarithm)}
\end{aligned}
\tag{4}\]
Definition 8 (difference in log-hazards) The difference in log-hazards between covariate patterns \(\mathord{\smash[b]{\underset{\raise.3ex\hbox{$\scriptstyle\sim$}}{x}}\vphantom{x}}\) and \(\mathord{{\mathord{\smash[b]{\underset{\raise.3ex\hbox{$\scriptstyle\sim$}}{x}}\vphantom{x}}^*}}\) at time \(t\) is:
Theorem 4 (Difference of log-hazards vs hazard ratio) If \(\Delta\eta(t|\mathord{\smash[b]{\underset{\raise.3ex\hbox{$\scriptstyle\sim$}}{x}}\vphantom{x}}: \mathord{{\mathord{\smash[b]{\underset{\raise.3ex\hbox{$\scriptstyle\sim$}}{x}}\vphantom{x}}^*}})\) is the difference in log-hazard between covariate patterns \(\mathord{\smash[b]{\underset{\raise.3ex\hbox{$\scriptstyle\sim$}}{x}}\vphantom{x}}\) and \(\mathord{{\mathord{\smash[b]{\underset{\raise.3ex\hbox{$\scriptstyle\sim$}}{x}}\vphantom{x}}^*}}\) at time \(t\), and \(\text{ϙ}_{{\lambda}}(t| \mathord{\smash[b]{\underset{\raise.3ex\hbox{$\scriptstyle\sim$}}{x}}\vphantom{x}}: \mathord{{\mathord{\smash[b]{\underset{\raise.3ex\hbox{$\scriptstyle\sim$}}{x}}\vphantom{x}}^*}})\) is corresponding hazard ratio, then:
\[
\begin{aligned}
\Delta\eta(t|\mathord{\smash[b]{\underset{\raise.3ex\hbox{$\scriptstyle\sim$}}{x}}\vphantom{x}}: \mathord{{\mathord{\smash[b]{\underset{\raise.3ex\hbox{$\scriptstyle\sim$}}{x}}\vphantom{x}}^*}})
&\stackrel{\text{def}}{=}\eta(t|\mathord{\smash[b]{\underset{\raise.3ex\hbox{$\scriptstyle\sim$}}{x}}\vphantom{x}}) - \eta(t|\mathord{{\mathord{\smash[b]{\underset{\raise.3ex\hbox{$\scriptstyle\sim$}}{x}}\vphantom{x}}^*}}) && \text{(definition of log-hazard difference)}
\\
&\stackrel{\text{def}}{=}{\operatorname{log}\mathopen{}\left\{{\lambda}(t|\mathord{\smash[b]{\underset{\raise.3ex\hbox{$\scriptstyle\sim$}}{x}}\vphantom{x}})\right\}\mathclose{}} - {\operatorname{log}\mathopen{}\left\{{\lambda}(t|\mathord{{\mathord{\smash[b]{\underset{\raise.3ex\hbox{$\scriptstyle\sim$}}{x}}\vphantom{x}}^*}})\right\}\mathclose{}} && \text{(definition of log-hazard)}
\\
&= {\operatorname{log}\mathopen{}\left\{\frac{{\lambda}(t|\mathord{\smash[b]{\underset{\raise.3ex\hbox{$\scriptstyle\sim$}}{x}}\vphantom{x}})}{{\lambda}(t|\mathord{{\mathord{\smash[b]{\underset{\raise.3ex\hbox{$\scriptstyle\sim$}}{x}}\vphantom{x}}^*}})}\right\}\mathclose{}} && \text{(difference of logarithms rule)}
\\
&\stackrel{\text{def}}{=}{\operatorname{log}\mathopen{}\left\{\text{ϙ}_{{\lambda}}(t| \mathord{\smash[b]{\underset{\raise.3ex\hbox{$\scriptstyle\sim$}}{x}}\vphantom{x}}: \mathord{{\mathord{\smash[b]{\underset{\raise.3ex\hbox{$\scriptstyle\sim$}}{x}}\vphantom{x}}^*}})\right\}\mathclose{}} && \text{(definition of hazard ratio)}
\end{aligned}
\tag{5}\]
Corollary 1 (Hazard ratio vs difference of log-hazards)\[\text{ϙ}_{{\lambda}}(t| \mathord{\smash[b]{\underset{\raise.3ex\hbox{$\scriptstyle\sim$}}{x}}\vphantom{x}}: \mathord{{\mathord{\smash[b]{\underset{\raise.3ex\hbox{$\scriptstyle\sim$}}{x}}\vphantom{x}}^*}}) = {\operatorname{exp}\mathopen{}\left\{\Delta\eta(t|\mathord{\smash[b]{\underset{\raise.3ex\hbox{$\scriptstyle\sim$}}{x}}\vphantom{x}}: \mathord{{\mathord{\smash[b]{\underset{\raise.3ex\hbox{$\scriptstyle\sim$}}{x}}\vphantom{x}}^*}})\right\}\mathclose{}}\]
Proof. \[
\begin{aligned}
\eta(t|\mathord{\smash[b]{\underset{\raise.3ex\hbox{$\scriptstyle\sim$}}{x}}\vphantom{x}})
&= \eta(t|\mathord{\smash[b]{\underset{\raise.3ex\hbox{$\scriptstyle\sim$}}{0}}\vphantom{0}}) + \eta(t|\mathord{\smash[b]{\underset{\raise.3ex\hbox{$\scriptstyle\sim$}}{x}}\vphantom{x}}) - \eta(t|\mathord{\smash[b]{\underset{\raise.3ex\hbox{$\scriptstyle\sim$}}{0}}\vphantom{0}}) && \text{(adding and subtracting } \eta(t|\mathord{\smash[b]{\underset{\raise.3ex\hbox{$\scriptstyle\sim$}}{0}}\vphantom{0}})\text{)} \\
&\stackrel{\text{def}}{=}\eta_0(t) + \eta(t|\mathord{\smash[b]{\underset{\raise.3ex\hbox{$\scriptstyle\sim$}}{x}}\vphantom{x}}) - \eta(t|\mathord{\smash[b]{\underset{\raise.3ex\hbox{$\scriptstyle\sim$}}{0}}\vphantom{0}}) && \text{(definition of baseline log-hazard)} \\
&\stackrel{\text{def}}{=}\eta_0(t) + \Delta\eta(t|\mathord{\smash[b]{\underset{\raise.3ex\hbox{$\scriptstyle\sim$}}{x}}\vphantom{x}}: \mathord{\smash[b]{\underset{\raise.3ex\hbox{$\scriptstyle\sim$}}{0}}\vphantom{0}}) && \text{(definition of difference in log-hazards)} \\
&\stackrel{\text{def}}{=}\eta_0(t) + \Delta\eta(t|\mathord{\smash[b]{\underset{\raise.3ex\hbox{$\scriptstyle\sim$}}{x}}\vphantom{x}}) && \text{(definition of difference in log-hazard from baseline)}
\end{aligned}
\tag{7}\]
Definition 10 (Hazard ratio versus baseline)\[\theta_{{\lambda}}(t|\mathord{\smash[b]{\underset{\raise.3ex\hbox{$\scriptstyle\sim$}}{x}}\vphantom{x}}) \stackrel{\text{def}}{=}\text{ϙ}_{{\lambda}}(t| \mathord{\smash[b]{\underset{\raise.3ex\hbox{$\scriptstyle\sim$}}{x}}\vphantom{x}}: \mathord{\smash[b]{\underset{\raise.3ex\hbox{$\scriptstyle\sim$}}{0}}\vphantom{0}}) \tag{8}\]
Corollary 2 (Hazard factor from difference of log-hazard from baseline)\[\theta_{{\lambda}}(t|\mathord{\smash[b]{\underset{\raise.3ex\hbox{$\scriptstyle\sim$}}{x}}\vphantom{x}})= {\operatorname{exp}\mathopen{}\left\{\Delta\eta(t|\mathord{\smash[b]{\underset{\raise.3ex\hbox{$\scriptstyle\sim$}}{x}}\vphantom{x}})\right\}\mathclose{}}\]
\[
\begin{aligned}
\theta_{{\lambda}}(t|\mathord{\smash[b]{\underset{\raise.3ex\hbox{$\scriptstyle\sim$}}{x}}\vphantom{x}})
&\stackrel{\text{def}}{=}\text{ϙ}_{{\lambda}}(t| \mathord{\smash[b]{\underset{\raise.3ex\hbox{$\scriptstyle\sim$}}{x}}\vphantom{x}}: \mathord{\smash[b]{\underset{\raise.3ex\hbox{$\scriptstyle\sim$}}{0}}\vphantom{0}}) && \text{(definition of hazard factor)}
\\
&= {\operatorname{exp}\mathopen{}\left\{\Delta\eta(t|\mathord{\smash[b]{\underset{\raise.3ex\hbox{$\scriptstyle\sim$}}{x}}\vphantom{x}}: \mathord{\smash[b]{\underset{\raise.3ex\hbox{$\scriptstyle\sim$}}{0}}\vphantom{0}})\right\}\mathclose{}} && \text{(applying the hazard-ratio corollary with } \mathord{{\mathord{\smash[b]{\underset{\raise.3ex\hbox{$\scriptstyle\sim$}}{x}}\vphantom{x}}^*}}= \mathord{\smash[b]{\underset{\raise.3ex\hbox{$\scriptstyle\sim$}}{0}}\vphantom{0}}\text{)}
\\
&\stackrel{\text{def}}{=}{\operatorname{exp}\mathopen{}\left\{\Delta\eta(t|\mathord{\smash[b]{\underset{\raise.3ex\hbox{$\scriptstyle\sim$}}{x}}\vphantom{x}})\right\}\mathclose{}} && \text{(shorthand notation for log-hazard difference from baseline)}
\end{aligned}
\tag{9}\]
Corollary 3 (Difference of log-hazard from baseline equals log of the hazard factor)\[\Delta\eta(t|\mathord{\smash[b]{\underset{\raise.3ex\hbox{$\scriptstyle\sim$}}{x}}\vphantom{x}}) = {\operatorname{log}\mathopen{}\left\{\theta_{{\lambda}}(t| \mathord{\smash[b]{\underset{\raise.3ex\hbox{$\scriptstyle\sim$}}{x}}\vphantom{x}})\right\}\mathclose{}}\]
Lemma 2 (Difference of log-hazards between two covariate patterns) If \(\eta(t|\mathord{\smash[b]{\underset{\raise.3ex\hbox{$\scriptstyle\sim$}}{x}}\vphantom{x}}) = \eta_0(t) + \mathord{\smash[b]{\underset{\raise.3ex\hbox{$\scriptstyle\sim$}}{x}}\vphantom{x}}\cdot \mathord{\smash[b]{\underset{\raise.3ex\hbox{$\scriptstyle\sim$}}{\beta}}\vphantom{\beta}}\), then:
Theorem 6 (Hazard ratio under proportional hazards) If \(\eta(t|\mathord{\smash[b]{\underset{\raise.3ex\hbox{$\scriptstyle\sim$}}{x}}\vphantom{x}}) = \eta_0(t) + \mathord{\smash[b]{\underset{\raise.3ex\hbox{$\scriptstyle\sim$}}{x}}\vphantom{x}}\cdot \mathord{\smash[b]{\underset{\raise.3ex\hbox{$\scriptstyle\sim$}}{\beta}}\vphantom{\beta}}\), then:
where \(\Delta\mathord{\smash[b]{\underset{\raise.3ex\hbox{$\scriptstyle\sim$}}{x}}\vphantom{x}}\stackrel{\text{def}}{=}\mathord{\smash[b]{\underset{\raise.3ex\hbox{$\scriptstyle\sim$}}{x}}\vphantom{x}}- \mathord{{\mathord{\smash[b]{\underset{\raise.3ex\hbox{$\scriptstyle\sim$}}{x}}\vphantom{x}}^*}}\) is the difference in covariate vectors.
Expanding the definition of \(\text{ϙ}_{{\lambda}}\), the first equality writes the ratio as the exponential of a difference of logarithms; the second applies the definition of \(\Delta\eta\) as that difference; the third is Lemma 2; and the last substitutes \(\Delta\mathord{\smash[b]{\underset{\raise.3ex\hbox{$\scriptstyle\sim$}}{x}}\vphantom{x}}\) for \(\mathord{\smash[b]{\underset{\raise.3ex\hbox{$\scriptstyle\sim$}}{x}}\vphantom{x}}- \mathord{{\mathord{\smash[b]{\underset{\raise.3ex\hbox{$\scriptstyle\sim$}}{x}}\vphantom{x}}^*}}\).
Lemma 3 (Difference of log-hazard from baseline)\[\Delta\eta(t|\mathord{\smash[b]{\underset{\raise.3ex\hbox{$\scriptstyle\sim$}}{x}}\vphantom{x}})= \mathord{\smash[b]{\underset{\raise.3ex\hbox{$\scriptstyle\sim$}}{x}}\vphantom{x}}\cdot \mathord{\smash[b]{\underset{\raise.3ex\hbox{$\scriptstyle\sim$}}{\beta}}\vphantom{\beta}} \tag{18}\]
\[
\begin{aligned}
\Delta\eta(t|\mathord{\smash[b]{\underset{\raise.3ex\hbox{$\scriptstyle\sim$}}{x}}\vphantom{x}})
&\stackrel{\text{def}}{=}\Delta\eta(t|\mathord{\smash[b]{\underset{\raise.3ex\hbox{$\scriptstyle\sim$}}{x}}\vphantom{x}}: \mathord{\smash[b]{\underset{\raise.3ex\hbox{$\scriptstyle\sim$}}{0}}\vphantom{0}}) && \text{(definition of difference from baseline)} \\
&= (\mathord{\smash[b]{\underset{\raise.3ex\hbox{$\scriptstyle\sim$}}{x}}\vphantom{x}}- \mathord{\smash[b]{\underset{\raise.3ex\hbox{$\scriptstyle\sim$}}{0}}\vphantom{0}}) \cdot \mathord{\smash[b]{\underset{\raise.3ex\hbox{$\scriptstyle\sim$}}{\beta}}\vphantom{\beta}}&& \text{(applying the PH log-hazard-difference lemma with } \mathord{{\mathord{\smash[b]{\underset{\raise.3ex\hbox{$\scriptstyle\sim$}}{x}}\vphantom{x}}^*}}= \mathord{\smash[b]{\underset{\raise.3ex\hbox{$\scriptstyle\sim$}}{0}}\vphantom{0}}\text{)} \\
&= \mathord{\smash[b]{\underset{\raise.3ex\hbox{$\scriptstyle\sim$}}{x}}\vphantom{x}}\cdot \mathord{\smash[b]{\underset{\raise.3ex\hbox{$\scriptstyle\sim$}}{\beta}}\vphantom{\beta}}&& \text{(evaluating vector difference)}
\end{aligned}
\tag{19}\]
Theorem 7 (Hazard ratio versus baseline under proportional hazards) If \(\eta(t|\mathord{\smash[b]{\underset{\raise.3ex\hbox{$\scriptstyle\sim$}}{x}}\vphantom{x}}) = \eta_0(t) + \mathord{\smash[b]{\underset{\raise.3ex\hbox{$\scriptstyle\sim$}}{x}}\vphantom{x}}\cdot \mathord{\smash[b]{\underset{\raise.3ex\hbox{$\scriptstyle\sim$}}{\beta}}\vphantom{\beta}}\), then:
\[
\begin{aligned}
\theta_{{\lambda}}(t|\mathord{\smash[b]{\underset{\raise.3ex\hbox{$\scriptstyle\sim$}}{x}}\vphantom{x}})
&\stackrel{\text{def}}{=}\text{ϙ}_{{\lambda}}(t| \mathord{\smash[b]{\underset{\raise.3ex\hbox{$\scriptstyle\sim$}}{x}}\vphantom{x}}: \mathord{\smash[b]{\underset{\raise.3ex\hbox{$\scriptstyle\sim$}}{0}}\vphantom{0}}) && \text{(definition of hazard factor)}
\\
&= {\operatorname{exp}\mathopen{}\left\{\Delta\eta(t|\mathord{\smash[b]{\underset{\raise.3ex\hbox{$\scriptstyle\sim$}}{x}}\vphantom{x}})\right\}\mathclose{}} && \text{(applying the hazard-factor corollary)}
\\
&= {\operatorname{exp}\mathopen{}\left\{\mathord{\smash[b]{\underset{\raise.3ex\hbox{$\scriptstyle\sim$}}{x}}\vphantom{x}}\cdot \mathord{\smash[b]{\underset{\raise.3ex\hbox{$\scriptstyle\sim$}}{\beta}}\vphantom{\beta}}\right\}\mathclose{}} && \text{(substituting the log-hazard difference from baseline)}
\end{aligned}
\tag{20}\]
Theorem 8 (Proportional-hazards decomposition of the hazard)\[{\lambda}(t|\mathord{\smash[b]{\underset{\raise.3ex\hbox{$\scriptstyle\sim$}}{x}}\vphantom{x}}) = {\lambda}_0(t)\theta_{{\lambda}}(\mathord{\smash[b]{\underset{\raise.3ex\hbox{$\scriptstyle\sim$}}{x}}\vphantom{x}})\]
\[
\begin{aligned}
{\lambda}(t|\mathord{\smash[b]{\underset{\raise.3ex\hbox{$\scriptstyle\sim$}}{x}}\vphantom{x}})
&= {\operatorname{exp}\mathopen{}\left\{\eta(t|\mathord{\smash[b]{\underset{\raise.3ex\hbox{$\scriptstyle\sim$}}{x}}\vphantom{x}})\right\}\mathclose{}} && \text{(relationship between hazard and log-hazard)} \\
&= {\operatorname{exp}\mathopen{}\left\{\eta_0(t) + \mathord{\smash[b]{\underset{\raise.3ex\hbox{$\scriptstyle\sim$}}{x}}\vphantom{x}}\cdot \mathord{\smash[b]{\underset{\raise.3ex\hbox{$\scriptstyle\sim$}}{\beta}}\vphantom{\beta}}\right\}\mathclose{}} && \text{(substituting proportional hazards model)} \\
&= {\operatorname{exp}\mathopen{}\left\{\eta_0(t)\right\}\mathclose{}} \cdot {\operatorname{exp}\mathopen{}\left\{\mathord{\smash[b]{\underset{\raise.3ex\hbox{$\scriptstyle\sim$}}{x}}\vphantom{x}}\cdot \mathord{\smash[b]{\underset{\raise.3ex\hbox{$\scriptstyle\sim$}}{\beta}}\vphantom{\beta}}\right\}\mathclose{}} && \text{(exponent rule for sums)} \\
&= {\lambda}_0(t) \cdot {\operatorname{exp}\mathopen{}\left\{\mathord{\smash[b]{\underset{\raise.3ex\hbox{$\scriptstyle\sim$}}{x}}\vphantom{x}}\cdot \mathord{\smash[b]{\underset{\raise.3ex\hbox{$\scriptstyle\sim$}}{\beta}}\vphantom{\beta}}\right\}\mathclose{}} && \text{(exponentiating the baseline log-hazard gives the baseline hazard)} \\
&= {\lambda}_0(t) \theta_{{\lambda}}(\mathord{\smash[b]{\underset{\raise.3ex\hbox{$\scriptstyle\sim$}}{x}}\vphantom{x}}) && \text{(hazard factor under proportional hazards)}
\end{aligned}
\tag{21}\]
Definition 12 (Risk Score (hazard multiplier, partial hazard)) In a Cox proportional hazards model (see Definition 11) with coefficient vector \(\mathord{\smash[b]{\underset{\raise.3ex\hbox{$\scriptstyle\sim$}}{\beta}}\vphantom{\beta}}\), the risk score (also called the hazard multiplier or partial hazard) for a subject with covariate vector \(\mathord{\smash[b]{\underset{\raise.3ex\hbox{$\scriptstyle\sim$}}{x}}\vphantom{x}}\) is:
Definition 13 (Proportional hazards) A conditional probability distribution \(p(T|X)\) has proportional hazards if the hazard ratio \({\lambda}(t|\mathord{\smash[b]{\underset{\raise.3ex\hbox{$\scriptstyle\sim$}}{x}}\vphantom{x}}_1)/{\lambda}(t|\mathord{\smash[b]{\underset{\raise.3ex\hbox{$\scriptstyle\sim$}}{x}}\vphantom{x}}_2)\) does not depend on \(t\). Mathematically, it is defined as:
Setting \(\mathord{\smash[b]{\underset{\raise.3ex\hbox{$\scriptstyle\sim$}}{x}}\vphantom{x}}= \mathord{\smash[b]{\underset{\raise.3ex\hbox{$\scriptstyle\sim$}}{0}}\vphantom{0}}\) in Theorem 7 yields:
\[
\begin{aligned}
\theta_{{\lambda}}(\mathord{\smash[b]{\underset{\raise.3ex\hbox{$\scriptstyle\sim$}}{0}}\vphantom{0}})
&= {\operatorname{exp}\mathopen{}\left\{\mathord{\smash[b]{\underset{\raise.3ex\hbox{$\scriptstyle\sim$}}{0}}\vphantom{0}}\cdot \mathord{\smash[b]{\underset{\raise.3ex\hbox{$\scriptstyle\sim$}}{\beta}}\vphantom{\beta}}\right\}\mathclose{}} && \text{(hazard factor under proportional hazards, with } \mathord{\smash[b]{\underset{\raise.3ex\hbox{$\scriptstyle\sim$}}{x}}\vphantom{x}}= \mathord{\smash[b]{\underset{\raise.3ex\hbox{$\scriptstyle\sim$}}{0}}\vphantom{0}}\text{)} \\
&= {\operatorname{exp}\mathopen{}\left\{0\right\}\mathclose{}} && \text{(dot product with the zero vector)} \\
&= 1 && \text{(exponential of zero)}
\end{aligned}
\tag{24}\]
The proportional hazards model also has additional notable properties, which follow from Theorem 8 and Theorem 7:
\[
\begin{aligned}
\frac{{\lambda}(t|\mathord{\smash[b]{\underset{\raise.3ex\hbox{$\scriptstyle\sim$}}{x}}\vphantom{x}}_1)}{{\lambda}(t|\mathord{\smash[b]{\underset{\raise.3ex\hbox{$\scriptstyle\sim$}}{x}}\vphantom{x}}_2)}
&=\frac{{\lambda}_0(t)\theta_{{\lambda}}(\mathord{\smash[b]{\underset{\raise.3ex\hbox{$\scriptstyle\sim$}}{x}}\vphantom{x}}_1)}{{\lambda}_0(t)\theta_{{\lambda}}(\mathord{\smash[b]{\underset{\raise.3ex\hbox{$\scriptstyle\sim$}}{x}}\vphantom{x}}_2)} && \text{(applying the PH hazard decomposition)} \\
&=\frac{\theta_{{\lambda}}(\mathord{\smash[b]{\underset{\raise.3ex\hbox{$\scriptstyle\sim$}}{x}}\vphantom{x}}_1)}{\theta_{{\lambda}}(\mathord{\smash[b]{\underset{\raise.3ex\hbox{$\scriptstyle\sim$}}{x}}\vphantom{x}}_2)} && \text{(canceling baseline hazard } {\lambda}_0(t)\text{)} \\
&=\frac{{\operatorname{exp}\mathopen{}\left\{\Delta\eta(\mathord{\smash[b]{\underset{\raise.3ex\hbox{$\scriptstyle\sim$}}{x}}\vphantom{x}}_1)\right\}\mathclose{}}}{{\operatorname{exp}\mathopen{}\left\{\Delta\eta(\mathord{\smash[b]{\underset{\raise.3ex\hbox{$\scriptstyle\sim$}}{x}}\vphantom{x}}_2)\right\}\mathclose{}}} && \text{(hazard factor under proportional hazards)} \\
&={\operatorname{exp}\mathopen{}\left\{\Delta\eta(\mathord{\smash[b]{\underset{\raise.3ex\hbox{$\scriptstyle\sim$}}{x}}\vphantom{x}}_1)-\Delta\eta(\mathord{\smash[b]{\underset{\raise.3ex\hbox{$\scriptstyle\sim$}}{x}}\vphantom{x}}_2)\right\}\mathclose{}} && \text{(quotient rule for exponentials)} \\
&={\operatorname{exp}\mathopen{}\left\{{\mathord{\smash[b]{\underset{\raise.3ex\hbox{$\scriptstyle\sim$}}{x}}\vphantom{x}}_1}^{\top}\mathord{\smash[b]{\underset{\raise.3ex\hbox{$\scriptstyle\sim$}}{\beta}}\vphantom{\beta}}-{\mathord{\smash[b]{\underset{\raise.3ex\hbox{$\scriptstyle\sim$}}{x}}\vphantom{x}}_2}^{\top}\mathord{\smash[b]{\underset{\raise.3ex\hbox{$\scriptstyle\sim$}}{\beta}}\vphantom{\beta}}\right\}\mathclose{}} && \text{(substituting linear predictors)} \\
&={\operatorname{exp}\mathopen{}\left\{{(\mathord{\smash[b]{\underset{\raise.3ex\hbox{$\scriptstyle\sim$}}{x}}\vphantom{x}}_1 - \mathord{\smash[b]{\underset{\raise.3ex\hbox{$\scriptstyle\sim$}}{x}}\vphantom{x}}_2)}^{\top}\mathord{\smash[b]{\underset{\raise.3ex\hbox{$\scriptstyle\sim$}}{\beta}}\vphantom{\beta}}\right\}\mathclose{}} && \text{(factoring out } \mathord{\smash[b]{\underset{\raise.3ex\hbox{$\scriptstyle\sim$}}{\beta}}\vphantom{\beta}}\text{)}
\end{aligned}
\tag{25}\]
Hence on the log scale, we have:
Theorem 11 (Difference of log-hazards is a linear combination)\[
\begin{aligned}
{\operatorname{log}\mathopen{}\left\{\frac{{\lambda}(t|\mathord{\smash[b]{\underset{\raise.3ex\hbox{$\scriptstyle\sim$}}{x}}\vphantom{x}})}{{\lambda}(t|\mathord{{\mathord{\smash[b]{\underset{\raise.3ex\hbox{$\scriptstyle\sim$}}{x}}\vphantom{x}}^*}})}\right\}\mathclose{}}
&= {\operatorname{log}\mathopen{}\left\{{\lambda}(t|\mathord{\smash[b]{\underset{\raise.3ex\hbox{$\scriptstyle\sim$}}{x}}\vphantom{x}})\right\}\mathclose{}} - {\operatorname{log}\mathopen{}\left\{{\lambda}(t|\mathord{{\mathord{\smash[b]{\underset{\raise.3ex\hbox{$\scriptstyle\sim$}}{x}}\vphantom{x}}^*}})\right\}\mathclose{}} && \text{(logarithm of quotient rule)}
\\
&\stackrel{\text{def}}{=}\eta(t|\mathord{\smash[b]{\underset{\raise.3ex\hbox{$\scriptstyle\sim$}}{x}}\vphantom{x}}) - \eta(t|\mathord{{\mathord{\smash[b]{\underset{\raise.3ex\hbox{$\scriptstyle\sim$}}{x}}\vphantom{x}}^*}}) && \text{(definition of log-hazards)}
\\
&\stackrel{\text{def}}{=}\Delta\eta(t|\mathord{\smash[b]{\underset{\raise.3ex\hbox{$\scriptstyle\sim$}}{x}}\vphantom{x}}: \mathord{{\mathord{\smash[b]{\underset{\raise.3ex\hbox{$\scriptstyle\sim$}}{x}}\vphantom{x}}^*}}) && \text{(definition of log-hazard difference)}
\\
&= \Delta\eta(\mathord{\smash[b]{\underset{\raise.3ex\hbox{$\scriptstyle\sim$}}{x}}\vphantom{x}}) - \Delta\eta(\mathord{{\mathord{\smash[b]{\underset{\raise.3ex\hbox{$\scriptstyle\sim$}}{x}}\vphantom{x}}^*}}) && \text{(linear predictor form)}
\\
&= \mathord{\smash[b]{\underset{\raise.3ex\hbox{$\scriptstyle\sim$}}{x}}\vphantom{x}} \cdot \mathord{\smash[b]{\underset{\raise.3ex\hbox{$\scriptstyle\sim$}}{\beta}}\vphantom{\beta}} - \mathord{{\mathord{\smash[b]{\underset{\raise.3ex\hbox{$\scriptstyle\sim$}}{x}}\vphantom{x}}^*}} \cdot \mathord{\smash[b]{\underset{\raise.3ex\hbox{$\scriptstyle\sim$}}{\beta}}\vphantom{\beta}} && \text{(substituting linear predictors)}
\\
&= (\mathord{\smash[b]{\underset{\raise.3ex\hbox{$\scriptstyle\sim$}}{x}}\vphantom{x}}- \mathord{{\mathord{\smash[b]{\underset{\raise.3ex\hbox{$\scriptstyle\sim$}}{x}}\vphantom{x}}^*}}) \cdot \mathord{\smash[b]{\underset{\raise.3ex\hbox{$\scriptstyle\sim$}}{\beta}}\vphantom{\beta}} && \text{(factoring out } \mathord{\smash[b]{\underset{\raise.3ex\hbox{$\scriptstyle\sim$}}{\beta}}\vphantom{\beta}}\text{)}
\end{aligned}
\tag{26}\]
Applying the general procedure for interpreting a regression coefficient to the log-hazard linear predictor \(\Delta\eta(\mathord{\smash[b]{\underset{\raise.3ex\hbox{$\scriptstyle\sim$}}{x}}\vphantom{x}}) = \mathord{\smash[b]{\underset{\raise.3ex\hbox{$\scriptstyle\sim$}}{x}}\vphantom{x}}\cdot \mathord{\smash[b]{\underset{\raise.3ex\hbox{$\scriptstyle\sim$}}{\beta}}\vphantom{\beta}}\) (differentiating or differencing with respect to \(x_j\), depending on whether \(x_j\) is continuous or discrete, with all other covariates held fixed) yields the following interpretation of \(\beta_j\):
Additional properties of the proportional hazards model
If \({\lambda}(t|\mathord{\smash[b]{\underset{\raise.3ex\hbox{$\scriptstyle\sim$}}{x}}\vphantom{x}})= {\lambda}_0(t)\theta_{{\lambda}}(\mathord{\smash[b]{\underset{\raise.3ex\hbox{$\scriptstyle\sim$}}{x}}\vphantom{x}})\), then:
Theorem 12 (Cumulative hazards are also proportional to \({\Lambda}_0(t)\))\[
\begin{aligned}
{\Lambda}(t|\mathord{\smash[b]{\underset{\raise.3ex\hbox{$\scriptstyle\sim$}}{x}}\vphantom{x}})
&\stackrel{\text{def}}{=}\int_{u=0}^t {\lambda}(u)du\\
&= \int_{u=0}^t {\lambda}_0(u)\theta_{{\lambda}}(\mathord{\smash[b]{\underset{\raise.3ex\hbox{$\scriptstyle\sim$}}{x}}\vphantom{x}})du\\
&= \theta_{{\lambda}}(\mathord{\smash[b]{\underset{\raise.3ex\hbox{$\scriptstyle\sim$}}{x}}\vphantom{x}})\int_{u=0}^t {\lambda}_0(u)du\\
&= \theta_{{\lambda}}(\mathord{\smash[b]{\underset{\raise.3ex\hbox{$\scriptstyle\sim$}}{x}}\vphantom{x}}){\Lambda}_0(t)
\end{aligned}
\]
where \({\Lambda}_0(t) \stackrel{\text{def}}{=}{\Lambda}(t|\mathord{\smash[b]{\underset{\raise.3ex\hbox{$\scriptstyle\sim$}}{0}}\vphantom{0}}) = \int_{u=0}^t {\lambda}_0(u)du\).
Theorem 13 (The logarithms of cumulative hazard should be parallel)\[
{\operatorname{log}\mathopen{}\left\{{\Lambda}(t|\mathord{\smash[b]{\underset{\raise.3ex\hbox{$\scriptstyle\sim$}}{x}}\vphantom{x}})\right\}\mathclose{}} ={\operatorname{log}\mathopen{}\left\{{\Lambda}_0(t)\right\}\mathclose{}} + \mathord{\smash[b]{\underset{\raise.3ex\hbox{$\scriptstyle\sim$}}{x}}\vphantom{x}}\cdot \mathord{\smash[b]{\underset{\raise.3ex\hbox{$\scriptstyle\sim$}}{\beta}}\vphantom{\beta}}
\]
Here and throughout this chapter, we color the \({\color{blue}{\text{baseline hazard}}}\) — the part shared by every covariate pattern — and the \({\color{red}{\text{covariate hazard ratio}}}\) — the part specific to \(\mathord{\smash[b]{\underset{\raise.3ex\hbox{$\scriptstyle\sim$}}{x}}\vphantom{x}}\) — so the eye can follow each piece through the algebra.
Logarithmic Link Function Assumption:
Link function: \[{\operatorname{log}\mathopen{}\left\{{\lambda}(t|\mathord{\smash[b]{\underset{\raise.3ex\hbox{$\scriptstyle\sim$}}{x}}\vphantom{x}})\right\}\mathclose{}} = \eta(t|\mathord{\smash[b]{\underset{\raise.3ex\hbox{$\scriptstyle\sim$}}{x}}\vphantom{x}})\]\[{\operatorname{log}\mathopen{}\left\{\theta_{{\lambda}}(\mathord{\smash[b]{\underset{\raise.3ex\hbox{$\scriptstyle\sim$}}{x}}\vphantom{x}})\right\}\mathclose{}} = \Delta\eta(\mathord{\smash[b]{\underset{\raise.3ex\hbox{$\scriptstyle\sim$}}{x}}\vphantom{x}})\]
Inverse link function: \[{\lambda}(t|\mathord{\smash[b]{\underset{\raise.3ex\hbox{$\scriptstyle\sim$}}{x}}\vphantom{x}}) = {\operatorname{exp}\mathopen{}\left\{\eta(t|\mathord{\smash[b]{\underset{\raise.3ex\hbox{$\scriptstyle\sim$}}{x}}\vphantom{x}})\right\}\mathclose{}}\]\[\theta_{{\lambda}}(\mathord{\smash[b]{\underset{\raise.3ex\hbox{$\scriptstyle\sim$}}{x}}\vphantom{x}}) = {\operatorname{exp}\mathopen{}\left\{\Delta\eta(\mathord{\smash[b]{\underset{\raise.3ex\hbox{$\scriptstyle\sim$}}{x}}\vphantom{x}})\right\}\mathclose{}}\]
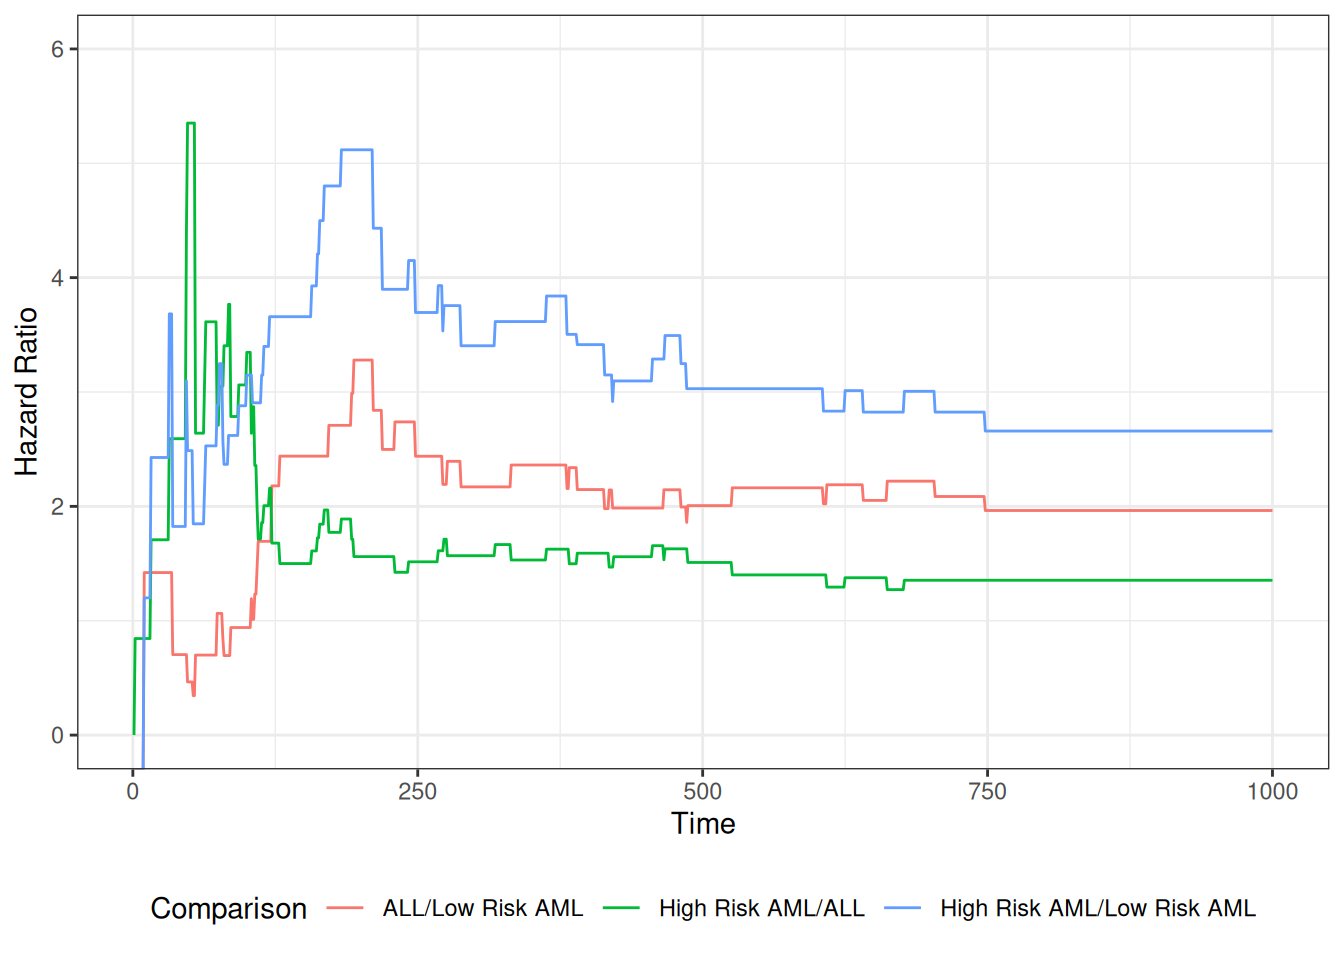
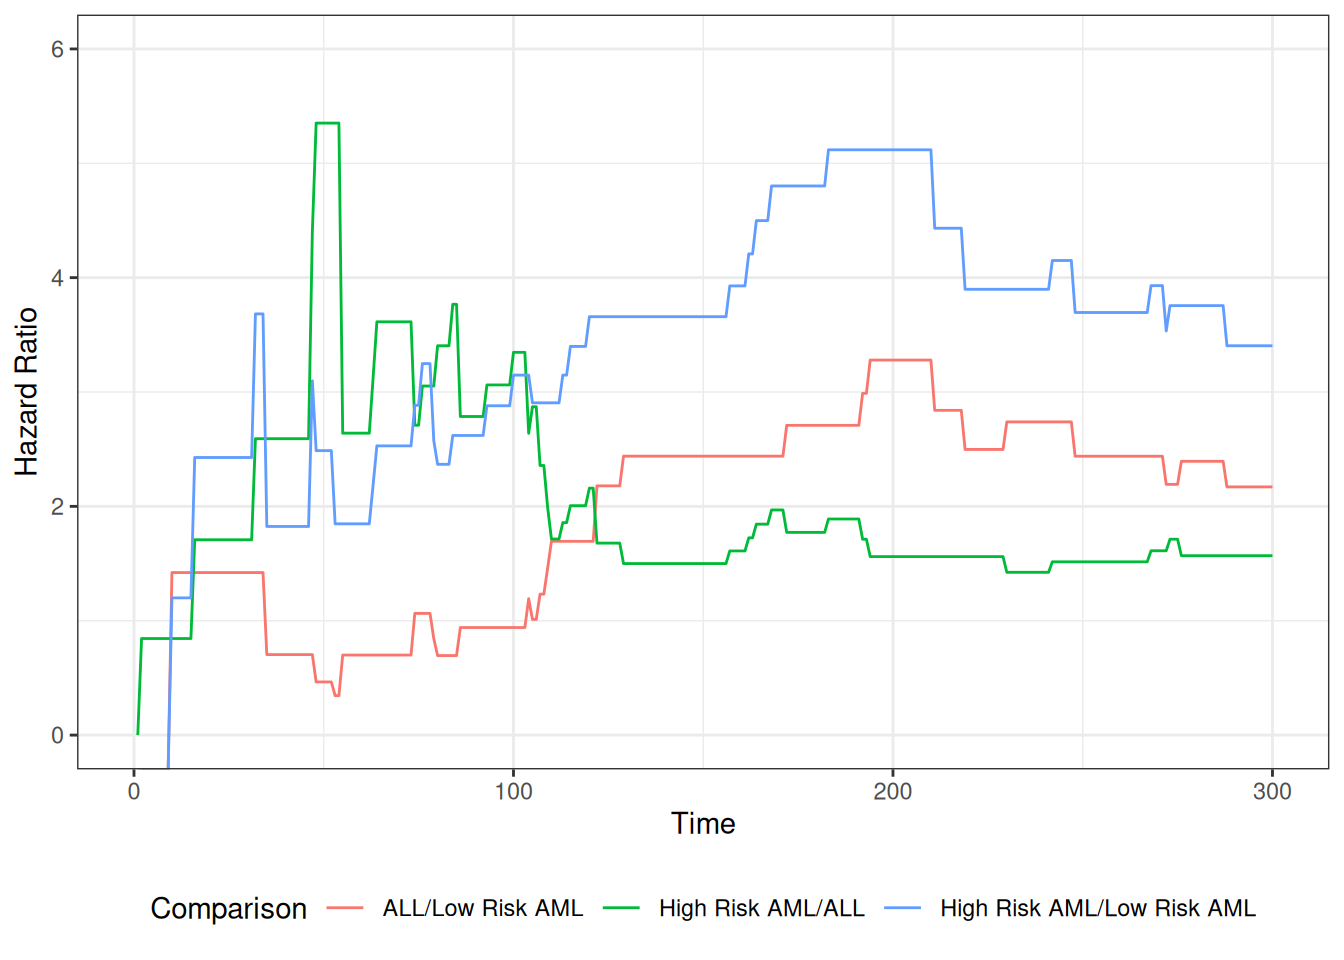
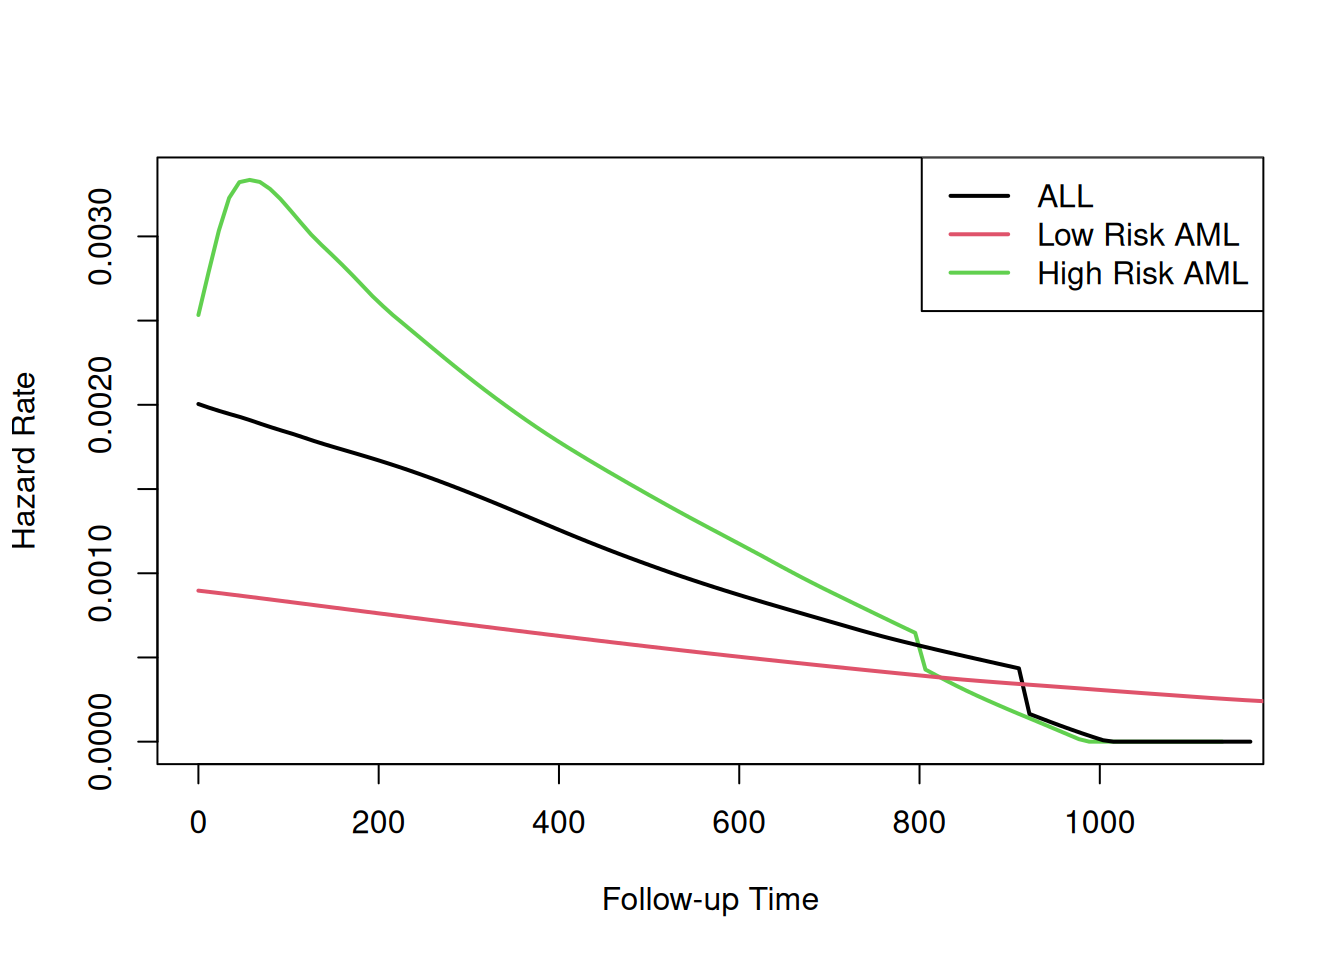
Figure 5: Smoothed Hazard Rate Estimates by Disease Group
4 Fitting proportional hazards models to data
Video lecture
David Rocke’s Epi 204 lecture Survival Regression with the Cox Model II (slides) covers partial likelihood estimation, adjustment for ties, the coxph() function, inference for hazard ratios, and predicted survival curves, using the bmt data [1].
where, for the distinct event times \(t_1 < \cdots < t_K\) of the data set:
\((i)\) is the subject who fails at \(t_i\) (unique under the no-ties assumption);
\(R(t_i) \stackrel{\text{def}}{=}{\mathopen{}\left\{j : Y_j \ge t_i\right\}\mathclose{}}\) is the risk set at \(t_i\) (where \(Y_j = \min(T_j, C_j)\) is subject \(j\)’s observed follow-up time) — the subjects still under observation just before \(t_i\);
\(d_i\) is the number of events at \(t_i\) (so \(d_i = 1\) when there are no ties);
\(\theta_{{\lambda}}(\mathord{\smash[b]{\underset{\raise.3ex\hbox{$\scriptstyle\sim$}}{x}}\vphantom{x}}) \stackrel{\text{def}}{=}{\operatorname{exp}\mathopen{}\left\{{\mathord{\smash[b]{\underset{\raise.3ex\hbox{$\scriptstyle\sim$}}{x}}\vphantom{x}}}^{\top}\mathord{\smash[b]{\underset{\raise.3ex\hbox{$\scriptstyle\sim$}}{\beta}}\vphantom{\beta}}\right\}\mathclose{}}\) is the hazard ratio (risk score) for covariate pattern \(\mathord{\smash[b]{\underset{\raise.3ex\hbox{$\scriptstyle\sim$}}{x}}\vphantom{x}}\).
Definition 15 (First-order interval failure probability) To first order in \(\Delta t\), the interval failure probability\(q_j(\tau)\) is the hazard times the interval width. We give that approximation its own symbol, the first-order interval failure probability:
Example 3 (First-order approximation versus the exact value) Continue the setup of the interval failure probability example: subject \(j\) has constant hazard \({\lambda}(t) = 0.1\) per year, on the half-year interval \([4.0,\, 4.5)\) with \(\Delta t = 0.5\) years. The first-order approximation replaces the exact value with the hazard times the interval width:
The first-order approximation \(q^*_j(4.0) = 0.05\) overstates the exact value \(q_j(4.0) \approx 0.0488\) by about \(0.0012\), a relative error of roughly \(2.5\%\). The discrepancy is exactly the leading term dropped by the linearization\(1 - {\operatorname{exp}\mathopen{}\left\{-x\right\}\mathclose{}} = x - \frac{x^2}{2} + \cdots\): here \(x = {\lambda}(4.0)\,\Delta t = 0.05\), so the dropped term is \(\frac{x^2}{2} = \frac{0.05^2}{2} \approx 0.00125\), which shrinks to zero as \(\Delta t \to 0\). This vanishing discrepancy is why proofs based on this discretization become exact in the continuous-time limit.
Lemma 4 (Exact discretization of the survival factor) Partition \([0, \max_j Y_j]\) into intervals of width \(\Delta t\) with left endpoints \(\tau\), and assume each observed time \(Y_j\) falls on an interval boundary (for an interior \(Y_j\) the identity instead holds in the \(\Delta t \to 0\) limit). Then each subject’s survival factor is the exact product of its per-interval conditional survival probabilities:
Proof. Surviving to \(Y_j\) is the intersection of the events “survive interval \(\tau\)”, over all grid intervals \(\tau < Y_j\), which tile \([0, Y_j)\) exactly because \(Y_j\) is a grid boundary. By the chain rule for survival over a partition, the probability of this intersection factors into the product, over those intervals, of the conditional probability of surviving each interval given survival to its left endpoint. That conditional survival probability is, by definition, \(1 - q_j(\tau)\). The factorization is exact: each factor is the exact conditional survival probability \(1 - q_j(\tau)\), not its first-order hazard approximation, so no error is incurred at this step.
Example 4 (Discretizing a constant hazard) Suppose subject \(j\) has constant hazard \({\lambda}(t \mid \mathord{\smash[b]{\underset{\raise.3ex\hbox{$\scriptstyle\sim$}}{x}}\vphantom{x}}_j) = 0.1\)/yr and is observed to \(Y_j = 1.5\) yr, discretized with \(\Delta t = 0.5\) yr (three intervals, \(\tau = 0,\, 0.5,\, 1.0\)). Each exact per-interval survival factor is
which matches the closed form \(\operatorname{S}(1.5 \mid \mathord{\smash[b]{\underset{\raise.3ex\hbox{$\scriptstyle\sim$}}{x}}\vphantom{x}}_j) = {\operatorname{exp}\mathopen{}\left\{-0.1 \times 1.5\right\}\mathclose{}} = {\operatorname{exp}\mathopen{}\left\{-0.15\right\}\mathclose{}} \approx 0.8607\) exactly, confirming that the discretization introduces no error.
Lemma 5 (Censored-data likelihood) Under noninformative censoring (conditional on \(\mathord{\smash[b]{\underset{\raise.3ex\hbox{$\scriptstyle\sim$}}{x}}\vphantom{x}}\), censoring times are independent of event times), the likelihood of the observed data \({\mathopen{}\left\{(Y_j, D_j, \mathord{\smash[b]{\underset{\raise.3ex\hbox{$\scriptstyle\sim$}}{x}}\vphantom{x}}_j)\right\}\mathclose{}}_{j=1}^n\) is
where \(Y_j = \min(T_j, C_j)\) is the observed follow-up time and \(D_j = \text{1}_{T_j \le C_j}\) the event indicator.
Proof. A subject observed to fail (\(D_j = 1\)) contributes the event-time density\({\lambda}(Y_j \mid \mathord{\smash[b]{\underset{\raise.3ex\hbox{$\scriptstyle\sim$}}{x}}\vphantom{x}}_j)\,\operatorname{S}(Y_j \mid \mathord{\smash[b]{\underset{\raise.3ex\hbox{$\scriptstyle\sim$}}{x}}\vphantom{x}}_j)\), while a subject still censored (\(D_j = 0\)) contributes the survival probability \(\operatorname{S}(Y_j \mid \mathord{\smash[b]{\underset{\raise.3ex\hbox{$\scriptstyle\sim$}}{x}}\vphantom{x}}_j)\). Under noninformative censoring the two cases combine into the single contribution \(\operatorname{S}(Y_j \mid \mathord{\smash[b]{\underset{\raise.3ex\hbox{$\scriptstyle\sim$}}{x}}\vphantom{x}}_j)\,{\lambda}(Y_j \mid \mathord{\smash[b]{\underset{\raise.3ex\hbox{$\scriptstyle\sim$}}{x}}\vphantom{x}}_j)^{D_j}\) (the likelihood with censoring section). Subjects are independent, so the full likelihood is the product of these contributions over \(j\).
Example 5 (A two-subject likelihood) Suppose subject \(1\) fails at \(Y_1 = 3\) (\(D_1 = 1\)) and subject \(2\) is still censored at \(Y_2 = 5\) (\(D_2 = 0\)). Then Equation 31 gives
The failing subject contributes both a survival factor and a hazard factor; the censored subject contributes only a survival factor.
Definition 16 (Per-interval likelihood factor) For a grid interval with left endpoint \(\tau\) and risk set \(R(\tau)\), the per-interval likelihood factor collects one factor from every member of \(R(\tau)\) — a failure factor for the subject who fails in the interval (if any) and a survival factor for each subject who does not:
Example 6 (Per-interval factor for a three-subject risk set) Suppose interval \(\tau\) has risk set \(R(\tau) = {\mathopen{}\left\{1, 2, 3\right\}\mathclose{}}\), with subject \(2\) failing in the interval and subjects \(1\) and \(3\) surviving it. Then the per-interval likelihood factor is
a survival factor for each of subjects \(1\) and \(3\) and a failure factor for subject \(2\).
Lemma 6 (Likelihood regrouped by interval) Substituting Equation 30 into Equation 31 and regrouping the factors by interval, the likelihood is the product of the per-interval likelihood factors (Definition 16):
so each interval \(\tau\) contributes one factor per member of its risk set \(R(\tau)\). Under the no-ties assumption each interval holds at most one failure.
Proof. By Lemma 5 and Lemma 4, substituting the discretized survival factor into the likelihood and replacing the failure subject’s hazard-density factor \({\lambda}(Y_j \mid \mathord{\smash[b]{\underset{\raise.3ex\hbox{$\scriptstyle\sim$}}{x}}\vphantom{x}}_j)^{D_j}\) by \(\mathopen{}\left(q_j(Y_j) / \Delta t\right)\mathclose{}^{D_j}\), via the first-order approximation \(q_j(Y_j) \approx {\lambda}(Y_j \mid \mathord{\smash[b]{\underset{\raise.3ex\hbox{$\scriptstyle\sim$}}{x}}\vphantom{x}}_j)\,\Delta t\) (Definition 15) rearranged to \({\lambda}(Y_j \mid \mathord{\smash[b]{\underset{\raise.3ex\hbox{$\scriptstyle\sim$}}{x}}\vphantom{x}}_j) \approx q_j(Y_j) / \Delta t\), then absorbing the constant \(\Delta t^{-D_j}\) (which is independent of all model parameters),
Each factor in Equation 34 is indexed by a (subject, interval) pair: subject \(j\) contributes one factor to every interval \(\tau\) with \(j \in R(\tau)\) — a failure factor \(q_j(\tau)\) if \(j\) fails in \(\tau\), and a survival factor \(1 - q_j(\tau)\) otherwise. Reindexing the double product by interval instead of by subject collects, for each \(\tau\), exactly one factor from every member \(m \in R(\tau)\) — the per-interval likelihood factor \(\mathcal{L}_\tau\) of Definition 16 — giving Equation 33. The \(\approx\) is inherited from the density approximation in Equation 34; the regrouping itself is an exact reindexing of the same factors.
Example 7 (Regrouping a two-subject likelihood) Take two subjects at risk over two intervals with left endpoints \(\tau = 0\) and \(\tau = 1\). Subject \(1\) survives interval \(0\) and fails in interval \(1\); subject \(2\) survives both intervals. Grouping the factors by subject (Equation 34) gives
The two products contain identical factors; regrouping only changes the order of multiplication, which is why it is exact.
Definition 17 (Proportional-hazards first-order interval failure probability) Under the proportional-hazards model (Theorem 8), the first-order interval failure probability (Definition 15) factors into a shared baseline term and a subject-specific hazard ratio:
Example 8 (First-order approximation under the PH model) Take a half-year interval \([4.0,\, 4.5)\) with \(\Delta t = 0.5\) yr, baseline hazard \({\color{blue}{{\lambda}_0(4.0) = 0.1}}\)/yr, and a subject with hazard ratio \({\color{red}{\theta_{{\lambda}}(\mathord{\smash[b]{\underset{\raise.3ex\hbox{$\scriptstyle\sim$}}{x}}\vphantom{x}}_j)}} = 2\). The proportional-hazards factorization splits the first-order probability into the shared baseline factor and the subject’s hazard ratio:
Equivalently, the subject’s total hazard is \({\lambda}(4.0 \mid \mathord{\smash[b]{\underset{\raise.3ex\hbox{$\scriptstyle\sim$}}{x}}\vphantom{x}}_j) = {\color{blue}{{\lambda}_0(4.0)}}\,{\color{red}{\theta_{{\lambda}}(\mathord{\smash[b]{\underset{\raise.3ex\hbox{$\scriptstyle\sim$}}{x}}\vphantom{x}}_j)}} = 0.2\)/yr, so \(q^*_j(4.0) = {\lambda}(4.0 \mid \mathord{\smash[b]{\underset{\raise.3ex\hbox{$\scriptstyle\sim$}}{x}}\vphantom{x}}_j)\,\Delta t = 0.2 \times 0.5 = 0.10\).
Lemma 7 (Single-subject failure probability in a risk set) For any subject \(j \in R(t_i)\), under noninformative censoring, the probability that \(j\) fails in the interval at \(t_i\) given that \(j\) is at risk is the interval failure probability, and to first order in \(\Delta t\),
Proof. Since \(j \in R(t_i)\) means \(Y_j = \min(T_j, C_j) \ge t_i\), we have both \(T_j \ge t_i\) and \(C_j \ge t_i\). Under noninformative censoring, the event \(C_j \ge t_i\) carries no information about \(T_j\) given \(\mathord{\smash[b]{\underset{\raise.3ex\hbox{$\scriptstyle\sim$}}{x}}\vphantom{x}}_j\), so conditioning on \(j \in R(t_i)\) is equivalent to conditioning on \(T_j \ge t_i\) alone. This conditional failure probability is exactly the interval failure probability\(q_j(t_i)\). The first-order interval failure probability (Definition 15) then gives \(q_j(t_i) \approx q^*_j(t_i)\), and the proportional-hazards decomposition (Definition 17) splits \(q^*_j(t_i)\) into the shared baseline factor \({\color{blue}{{\lambda}_0(t_i)\,\Delta t}}\) and the subject-specific hazard ratio \({\color{red}{\theta_{{\lambda}}(\mathord{\smash[b]{\underset{\raise.3ex\hbox{$\scriptstyle\sim$}}{x}}\vphantom{x}}_j)}}\).
Example 9 (Failure probabilities in a three-subject risk set) This example introduces a running scenario reused later in this section: the risk set \(R(t_i) = {\mathopen{}\left\{1, 2, 3\right\}\mathclose{}}\) at \(t_i = 4\) yr, with hazard ratios \({\color{red}{\theta_{{\lambda}}(\mathord{\smash[b]{\underset{\raise.3ex\hbox{$\scriptstyle\sim$}}{x}}\vphantom{x}}_1)}} = 1\), \({\color{red}{\theta_{{\lambda}}(\mathord{\smash[b]{\underset{\raise.3ex\hbox{$\scriptstyle\sim$}}{x}}\vphantom{x}}_2)}} = 2\), \({\color{red}{\theta_{{\lambda}}(\mathord{\smash[b]{\underset{\raise.3ex\hbox{$\scriptstyle\sim$}}{x}}\vphantom{x}}_3)}} = 3\), baseline \({\color{blue}{{\lambda}_0(4)}} = 0.1\)/yr, and grid width \(\Delta t = 0.5\) yr, so the shared factor is \({\color{blue}{{\lambda}_0(4)\,\Delta t}} = 0.05\). Subject \(2\) is the one who fails at \(t_i\). By Equation 35,
each the shared \(0.05\) scaled by that subject’s hazard ratio \({\color{red}{\theta_{{\lambda}}(\mathord{\smash[b]{\underset{\raise.3ex\hbox{$\scriptstyle\sim$}}{x}}\vphantom{x}}_j)}}\).
Definition 18 (Risk-set score total) The risk-set score total at event time \(t_i\) is the sum of the subject-specific hazard ratios over everyone at risk at \(t_i\):
where \(R(t_i)\) is the risk set at \(t_i\) and \({\color{red}{\theta_{{\lambda}}(\mathord{\smash[b]{\underset{\raise.3ex\hbox{$\scriptstyle\sim$}}{x}}\vphantom{x}})}} \stackrel{\text{def}}{=}{\operatorname{exp}\mathopen{}\left\{{\mathord{\smash[b]{\underset{\raise.3ex\hbox{$\scriptstyle\sim$}}{x}}\vphantom{x}}}^{\top}\mathord{\smash[b]{\underset{\raise.3ex\hbox{$\scriptstyle\sim$}}{\beta}}\vphantom{\beta}}\right\}\mathclose{}}\) is the hazard ratio (risk score) for covariate pattern \(\mathord{\smash[b]{\underset{\raise.3ex\hbox{$\scriptstyle\sim$}}{x}}\vphantom{x}}\).
Example 10 (Risk-set score total in the three-subject risk set) For the running scenario of Example 9 — \(R(4) = {\mathopen{}\left\{1, 2, 3\right\}\mathclose{}}\) with hazard ratios \({\color{red}{\theta_{{\lambda}}(\mathord{\smash[b]{\underset{\raise.3ex\hbox{$\scriptstyle\sim$}}{x}}\vphantom{x}}_1)}} = 1\), \({\color{red}{\theta_{{\lambda}}(\mathord{\smash[b]{\underset{\raise.3ex\hbox{$\scriptstyle\sim$}}{x}}\vphantom{x}}_2)}} = 2\), \({\color{red}{\theta_{{\lambda}}(\mathord{\smash[b]{\underset{\raise.3ex\hbox{$\scriptstyle\sim$}}{x}}\vphantom{x}}_3)}} = 3\) — the risk-set score total (Equation 36) is
Lemma 8 (The whether-a-failure-occurs factor) To first order in \(\Delta t\), the probability of exactly one failure in the interval at \(t_i\) is the shared baseline factor times the risk-set score total \({\color{red}{S_i}}\) (Definition 18):
Proof. Treating subjects’ failure events as conditionally independent given \(R(t_i)\) (the Cox-model assumption used throughout; see [3, Sec. 8.3]), the probability of exactly one failure is, by inclusion-exclusion,
By Lemma 7, \(\Pr\mathopen{}\left[m \text{ fails} \mid R(t_i)\right]\mathclose{} = q_m(t_i) = O(\Delta t)\), so each surviving product is \(\prod_{m \ne k}(1 - O(\Delta t)) = 1 - O(\Delta t)\), and dropping the \(O(\Delta t^2)\) cross-terms (each pair of co-failures has probability \(O(\Delta t^2)\)) leaves the sum of the single-subject pieces. Factoring out the shared baseline,
Example 11 (One-failure probability in the three-subject risk set) Continue the running scenario of Example 9, with \({\color{blue}{{\lambda}_0(4)\,\Delta t}} = 0.05\) and risk-set score total \({\color{red}{S_i}} = 6\) (Example 10). By Equation 37, the probability that some one subject fails at \(t_i = 4\) is
Lemma 9 (Chain-rule split of an event factor) Under the no-ties assumption, the probability that subject \((i)\) fails at \(t_i\), given the risk set \(R(t_i)\), factors into a which-subject-fails factor and a whether-a-failure-occurs factor:
\[
\Pr\mathopen{}\left[(i) \text{ fails at } t_i \mid R(t_i)\right]\mathclose{}
= \underbrace{\Pr\mathopen{}\left[(i) \text{ fails} \mid 1 \text{ failure at } t_i,\ R(t_i)\right]\mathclose{}}_{\text{which subject fails}}
\;\times\;
\underbrace{\Pr\mathopen{}\left[1 \text{ failure at } t_i \mid R(t_i)\right]\mathclose{}}_{\text{whether a failure occurs}} .
\tag{38}\]
Proof. Let
\(A \stackrel{\text{def}}{=}\) “subject \((i)\) fails at \(t_i\)”,
\(B \stackrel{\text{def}}{=}\) “exactly one failure occurs at \(t_i\)”,
\(C \stackrel{\text{def}}{=}\) “the risk set at \(t_i\) is \(R(t_i)\)”.
By the chain rule of probability, \(\Pr(A \cap B \mid C) = \Pr(A \mid B \cap C)\,\Pr(B \mid C)\). Under the no-ties assumption \(A \subset B\) (subject \((i)\) failing at \(t_i\) is automatically a one-failure event), so \(A \cap B = A\) and therefore \(\Pr(A \mid C) = \Pr(A \mid B \cap C)\,\Pr(B \mid C)\), which is Equation 38.
Example 12 (Splitting the event probability numerically) Continue the running scenario of Example 9, in which subject \(2\) is the one who fails at \(t_i = 4\). The left side of Equation 38 is subject \(2\)’s single-subject failure probability, \(q^*_2(4) = 0.10\) (Example 9), and the whether-a-failure factor is \(0.30\) (Example 11). The chain rule therefore pins the which-subject factor at
and indeed \(0.10 \approx \tfrac{1}{3} \times 0.30\) reproduces the left side.
Lemma 10 (The which-subject-fails factor) The which-subject-fails factor of Equation 38 equals the partial-likelihood contribution \(\mathcal{L}^*_i(\mathord{\smash[b]{\underset{\raise.3ex\hbox{$\scriptstyle\sim$}}{\beta}}\vphantom{\beta}})\) of Definition 14: the shared baseline factor cancels, leaving
Proof. Solve Equation 38 for the which-subject factor and substitute the numerator \(q_{(i)}(t_i)\) from Lemma 7 and the denominator \({\color{blue}{{\lambda}_0(t_i)\,\Delta t}}\,{\color{red}{S_i}}\) from Lemma 8; the shared \({\color{blue}{{\lambda}_0(t_i)\,\Delta t}}\) cancels between numerator and denominator:
\[
\begin{aligned}
\Pr\mathopen{}\left[(i) \text{ fails} \mid 1 \text{ failure at } t_i,\ R(t_i)\right]\mathclose{}
&= \frac{\Pr\mathopen{}\left[(i) \text{ fails at } t_i \mid R(t_i)\right]\mathclose{}}
{\Pr\mathopen{}\left[1 \text{ failure at } t_i \mid R(t_i)\right]\mathclose{}}
&& \text{(rearrange)}
\\
&\approx \frac{q^*_{(i)}(t_i)}{{\color{blue}{{\lambda}_0(t_i)\,\Delta t}}\;{\color{red}{S_i}}}
&& \text{(numerator and denominator from the previous two lemmas)}
\\
&= \frac{{\color{blue}{{\lambda}_0(t_i)\,\Delta t}}\;{\color{red}{\theta_{{\lambda}}(\mathord{\smash[b]{\underset{\raise.3ex\hbox{$\scriptstyle\sim$}}{x}}\vphantom{x}}_{(i)})}}}
{{\color{blue}{{\lambda}_0(t_i)\,\Delta t}}\;{\color{red}{S_i}}}
&& \text{(definition of } q^*_{(i)}(t_i) \text{)}
\\
&= \frac{{\color{red}{\theta_{{\lambda}}(\mathord{\smash[b]{\underset{\raise.3ex\hbox{$\scriptstyle\sim$}}{x}}\vphantom{x}}_{(i)})}}}{{\color{red}{S_i}}}
&& \text{(cancel the shared } {\color{blue}{{\lambda}_0(t_i)\,\Delta t}} \text{)}
\\
&= \mathcal{L}^*_i(\mathord{\smash[b]{\underset{\raise.3ex\hbox{$\scriptstyle\sim$}}{\beta}}\vphantom{\beta}}).
&& \text{(definition of } \mathcal{L}^*_i(\mathord{\smash[b]{\underset{\raise.3ex\hbox{$\scriptstyle\sim$}}{\beta}}\vphantom{\beta}})\text{)}
\end{aligned}
\]
The final \(=\) is exact: the \({\color{blue}{{\lambda}_0(t_i)\,\Delta t}}\) factors cancel algebraically, leaving a ratio independent of \(\Delta t\), so the which-subject factor equals the partial-likelihood contribution \(\mathcal{L}^*_i(\mathord{\smash[b]{\underset{\raise.3ex\hbox{$\scriptstyle\sim$}}{\beta}}\vphantom{\beta}})\) free of both the baseline hazard and the grid width.
Example 13 (The which-subject factor in the three-subject risk set) Continue the running scenario of Example 9, with subject \(2\) failing at \(t_i = 4\) and \({\color{red}{S_i}} = 6\) (Example 11). By Equation 39,
independent of the baseline \({\color{blue}{{\lambda}_0(4)}}\) and the grid width \(\Delta t\) — the cancellation that the partial likelihood relies on. This value \(\tfrac{1}{3}\) matches the one pinned by the chain rule in Example 12.
Proof. Adapted from [3, Sec. 8.3], Theoretical Note 1, p. 257. This proof draws on the discretized-likelihood building blocks assembled earlier in this section — Lemma 5, Lemma 4, and Lemma 6 — together with the proportional-hazards lemmas Lemma 7, Lemma 8, Lemma 9, and Lemma 10.
Assume noninformative censoring (conditional on \(\mathord{\smash[b]{\underset{\raise.3ex\hbox{$\scriptstyle\sim$}}{x}}\vphantom{x}}\), censoring times are independent of event times) and no tied event times. Let \(t_1 < \cdots < t_K\) be the distinct observed failure times, and let \((i)\) be the subject who fails at \(t_i\) (unique under the no-ties assumption).
By Lemma 6, the likelihood factors over intervals, \(\mathcal{L}\approx \prod_\tau \mathcal{L}_\tau\). Separate the \(K\) intervals that contain a failure from the rest. A no-failure interval contributes \(\mathcal{L}_\tau^{\text{no failure}} = \prod_{m \in R(\tau)}\mathopen{}\left(1 - q_m(\tau)\right)\mathclose{}\); the interval containing \(t_i\) contributes the event factor \(\Pr\mathopen{}\left[(i) \text{ fails at } t_i \mid R(t_i)\right]\mathclose{}\) times the survival of the other members, which to first order is just the event factor itself, since each other member survives with probability \(1 - O(\Delta t)\). Applying Lemma 9 to each event factor, and then Lemma 8 and Lemma 10 to its two pieces,
Under the no-ties assumption each event time has \(d_i = 1\) (where \(d_i\) is the number of events at \(t_i\)), so the kept product \(\prod_{i=1}^{K}(\cdots) = \prod_{{\mathopen{}\left\{i:\ d_i = 1\right\}\mathclose{}}}(\cdots)\) matches the form of \(\mathcal{L}^*(\mathord{\smash[b]{\underset{\raise.3ex\hbox{$\scriptstyle\sim$}}{\beta}}\vphantom{\beta}})\) in Definition 14.
The partial likelihood keeps the first product, \(\mathcal{L}^*(\mathord{\smash[b]{\underset{\raise.3ex\hbox{$\scriptstyle\sim$}}{\beta}}\vphantom{\beta}})\), and drops the second, \(\mathcal{B}(\mathord{\smash[b]{\underset{\raise.3ex\hbox{$\scriptstyle\sim$}}{\beta}}\vphantom{\beta}}, {\lambda}_0)\). The discarded factor \(\mathcal{B}(\mathord{\smash[b]{\underset{\raise.3ex\hbox{$\scriptstyle\sim$}}{\beta}}\vphantom{\beta}}, {\lambda}_0)\) collects both the whether-a-failure-occurs factors and the entire between-event survival background, and it is the only place the baseline hazard \({\color{blue}{{\lambda}_0(\cdot)}}\) appears — equivalently, the shared \({\color{blue}{{\lambda}_0(t_i)\,\Delta t}}\) cancels from each kept factor in Equation 39 — which is why maximizing \(\mathcal{L}^*(\mathord{\smash[b]{\underset{\raise.3ex\hbox{$\scriptstyle\sim$}}{\beta}}\vphantom{\beta}})\) alone frees the estimator from \({\lambda}_0(\cdot)\). The discarded factor is not free of \(\mathord{\smash[b]{\underset{\raise.3ex\hbox{$\scriptstyle\sim$}}{\beta}}\vphantom{\beta}}\), however: it still depends on \(\mathord{\smash[b]{\underset{\raise.3ex\hbox{$\scriptstyle\sim$}}{\beta}}\vphantom{\beta}}\) through the risk-set score totals \({\color{red}{S_i}}\) and the survival background. Dropping it therefore sacrifices the information about \(\mathord{\smash[b]{\underset{\raise.3ex\hbox{$\scriptstyle\sim$}}{\beta}}\vphantom{\beta}}\) carried by when (and within how large a risk set) failures occur, retaining only the information in which subject fails at each event time.
The factorization in Equation 40 is a construction rather than an exact decomposition of the joint probability: the factors are not formally independent (the risk set \(R(t_{i+1})\) depends on who failed and was censored before \(t_{i+1}\), and the discretization is exact only in the \(\Delta t \to 0\) limit), but Cox showed that treating \(\mathcal{L}^*(\mathord{\smash[b]{\underset{\raise.3ex\hbox{$\scriptstyle\sim$}}{\beta}}\vphantom{\beta}})\) as a likelihood — i.e., maximizing it as a function of \(\mathord{\smash[b]{\underset{\raise.3ex\hbox{$\scriptstyle\sim$}}{\beta}}\vphantom{\beta}}\) — yields estimators with the usual large-sample properties (consistency, asymptotic normality, the standard score and information identities; see also [3, Sec. 8.3], Theoretical Note 1). Under noninformative censoring, each kept factor depends on the observed history only through \(R(t_i)\) and \({\mathopen{}\left\{\mathord{\smash[b]{\underset{\raise.3ex\hbox{$\scriptstyle\sim$}}{x}}\vphantom{x}}_j\right\}\mathclose{}}_{j \in R(t_i)}\), and Equation 39 gives exactly the partial likelihood \(\mathcal{L}^*(\mathord{\smash[b]{\underset{\raise.3ex\hbox{$\scriptstyle\sim$}}{\beta}}\vphantom{\beta}})\) of Definition 14.
Definition 19 (Breslow estimator of the baseline cumulative hazard)\[\hat {\Lambda}_0(t) \stackrel{\text{def}}{=}
\sum_{t_i \le t} \frac{d_i}{\sum_{k\in R(t_i)} \theta_{{\lambda}}(\mathord{\smash[b]{\underset{\raise.3ex\hbox{$\scriptstyle\sim$}}{x}}\vphantom{x}}_k)}\]
where, for the distinct event times \(t_1 < \cdots < t_K\) of the data set:
\(d_i\) is the number of events at \(t_i\);
\(R(t_i) \stackrel{\text{def}}{=}{\mathopen{}\left\{j : Y_j \ge t_i\right\}\mathclose{}}\) is the risk set at \(t_i\) (where \(Y_j = \min(T_j, C_j)\) is subject \(j\)’s observed follow-up time) — the subjects still under observation just before \(t_i\);
\(\theta_{{\lambda}}(\mathord{\smash[b]{\underset{\raise.3ex\hbox{$\scriptstyle\sim$}}{x}}\vphantom{x}}) \stackrel{\text{def}}{=}{\operatorname{exp}\mathopen{}\left\{{\mathord{\smash[b]{\underset{\raise.3ex\hbox{$\scriptstyle\sim$}}{x}}\vphantom{x}}}^{\top}\mathord{\smash[b]{\underset{\raise.3ex\hbox{$\scriptstyle\sim$}}{\beta}}\vphantom{\beta}}\right\}\mathclose{}}\) is the hazard ratio (risk score) for covariate pattern \(\mathord{\smash[b]{\underset{\raise.3ex\hbox{$\scriptstyle\sim$}}{x}}\vphantom{x}}\).
Example 14 (Breslow estimator with two event times) Suppose there are two distinct event times \(t_1 = 2\) and \(t_2 = 4\) (no ties, \(d_1 = d_2 = 1\)), with risk-set-weighted totals \(\sum_{k \in R(2)} \theta_{{\lambda}}(\mathord{\smash[b]{\underset{\raise.3ex\hbox{$\scriptstyle\sim$}}{x}}\vphantom{x}}_k) = 10\) and \(\sum_{k \in R(4)} \theta_{{\lambda}}(\mathord{\smash[b]{\underset{\raise.3ex\hbox{$\scriptstyle\sim$}}{x}}\vphantom{x}}_k) = 6\). Then
Lemma 11 (Point-mass optimality of the profile baseline hazard) Take the coefficient vector \(\mathord{\smash[b]{\underset{\raise.3ex\hbox{$\scriptstyle\sim$}}{\beta}}\vphantom{\beta}}\) as given and maximize the censored-data likelihoodEquation 41 over the baseline hazard\({\lambda}_0(\cdot)\). The maximizing \({\lambda}_0(\cdot)\) places mass only at the \(K\) distinct event times \(t_1 < \cdots < t_K\), as a discrete hazard measure with point masses \({\color{blue}{h_{0i}}} \stackrel{\text{def}}{=}{\color{blue}{{\lambda}_0(t_i)}}\):
\[
{\color{blue}{{\lambda}_0(t)}} = \begin{cases}
{\color{blue}{h_{0i}}}, & t = t_i \text{ for some } i \in {\mathopen{}\left\{1, \dots, K\right\}\mathclose{}},\\
0, & \text{otherwise}.
\end{cases}
\tag{42}\]
Proof. Subjects with \(\delta_j = 0\) contribute only the survival term \({\operatorname{exp}\mathopen{}\left\{-{\color{blue}{{\Lambda}_0(\tilde{T}_j)}}\,{\color{red}{\theta_{{\lambda}}(\mathord{\smash[b]{\underset{\raise.3ex\hbox{$\scriptstyle\sim$}}{x}}\vphantom{x}}_j)}}\right\}\mathclose{}}\) to Equation 41, since \({\color{blue}{{\lambda}_0(\tilde{T}_j)}}^{\delta_j} = {\color{blue}{{\lambda}_0(\tilde{T}_j)}}^0 = 1\) regardless of \({\lambda}_0\). Adding mass to \({\lambda}_0\) at any non-event time \(t\) increases \({\color{blue}{{\Lambda}_0(\tilde{T}_j)}}\) for every subject with \(\tilde{T}_j \ge t\), penalizing their survival terms in Equation 41 without any compensating gain in a hazard-density factor — so no mass should be placed away from the \(K\) event times.
For an event subject \(j\) with \(\delta_j = 1\) whose failure occurs at \(t_i\), consider any allocation of a fixed total mass \({\color{blue}{h_{0i}}}\) to a neighborhood of \(t_i\). The cumulative hazard \({\color{blue}{{\Lambda}_0(\tilde{T}_j)}}\) depends only on that total mass, not on how it is distributed within the neighborhood, so the survival penalty \({\operatorname{exp}\mathopen{}\left\{-{\color{blue}{{\Lambda}_0(\tilde T_j)}}{\color{red}{\theta_{{\lambda}}(\mathord{\smash[b]{\underset{\raise.3ex\hbox{$\scriptstyle\sim$}}{x}}\vphantom{x}}_j)}}\right\}\mathclose{}}\) is unchanged by the allocation. But the hazard-density factor \({\color{blue}{{\lambda}_0(t_i)}}^{\delta_j}\) in Equation 41 is maximized when all of that mass is concentrated as a single point at \(t_i\) (so \({\color{blue}{{\lambda}_0(t_i)}} = {\color{blue}{h_{0i}}}\)): spreading the same total mass across a wider neighborhood would leave less of it exactly at \(t_i\), lowering \({\color{blue}{{\lambda}_0(t_i)}}\) to less than \({\color{blue}{h_{0i}}}\), while leaving the survival penalty fixed. Since concentrating the mass strictly increases the hazard-density factor without changing the survival penalty, Equation 41 is maximized by Equation 42.
Example 15 (Concentrating versus spreading a point mass) Suppose a total mass of \(0.1\) is available to place near an event time \(t_1\). Concentrating it exactly at \(t_1\) gives \({\color{blue}{{\lambda}_0(t_1)}} = {\color{blue}{h_{01}}} = 0.1\), contributing a hazard-density factor of \(0.1\) to Equation 41 for the subject failing at \(t_1\). Splitting the same total mass into two halves — \(0.05\) exactly at \(t_1\) and \(0.05\) at a nearby non-event point — leaves only \({\color{blue}{{\lambda}_0(t_1)}} = 0.05\) at \(t_1\) itself, half the hazard-density factor, while the cumulative hazard \({\color{blue}{{\Lambda}_0(\tilde T_j)}}\) (and hence every survival term) is unchanged, since both allocations place the same total mass \(0.1\) at or prior to any \(\tilde T_j \ge t_1\). Splitting the mass therefore strictly decreases the likelihood, confirming that concentrating all of it at \(t_1\) is optimal.
Lemma 12 (Profile likelihood in terms of point masses) Substituting the point-mass form of \({\lambda}_0(\cdot)\) (Lemma 11) into the censored-data likelihood Equation 41 gives the profile likelihood as a function of \(\mathord{\smash[b]{\underset{\raise.3ex\hbox{$\scriptstyle\sim$}}{\beta}}\vphantom{\beta}}\) and the point masses \(h_{01},\ldots,h_{0K}\):
where \({\color{red}{S_i}} = \sum_{j \in R(t_i)} {\color{red}{\theta_{{\lambda}}(\mathord{\smash[b]{\underset{\raise.3ex\hbox{$\scriptstyle\sim$}}{x}}\vphantom{x}}_j)}}\) is the risk-set score total (Definition 18).
Proof. By Equation 42, \({\color{blue}{{\Lambda}_0(\tilde{T}_j)}} = \sum_{i\,:\,t_i \le \tilde{T}_j} {\color{blue}{h_{0i}}}\). Expanding the survival exponent in Equation 41 and swapping the order of summation:
Here \(R(t_i)\) uses the “at risk at\(t_i\)” convention (the risk set definition) with the \(\ge\) boundary — a subject censored exactly at \(t_i\) is in \(R(t_i)\) and contributes \({\color{blue}{h_{0i}}}\) to \({\color{blue}{{\Lambda}_0(\tilde{T}_j)}}\). Reindexing the hazard-density product in Equation 41: subjects with \(\delta_j = 0\) contribute a factor of \({\color{blue}{{\lambda}_0(\tilde{T}_j)}}^0 = 1\) (no contribution), and for each subject with \(\delta_j = 1\) their event occurred at some \(t_i\), so \({\color{blue}{{\lambda}_0(\tilde{T}_j)}} = {\color{blue}{h_{0i}}}\):
Factoring \({\operatorname{exp}\mathopen{}\left\{-\sum_i {\color{blue}{h_{0i}}}\,{\color{red}{S_i}}\right\}\mathclose{}} = \prod_i {\operatorname{exp}\mathopen{}\left\{-{\color{blue}{h_{0i}}}\,{\color{red}{S_i}}\right\}\mathclose{}}\) and combining factor-by-factor with the hazard-density product gives Equation 43.
Example 16 (Profile likelihood for two event times) Extend the running scenario of Example 9 with an earlier event time \(t_1 = 2\) at which subject \(4\) fails, with risk set \(R(2) = {\mathopen{}\left\{1,2,3,4\right\}\mathclose{}}\) and hazard ratios \({\color{red}{\theta_{{\lambda}}(\mathord{\smash[b]{\underset{\raise.3ex\hbox{$\scriptstyle\sim$}}{x}}\vphantom{x}}_1)}} = 1\), \({\color{red}{\theta_{{\lambda}}(\mathord{\smash[b]{\underset{\raise.3ex\hbox{$\scriptstyle\sim$}}{x}}\vphantom{x}}_2)}} = 2\), \({\color{red}{\theta_{{\lambda}}(\mathord{\smash[b]{\underset{\raise.3ex\hbox{$\scriptstyle\sim$}}{x}}\vphantom{x}}_3)}} = 3\), \({\color{red}{\theta_{{\lambda}}(\mathord{\smash[b]{\underset{\raise.3ex\hbox{$\scriptstyle\sim$}}{x}}\vphantom{x}}_4)}} = 4\), so \({\color{red}{S_1}} = 10\) (Definition 18). Subject \(4\) then leaves the risk set, so at \(t_2 = 4\) the risk set is \(R(4) = {\mathopen{}\left\{1,2,3\right\}\mathclose{}}\) as before, with \({\color{red}{S_2}} = 6\) (Example 10). By Equation 43, with \(K = 2\),
Lemma 13 (Profile maximum likelihood estimate of each point mass) The value of \({\color{blue}{h_{0i}}}\) that maximizes the profile likelihood Equation 43 (Lemma 12) is
So each \({\color{blue}{h_{0i}}}\) can be maximized separately. Differentiate the \(i\)-th summand with respect to \({\color{blue}{h_{0i}}}\) and set the derivative to zero:
The second derivative\(-1/{\color{blue}{h_{0i}}}^2 < 0\) confirms this critical point is a maximum, giving Equation 44.
Example 17 (Maximum likelihood point masses for two event times) Continue the two-event scenario of Example 16, with \({\color{red}{S_1}} = 10\) at \(t_1 = 2\) and \({\color{red}{S_2}} = 6\) at \(t_2 = 4\). By Equation 44,
Lemma 14 (The profile likelihood at the MLE recovers the partial likelihood) Substituting the maximum likelihood point masses \({\color{blue}{\hat h_{0i}}} = 1/{\color{red}{S_i}}\) (Lemma 13) back into the profile likelihood Equation 43 (Lemma 12) gives, up to a \(\mathord{\smash[b]{\underset{\raise.3ex\hbox{$\scriptstyle\sim$}}{\beta}}\vphantom{\beta}}\)-free constant, the partial likelihood of Definition 14:
Under the no-ties assumption each event time \(t_i\) has \(d_i = 1\), so \(\prod_{i=1}^K \frac{{\color{red}{\theta_{{\lambda}}(\mathord{\smash[b]{\underset{\raise.3ex\hbox{$\scriptstyle\sim$}}{x}}\vphantom{x}}_{(i)})}}}{{\color{red}{S_i}}}\) equals the partial likelihood \(\mathcal{L}^*(\mathord{\smash[b]{\underset{\raise.3ex\hbox{$\scriptstyle\sim$}}{\beta}}\vphantom{\beta}})\) of Definition 14, giving Equation 45.
Example 18 (Verifying the profile likelihood at the MLE) Continue the two-event scenario of Example 17, with \({\color{blue}{\hat h_{01}}} = 0.1\), \({\color{red}{S_1}} = 10\), \(\theta_{{\lambda}}(\mathord{\smash[b]{\underset{\raise.3ex\hbox{$\scriptstyle\sim$}}{x}}\vphantom{x}}_4) = 4\) at \(t_1 = 2\), and \({\color{blue}{\hat h_{02}}} = 1/6\), \({\color{red}{S_2}} = 6\), \(\theta_{{\lambda}}(\mathord{\smash[b]{\underset{\raise.3ex\hbox{$\scriptstyle\sim$}}{x}}\vphantom{x}}_2) = 2\) at \(t_2 = 4\). Substituting into Equation 43,
\[
\begin{aligned}
\mathcal{L}\mathopen{}\left[\mathord{\smash[b]{\underset{\raise.3ex\hbox{$\scriptstyle\sim$}}{\beta}}\vphantom{\beta}},\,\hat h_{01},\,\hat h_{02}\right]\mathclose{}
&= \mathopen{}\left[{\color{blue}{0.1}} \times {\color{red}{4}} \times {\operatorname{exp}\mathopen{}\left\{-{\color{blue}{0.1}}\times {\color{red}{10}}\right\}\mathclose{}}\right]\mathclose{}
\times
\mathopen{}\left[{\color{blue}{\tfrac{1}{6}}} \times {\color{red}{2}} \times {\operatorname{exp}\mathopen{}\left\{-{\color{blue}{\tfrac{1}{6}}}\times {\color{red}{6}}\right\}\mathclose{}}\right]\mathclose{}
&& \text{(substitute into the profile likelihood)}
\\
&= \mathopen{}\left[\frac{{\color{red}{4}}}{{\color{red}{10}}}\,e^{-1}\right]\mathclose{} \times \mathopen{}\left[\frac{{\color{red}{2}}}{{\color{red}{6}}}\,e^{-1}\right]\mathclose{}
&& \text{(}{\color{blue}{\hat h_{0i}}}\,{\color{red}{S_i}} = 1\text{)}
\\
&= e^{-2}\times\frac{{\color{red}{4}}}{{\color{red}{10}}}\times\frac{{\color{red}{2}}}{{\color{red}{6}}} ,
&& \text{(collect the two factors of } e^{-1}\text{)}
\end{aligned}
\]
matching Equation 45 with \(K = 2\) and \(\mathcal{L}^*(\mathord{\smash[b]{\underset{\raise.3ex\hbox{$\scriptstyle\sim$}}{\beta}}\vphantom{\beta}}) = \frac{\theta_{{\lambda}}(\mathord{\smash[b]{\underset{\raise.3ex\hbox{$\scriptstyle\sim$}}{x}}\vphantom{x}}_4)}{S_1}\times\frac{\theta_{{\lambda}}(\mathord{\smash[b]{\underset{\raise.3ex\hbox{$\scriptstyle\sim$}}{x}}\vphantom{x}}_2)}{S_2} = \frac{4}{10}\times\frac{2}{6}\).
Proof. Adapted from [3, Sec. 8.3], Theoretical Note 2, p. 258; the original profile-likelihood argument is due to Johansen [4]. This proof assembles four building-block lemmas: Lemma 11, Lemma 12, Lemma 13, and Lemma 14.
Assume, as in the partial-likelihood proof, that there are no tied event times, so each ordered event time \(t_i\) corresponds to exactly one event, and let \(K\) denote the number of distinct event times \(t_1 < \cdots < t_K\).
Take the coefficient vector \(\mathord{\smash[b]{\underset{\raise.3ex\hbox{$\scriptstyle\sim$}}{\beta}}\vphantom{\beta}}\) as given. By Lemma 11, the maximizing \({\lambda}_0(\cdot)\) places point masses \({\color{blue}{h_{0i}}} \stackrel{\text{def}}{=}{\color{blue}{{\lambda}_0(t_i)}}\) only at the \(K\) event times. By Lemma 12, substituting this form into Equation 41 gives the profile likelihood Equation 43 in terms of the point masses and the risk-set score totals \({\color{red}{S_i}}\) (Definition 18). By Lemma 13, each point mass is maximized at \({\color{blue}{\hat h_{0i}}} = 1/{\color{red}{S_i}}\). Summing the estimated point masses over event times \(t_i \le t\) gives the Breslow estimator of the baseline cumulative hazard,
matching Definition 19 under the no-ties assumption (\(d_i = 1\) for every \(i\)). With tied event times, the numerator generalizes to \(d_i\), the number of events at \(t_i\) (see [3, Sec. 8.8] for the tie-handling adjustments).
By Lemma 14, substituting \({\color{blue}{\hat h_{0i}}}\) back into the profile likelihood recovers the partial likelihood up to a \(\mathord{\smash[b]{\underset{\raise.3ex\hbox{$\scriptstyle\sim$}}{\beta}}\vphantom{\beta}}\)-free constant, \(\mathcal{L}\mathopen{}\left[\mathord{\smash[b]{\underset{\raise.3ex\hbox{$\scriptstyle\sim$}}{\beta}}\vphantom{\beta}},\,\hat h_{01},\dots,\hat h_{0K}\right]\mathclose{} = e^{-K}\,\mathcal{L}^*(\mathord{\smash[b]{\underset{\raise.3ex\hbox{$\scriptstyle\sim$}}{\beta}}\vphantom{\beta}})\), where \(\mathcal{L}^*(\mathord{\smash[b]{\underset{\raise.3ex\hbox{$\scriptstyle\sim$}}{\beta}}\vphantom{\beta}})\) is the partial likelihood of Definition 14. Since \(e^{-K}\) does not depend on \(\mathord{\smash[b]{\underset{\raise.3ex\hbox{$\scriptstyle\sim$}}{\beta}}\vphantom{\beta}}\), the profile likelihood is proportional to \(\mathcal{L}^*(\mathord{\smash[b]{\underset{\raise.3ex\hbox{$\scriptstyle\sim$}}{\beta}}\vphantom{\beta}})\). This proportionality justifies treating the partial likelihood as a profile likelihood for \(\mathord{\smash[b]{\underset{\raise.3ex\hbox{$\scriptstyle\sim$}}{\beta}}\vphantom{\beta}}\), with \({\lambda}_0(\cdot)\) concentrated out.
5 Example: Proportional hazards model for the bmt data
Fit the model
[R code]
library(survival)bmt.cox <-coxph(Surv(t2, d3) ~ group, data = bmt)summary(bmt.cox)#> Call:#> coxph(formula = Surv(t2, d3) ~ group, data = bmt)#> #> n= 137, number of events= 83 #> #> coef exp(coef) se(coef) z Pr(>|z|) #> groupLow Risk AML -0.574 0.563 0.287 -2.00 0.046 *#> groupHigh Risk AML 0.383 1.467 0.267 1.43 0.152 #> ---#> Signif. codes: 0 '***' 0.001 '**' 0.01 '*' 0.05 '.' 0.1 ' ' 1#> #> exp(coef) exp(-coef) lower .95 upper .95#> groupLow Risk AML 0.563 1.776 0.321 0.989#> groupHigh Risk AML 1.467 0.682 0.869 2.478#> #> Concordance= 0.625 (se = 0.03 )#> Likelihood ratio test= 13.4 on 2 df, p=0.001#> Wald test = 13 on 2 df, p=0.001#> Score (logrank) test = 13.8 on 2 df, p=0.001
The table provides hypothesis tests comparing groups 2 and 3 to group 1. Group 3 has the highest hazard, so the most significant comparison is not directly shown.
The coefficient 0.3834 is on the log-hazard-ratio scale. The next column gives the hazard ratio 1.4673, and a hypothesis (Wald) test.
The (not shown) group 3 vs. group 2 log hazard ratio is 0.3834 − (-0.5742) = 0.9576. The hazard ratio is 2.605.
Inference on all coefficients and combinations can be constructed using coef(bmt.cox) and vcov(bmt.cox) as with logistic and poisson regression.
Concordance is agreement of first failure between pairs of subjects and higher predicted risk between those subjects, omitting non-informative pairs.
The Rsquare value is Cox and Snell’s pseudo R-squared and is not very useful.
Tests for nested models
summary() prints three tests for whether the model with the group covariate is better than the one without
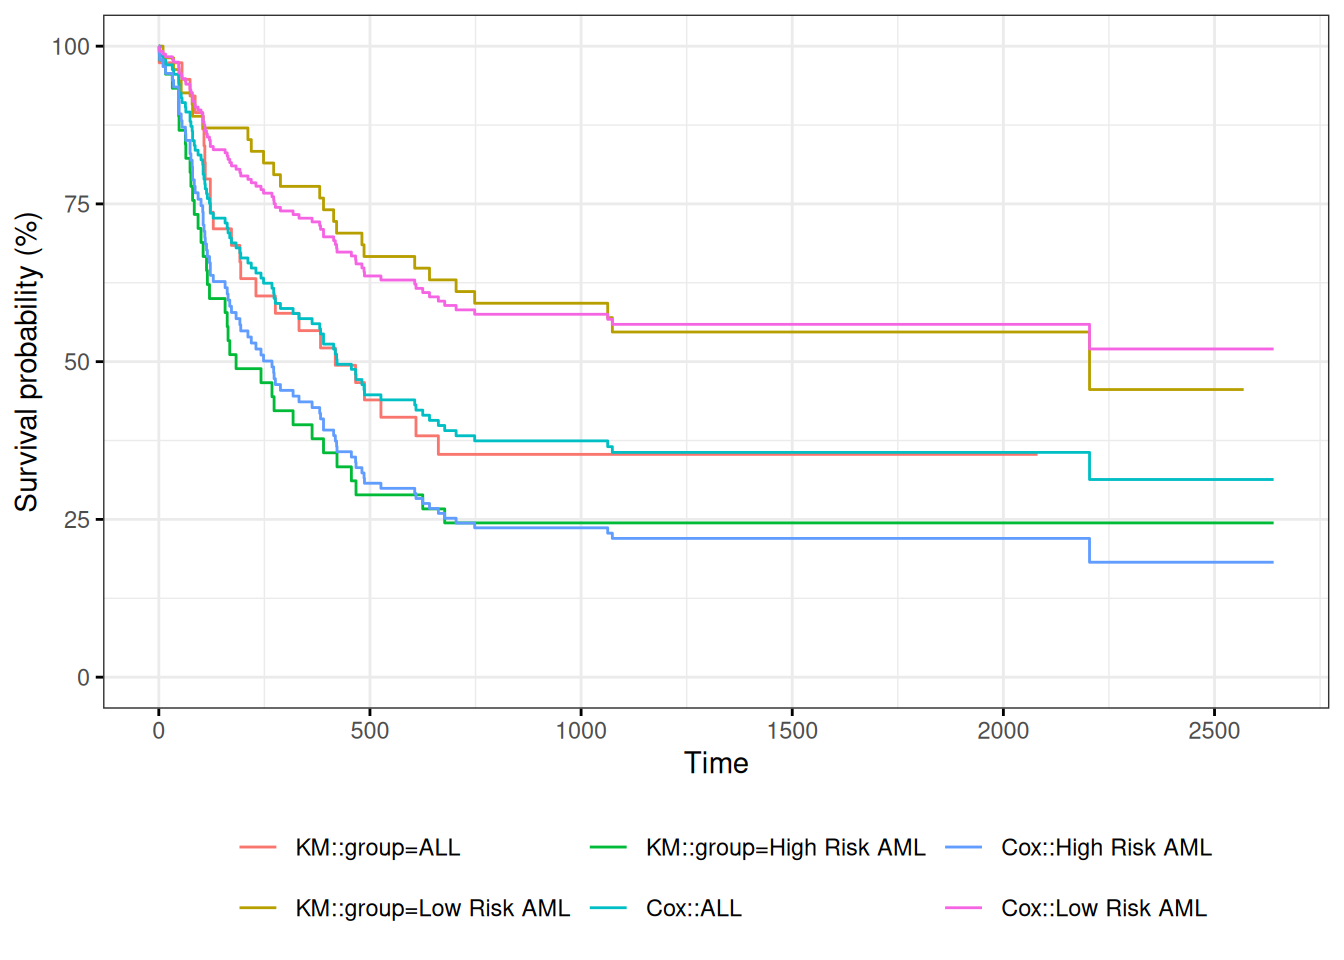
Figure 6: Survival Functions for Three Groups by KM and Cox Model
When we use survfit() with a Cox model, we have to specify the covariate levels we are interested in; the argument newdata should include a data.frame with the same named columns as the predictors in the Cox model and one or more levels of each.
From ?survfit.coxph:
If the newdata argument is missing, a curve is produced for a single “pseudo” subject with covariate values equal to the means component of the fit. The resulting curve(s) almost never make sense, but the default remains due to an unwarranted attachment to the option shown by some users and by other packages. Two particularly egregious examples are factor variables and interactions. Suppose one were studying interspecies transmission of a virus, and the data set has a factor variable with levels (“pig”, “chicken”) and about equal numbers of observations for each. The “mean” covariate level will be 0.5 – is this a flying pig?
Examining survfit
[R code]
survfit(Surv(t2, d3) ~ group, data = bmt)#> Call: survfit(formula = Surv(t2, d3) ~ group, data = bmt)#> #> n events median 0.95LCL 0.95UCL#> group=ALL 38 24 418 194 NA#> group=Low Risk AML 54 25 2204 704 NA#> group=High Risk AML 45 34 183 115 456
At each time \(t_i\) at which more than one of the subjects has an event, let \(d_i\) be the number of events at that time, \(D_i\) the set of subjects with events at that time, and let \(s_i\) be a covariate vector for an artificial subject obtained by adding up the covariate values for the subjects with an event at time \(t_i\). Let \[\overline{\Delta\eta}_i = \beta_1s_{i1}+\cdots+\beta_ps_{ip}\] and \(\bar\theta_i = {\operatorname{exp}\mathopen{}\left\{\overline{\Delta\eta}_i\right\}\mathclose{}}\).
This method is equivalent to treating each event as distinct and using the non-ties formula. It works best when the number of ties is small. It is the default in many statistical packages, including PROC PHREG in SAS.
Efron’s method for ties
The other common method is Efron’s, which is the default in R.
\[L(\beta|T)=
\prod_i \frac{\bar\theta_i}{\prod_{j=1}^{d_i}[\sum_{k \in R(t_i)} \theta_k-\frac{j-1}{d_i}\sum_{k \in D_i} \theta_k]}\] This Efron approximation is closer to the exact discrete partial likelihood when there are many ties.
The third option in R (and an option also in SAS as discrete) is the “exact” method, which is the same one used for matched logistic regression.
Example: Breslow’s method
Suppose as an example we have a time \(t\) where there are 20 individuals at risk and three failures. Let the three individuals have risk parameters \(\theta_1, \theta_2, \theta_3\) and let the sum of the risk parameters of the remaining 17 individuals be \(\theta_R\). Then the factor in the partial likelihood at time \(t\) using Breslow’s method is
as the risk set got smaller with each failure. The exact method roughly averages the results for the six possible orderings of the failures.
Example: Efron’s method
Because the exact failure order among tied event times is unobserved, rather than reducing the denominator by one risk coefficient at each step, Efron’s method reduces it by a uniform fractional amount.
David Rocke’s two Epi 204 lectures on Model Building and Checking for Cox Models (part 1, part 2; slides) use the hodg lymphoma data to cover Schoenfeld residuals and cox.zph(), Cox-Snell and martingale residuals, influence diagnostics, and stratification [1].
7.1hodg Lymphoma Data Set from KMsurv
Participants
43 bone marrow transplant patients at Ohio State University (Avalos 1993)
Variables
dtype: Disease type (Hodgkin’s or non-Hodgkins lymphoma)
gtype: Bone marrow graft type:
allogeneic: from HLA-matched sibling
autologous: from self (prior to chemo)
time: time to study exit
delta: study exit reason (death/relapse vs censored)
wtime: waiting time to transplant (in months)
score: Karnofsky score:
80–100: Able to carry on normal activity and to work; no special care needed.
50–70: Unable to work; able to live at home and care for most personal needs; varying amount of assistance needed.
10–60: Unable to care for self; requires equivalent of institutional or hospital care; disease may be progressing rapidly.
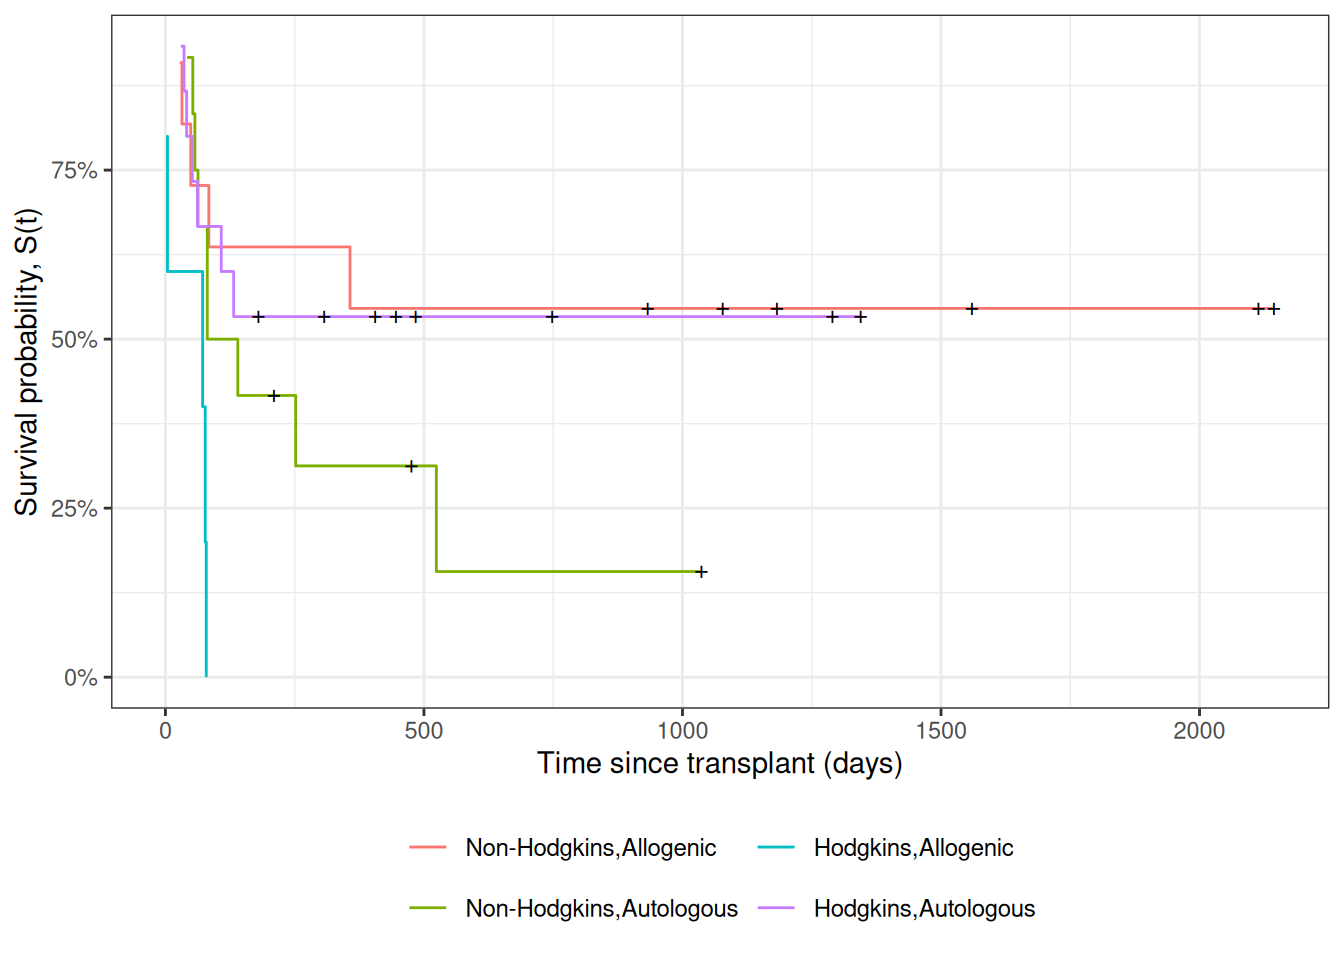
Figure 7: Kaplan-Meier Survival Curves for HOD/NHL and Allo/Auto Grafts
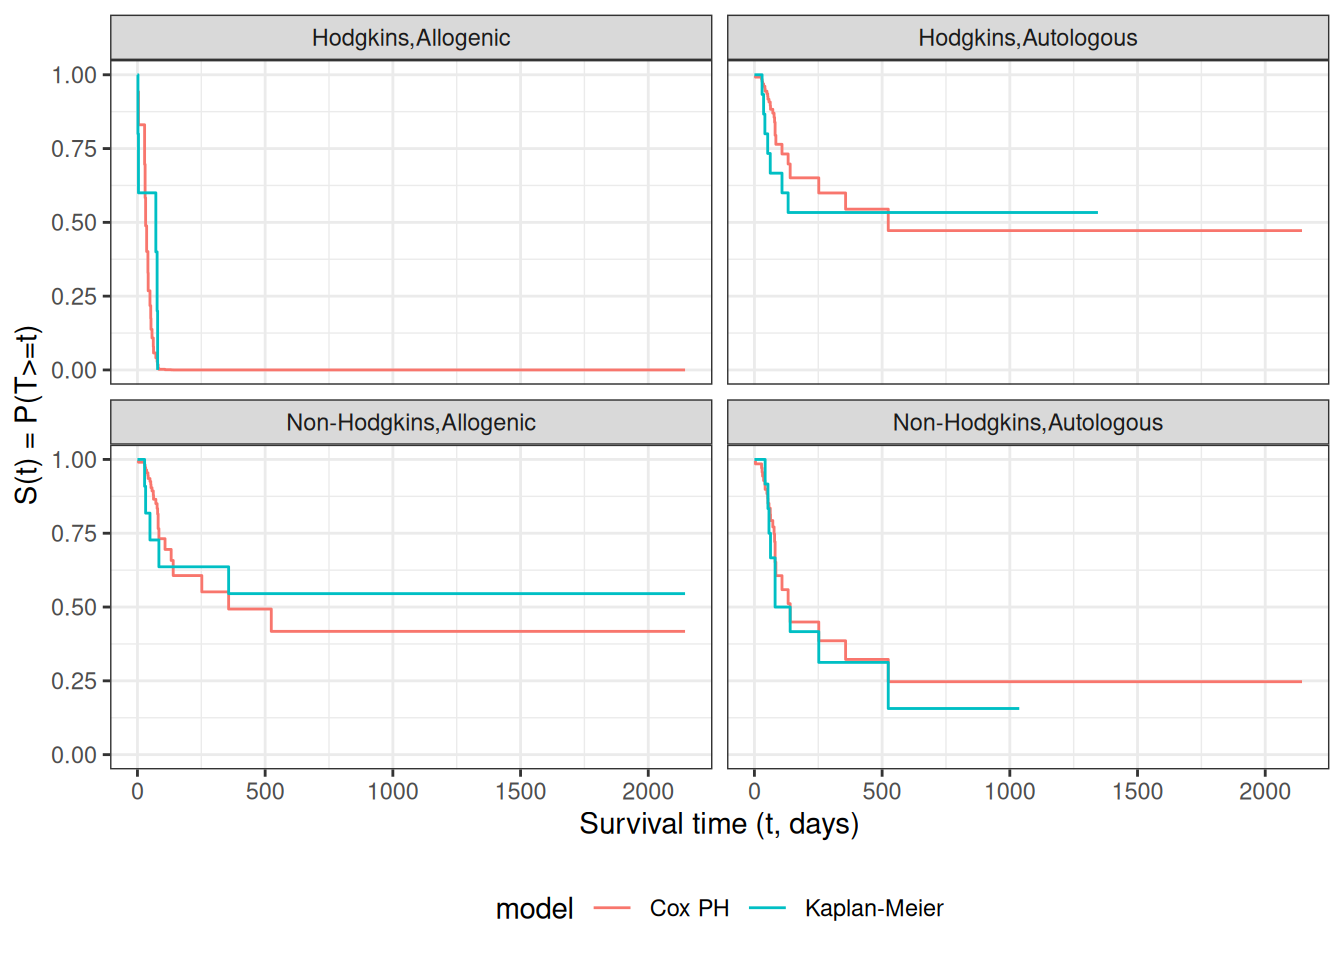
Observed and expected survival curves
[R code]
# we need to create a tibble of covariate patterns;# we will set score and wtime to mean values for disease and graft types:means <- hodg2 |>summarize(.by =c(dtype, gtype),score =mean(score),wtime =mean(wtime) ) |>arrange(dtype, gtype) |>mutate(strata =paste(dtype, gtype, sep =",")) |>as.data.frame()# survfit.coxph() will use the rownames of its `newdata`# argument to label its output:rownames(means) <- means$stratacox_model <- hodg_cox1 |>survfit(data = hodg2, # ggsurvplot() will need thisnewdata = means )
[R code]
# I couldn't find a good function to reformat `cox_model` for ggplot,# so I made my own:stack_surv_ph <-function(cox_model) { cox_model$surv |>as_tibble() |>mutate(time = cox_model$time) |> tidyr::pivot_longer(cols =-time,names_to ="strata",values_to ="surv" ) |>mutate(cumhaz =-log(.data$surv),model ="Cox PH" )}km_and_cph <- km_model |>fortify(surv.connect =TRUE) |>mutate(strata =trimws(strata),model ="Kaplan-Meier",cumhaz =-log(surv) ) |>bind_rows(stack_surv_ph(cox_model))
[R code]
km_and_cph |>ggplot(aes(x = time, y = surv, col = model)) +geom_step() +facet_wrap(~strata) +theme_bw() +ylab("Survival probability, S(t) = P(T>=t)") +xlab("Survival time (t, days)") +theme(legend.position ="bottom")
Observed and expected survival curves for hodg2 data
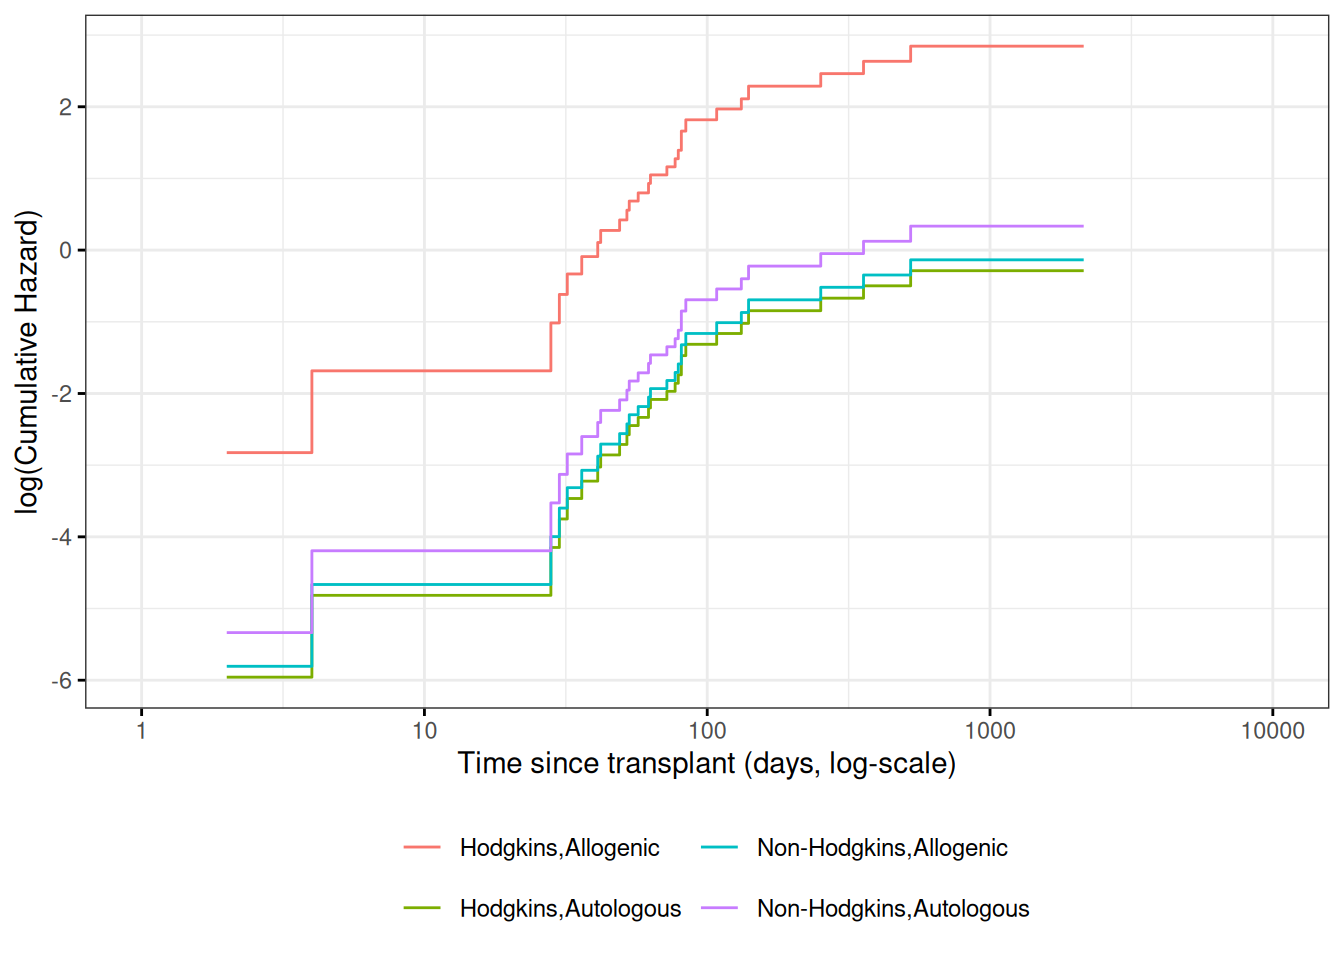
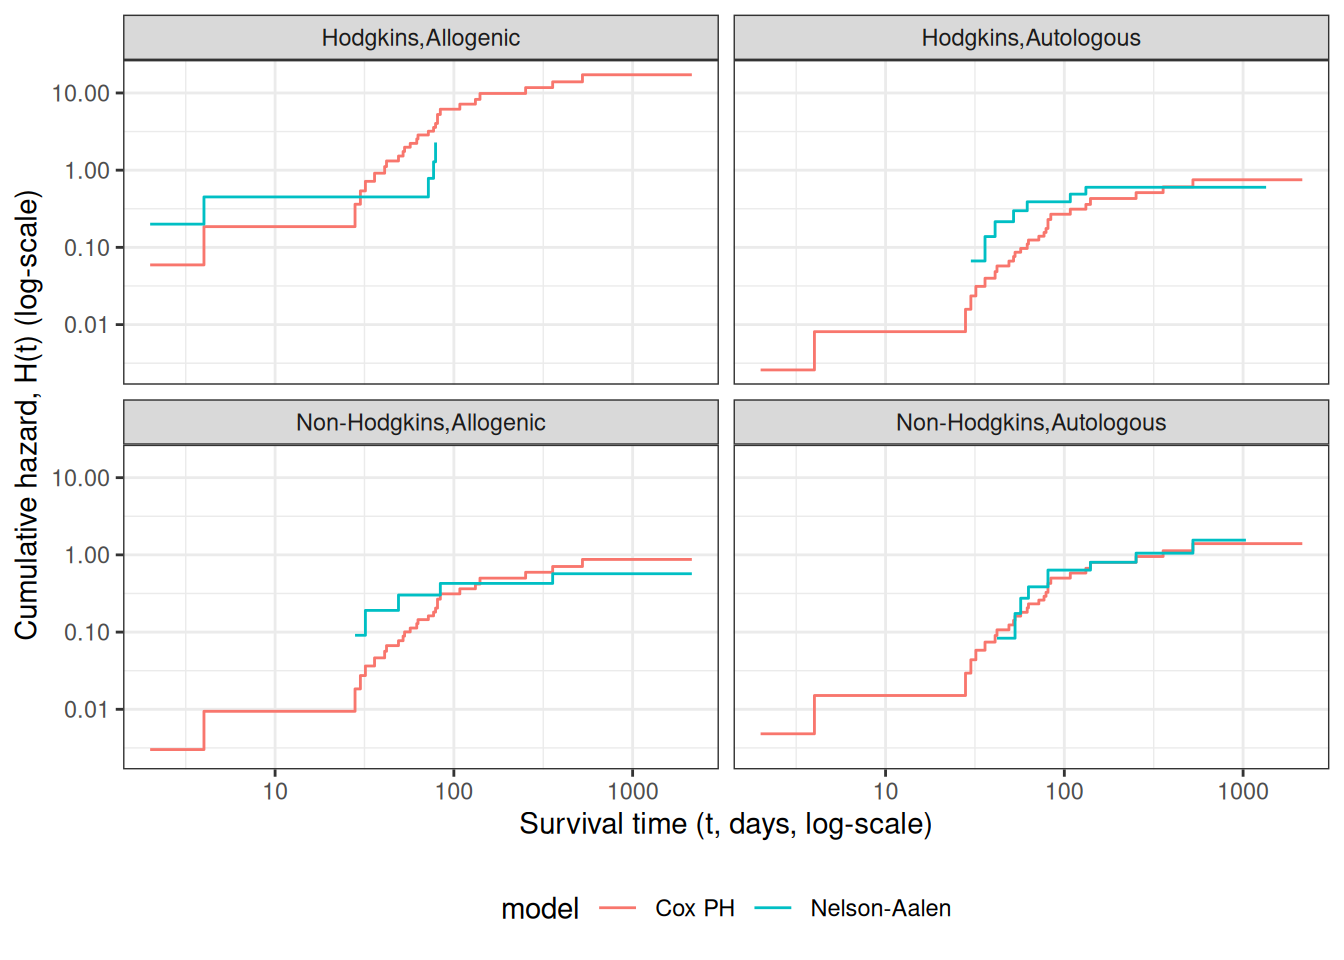
Cumulative hazard (log-scale) curves
Also known as “complementary log-log (clog-log) survival curves”.
[R code]
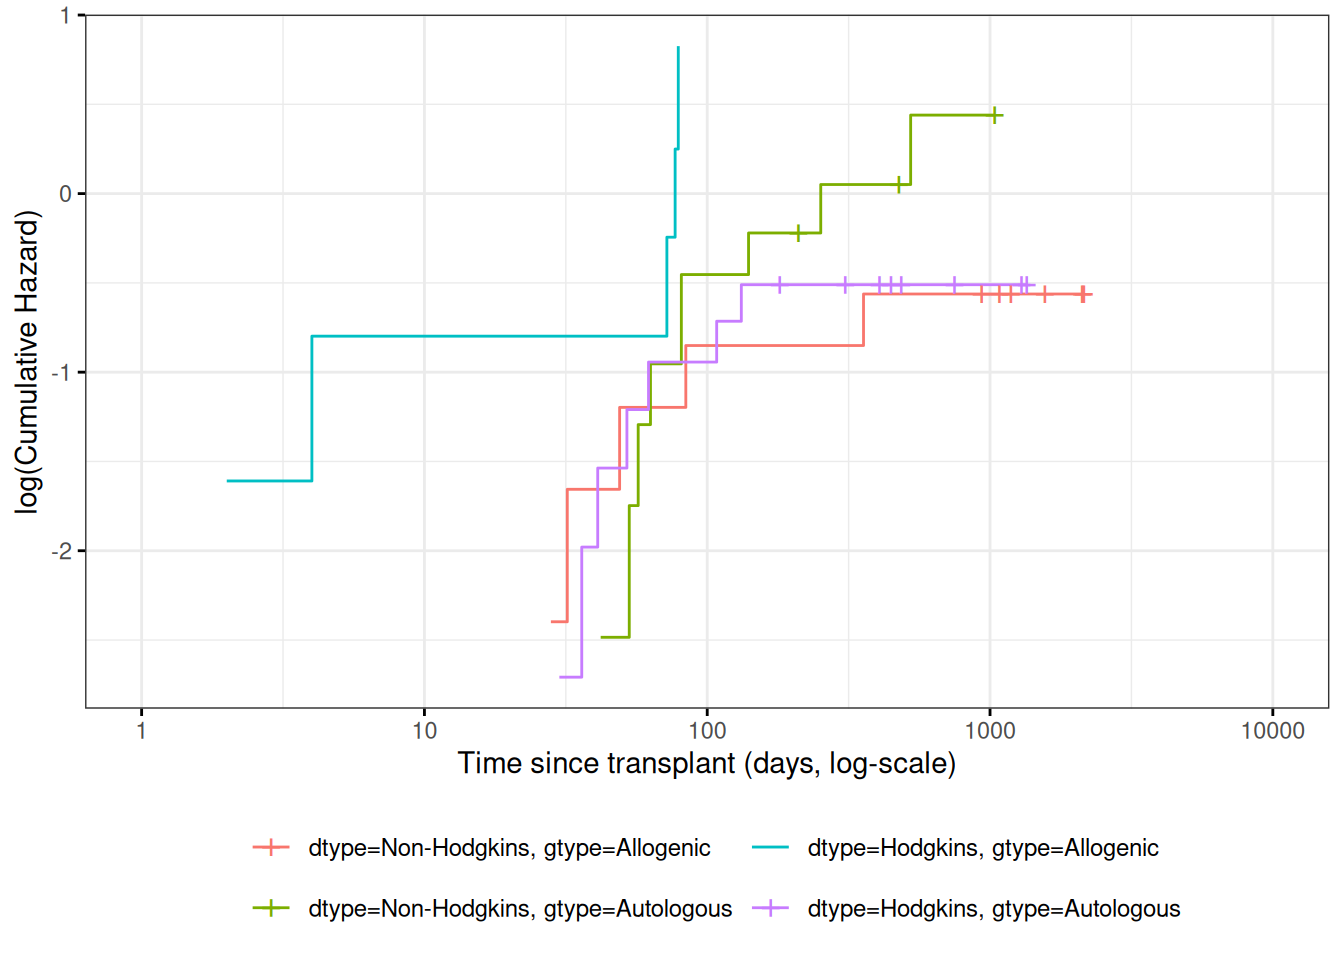
# draw cumulative hazard against time, both on log-spaced axes,# so that the ticks are in days and in units of cumulative hazard# rather than in the logs of those quantities:# (`text_size` is the legend text size;# 9 matches `legend_text_size` in r-config)plot_cloglog <-function(curves, text_size =9) { curves |># log10(0) is not finite, so leave out the time-zero pointsfilter(.data$time >0, .data$cumhaz >0) |>ggplot() +aes(x = .data$time, y = .data$cumhaz, col = .data$strata) +geom_step(linewidth = .5) +theme_bw() +scale_x_continuous(trans ="log10",labels = scales::label_number(drop0trailing =TRUE, big.mark =","),name ="Time since transplant (days, log scale)" ) +scale_y_continuous(trans ="log10",labels = scales::label_number(drop0trailing =TRUE, big.mark =","),name ="Cumulative hazard H(t) (log scale)" ) +theme(legend.position ="bottom", legend.title =element_blank()) +guides(col =guide_legend(ncol =2,label.theme =element_text(size = text_size) ) )}na_model <-survfit(formula = surv ~ dtype + gtype,data = hodg2,type ="fleming")na_model |>fortify(fun ="cumhaz") |># `fortify.survfit()` doesn't name cumhaz correctly:rename(cumhaz = surv) |>mutate(strata =trimws(strata)) |>plot_cloglog()
\(\hat y_i\) estimates the conditional mean of \(y_i\) given the covariate values \(\mathord{\smash[b]{\underset{\raise.3ex\hbox{$\scriptstyle\sim$}}{x}}\vphantom{x}}_i\). This together with the prediction error says that we are predicting the distribution of values of \(y\).
Review: Residuals in Linear Regression
The usual residual is \(r_i=y_i-\hat y_i\), the difference between the actual value of \(y\) and a prediction of its mean.
The residuals are also the quantities the sum of whose squares is being minimized by the least squares/MLE estimation.
Predictions and Residuals in survival models
In survival analysis, the equivalent of \(y_i\) is the event time \(t_i\), which is unknown for the censored observations.
The expected event time can be tricky to calculate:
Suppose a cancer patient is predicted to have a mean lifetime of 5 years after diagnosis and suppose the distribution is exponential.
If we want a 95% interval for survival, the lower end is at the 0.025 percentage point of the exponential which is qexp(.025, rate = 1/5) = 0.126589 years, or 1/40 of the mean lifetime.
The upper end is at the 0.975 point which is qexp(.975, rate = 1/5) = 18.444397 years, or 3.7 times the mean lifetime.
Saying that the survival time is somewhere between 6 weeks and 18 years does not seem very useful, but it may be the best we can do.
For survival analysis, something is like a residual if it is small when the model is accurate or if the accumulation of them is in some way minimized by the estimation algorithm, but there is no exact equivalence to linear regression residuals.
And if there is, they are mostly quite large!
Types of Residuals in Time-to-Event Models
It is often hard to make a decision from graph appearances, though the process can reveal much.
Some diagnostic tests are based on residuals as with other regression methods:
Definition 20 (Estimated Risk Score) The risk score \({\theta_{{\lambda}}\mathopen{}\left(\mathord{\smash[b]{\underset{\raise.3ex\hbox{$\scriptstyle\sim$}}{x}}\vphantom{x}}\right)\mathclose{}}\) (Definition 12) depends on the true, unknown coefficient vector \(\mathord{\smash[b]{\underset{\raise.3ex\hbox{$\scriptstyle\sim$}}{\beta}}\vphantom{\beta}}\). After fitting the model, we estimate it by the estimated risk score, which substitutes the fitted coefficients \(\hat{\mathord{\smash[b]{\underset{\raise.3ex\hbox{$\scriptstyle\sim$}}{\beta}}\vphantom{\beta}}}\) for \(\mathord{\smash[b]{\underset{\raise.3ex\hbox{$\scriptstyle\sim$}}{\beta}}\vphantom{\beta}}\):
Definition 21 (Schoenfeld Residual) For each subject \(i\) who experienced an event (not censored) and for each predictor\(k\), the Schoenfeld residual is defined as [5]:
where \({\mathcal{R}\mathopen{}\left(t_i\right)\mathclose{}}\) is the risk set at event time \(t_i\) of subject \(i\), \(x_{jk}\) is the value of predictor \(k\) for subject \(j\), and \({\hat{\theta}_{{\lambda}}\mathopen{}\left(\mathord{\smash[b]{\underset{\raise.3ex\hbox{$\scriptstyle\sim$}}{x}}\vphantom{x}}_j\right)\mathclose{}}\) is the estimated risk score (Definition 20) for subject \(j\).
From the correlation test, the Karnofsky score and the interaction with graft type disease type induce modest but statistically significant non-proportionality.
The sample size here is relatively small (26 events in 43 subjects). If the sample size is large, very small amounts of non-proportionality can induce a significant result.
As time goes on, autologous grafts are over-represented at their own event times, but those from HOD patients become less represented.
Both the statistical tests and the plots are useful.
7.5 Goodness of Fit using the Cox-Snell Residuals
(references: Klein and Moeschberger [3], §11.2, and Dobson and Barnett [6], §10.6)
hodg2 <- hodg2 |>mutate(cs =predict(hodg_cox1, type ="expected"))surv_csr <-survfit(data = hodg2,formula =Surv(time = cs, event = delta =="dead") ~1,type ="fleming-harrington")autoplot(surv_csr, fun ="cumhaz") +geom_abline(aes(intercept =0, slope =1), col ="red") +theme_bw()
Figure 11: Cumulative Hazard of Cox-Snell Residuals
The line with slope 1 and intercept 0 fits the curve relatively well, so we don’t see lack of fit using this procedure.
7.6 Martingale Residuals
Definition 23 (Martingale Residual) The martingale residual for subject \(i\) is:
\[r^M_i = \delta_i - r^{CS}_i\]
where \(\delta_i = 1\) if subject \(i\) experienced the event (\(0\) if censored) and \(r^{CS}_i = \hat{{\Lambda}}(t_i \mid \mathord{\smash[b]{\underset{\raise.3ex\hbox{$\scriptstyle\sim$}}{x}}\vphantom{x}}_i)\) is the Cox-Snell residual (Definition 22) [3, Sec. 11.3].
Note
Martingale residuals estimate the excess number of events in the data relative to what the model predicted. They are bounded above by \(1\) (a subject who died very early has residual close to \(1 - 0 = 1\)) but unbounded below (a long-lived censored subject in a high-risk group can have a very large negative residual). This asymmetry makes it harder to spot unexpectedly early deaths, motivating the deviance residual.
We will use martingale residuals to examine the functional forms of continuous covariates.
The Martingale Connection
Originally, a martingale referred to a betting strategy where you bet $1 on the first play, then you double the bet if you lose and continue until you win. This strategy seems like a sure thing, because at the end of each series when you finally win, you are up $1. For example, \(-1-2-4-8+16=1\). But this assumes that you have infinite resources. Really, you have a large probability of winning $1, and a small probability of losing everything you have, kind of the opposite of a lottery.
martingale
In probability, a martingale is a sequence of random variables such that the expected value of the next event at any time is the present observed value, and that no better predictor can be derived even with all past values of the series available. At least to a close approximation, the stock market is a martingale. Under the assumptions of the proportional hazards model, the martingale residuals ordered in time form a martingale.
Using Martingale Residuals
Martingale residuals can be used to examine the functional form of a numeric variable.
We fit the model without that variable and compute the martingale residuals.
We then plot these martingale residuals against the values of the variable.
We can see curvature, or a possible suggestion that the variable can be discretized.
Let’s use this to examine the score and wtime variables in the wtime data set.
7.7 Checking for Outliers and Influential Observations
We will check for outliers using the deviance residuals. The martingale residuals show excess events or the opposite, but highly skewed, with the maximum possible value being 1, but the smallest value can be very large negative. Martingale residuals can detect unexpectedly long-lived patients, but patients who die unexpectedly early show up only in the deviance residual. Influence will be examined using dfbeta in a similar way to linear regression, logistic regression, or Poisson regression.
Deviance Residuals
Definition 24 (Deviance Residual) The deviance residual for subject \(i\) is defined as [3, Sec. 11.3]:
where \({\operatorname{sign}\mathopen{}\left\{\cdot\right\}\mathclose{}}\) is the sign function, \(r_i^M\) is the martingale residual (Definition 23), and \(r_i^{CS}\) is the Cox-Snell residual (Definition 22).
Computing residuals
[R code]
hodg_mart <-residuals(hodg_cox2, type ="martingale")hodg_dev <-residuals(hodg_cox2, type ="deviance")hodg_dfb <-residuals(hodg_cox2, type ="dfbeta")hodg_preds <-predict(hodg_cox2) # linear predictor
Figure 13: Deviance Residuals vs. Linear Predictor
The two largest deviance residuals are observations 1 and 29. Worth examining.
dfbeta
Definition 25 (dfbeta) The dfbeta for observation \(i\) is the approximate change in the coefficient vector \(\hat{\mathord{\smash[b]{\underset{\raise.3ex\hbox{$\scriptstyle\sim$}}{\beta}}\vphantom{\beta}}}\) if subject \(i\) were removed from the data: \[\text{dfbeta}_i \approx \hat{\mathord{\smash[b]{\underset{\raise.3ex\hbox{$\scriptstyle\sim$}}{\beta}}\vphantom{\beta}}}- \hat{\mathord{\smash[b]{\underset{\raise.3ex\hbox{$\scriptstyle\sim$}}{\beta}}\vphantom{\beta}}}_{(-i)}\] computed via a one-step Newton approximation rather than a full refit [3, Sec. 11.4].
Definition 26 (dfbetas) The dfbetas for observation \(i\) standardizes the dfbeta (Definition 25) by the estimated standard error of each coefficient: \[\text{dfbetas}_{ik} = \text{dfbeta}_{ik} / {\mathop{\widehat{\operatorname{se}}}\nolimits\mathopen{}\left(\hat{\beta}_k\right)\mathclose{}}\]
Figure 16: dfbeta Values by Observation Order for Karnofsky Score
The two highest dfbeta values for score are observations 1 and 18. The next three are observations 17, 29, and 19. The smallest value is observation 2.
Waiting time (dichotomized)
[R code]
data.frame(obs =seq_len(nrow(hodg_dfb)), dfbeta = hodg_dfb[, 4]) |>ggplot(aes(x = obs, y = dfbeta)) +geom_point() +geom_hline(yintercept =0, linetype ="dashed") +theme_bw() +xlab("Observation Index") +ylab("dfbeta for Waiting Time < 80")
Figure 17: dfbeta Values by Observation Order for Waiting Time (dichotomized)
The two large values of dfbeta for dichotomized waiting time are observations 15 and 16. This behavior may have to do with the discretization of waiting time.
hodg2[c(1, 15, 16, 18, 29), ] |>select(gtype, dtype, time, delta, score, wtime) |>mutate(comment =c("early death, good score, low risk","high risk grp, long wait, poor score","high risk grp, short wait, poor score","early death, good score, med risk grp","early death, good score, med risk grp" ) )
Action Items
Unusual points may need checking, particularly if the data are not completely cleaned. In this case, observations 15 and 16 may show some trouble with the dichotomization of waiting time, but it still may be useful.
The two largest residuals seem to be due to unexpectedly early deaths, but unfortunately this phenomenon can occur.
If hazards don’t look proportional, then we may need to use strata, between which the base hazards are permitted to be different. For this problem, the natural strata are the two diseases, because they could need to be managed differently anyway.
A main point that we want to be sure of is the relative risk difference by disease type and graft type.
We will analyze remission survival times on 42 leukemia patients, half on new treatment, half on standard treatment.
This dataset is the same data as the drug6mp data from KMsurv, but with two other variables and without the pairing. This version comes from Kleinbaum and Klein [7] (e.g., p281):
Figure 23: Cumulative hazard (cloglog scale) for anderson data
This issue can be fixed by using strata or possibly by other model alterations.
The Stratified Cox Model
In a stratified Cox model, each stratum, defined by one or more factors, has its own base survival function\({\lambda}_0(t)\).
But the coefficients for each variable not used in the strata definitions are assumed to be the same across strata.
To check if this assumption is reasonable one can include interactions with strata and see if they are significant (this specification may generate a warning and NA lines, but these warnings and NA lines can be ignored).
Since the sex variable shows possible non-proportionality, we try stratifying on sex.
We don’t have enough evidence to tell the difference between these two models.
Conclusions
We chose to use a stratified model because of the apparent non-proportionality of the hazard for the sex variable.
When we fit interactions with the strata variable, we did not get an improved model (via the likelihood ratio test).
So we use the stratifed model with coefficients that are the same across strata.
Another Modeling Approach
We used an additive model without interactions and saw that we might need to stratify by sex.
Instead, we could try to improve the model’s functional form - maybe the interaction of treatment and sex is real, and after fitting that we might not need separate hazard functions.
David Rocke’s Epi 204 lecture Time-Dependent Covariates and Multiple Events (slides) covers time-dependent covariates in the bmt data with the counting-process formulation, and recurrent events in the bladder cancer data with robust variance estimates [1].
This dataset comes from the Copelan et al. [8] study of allogenic bone marrow transplant therapy for acute myeloid leukemia (AML) and acute lymphoblastic leukemia (ALL).
Outcomes (endpoints)
The main endpoint is disease-free survival (t2 and d3) for the three risk groups, “ALL”, “AML Low Risk”, and “AML High Risk”.
Possible intermediate events
graft vs. host disease (GVHD), an immunological rejection response to the transplant (bad)
acute (AGVHD)
chronic (CGVHD)
platelet recovery, a return of platelet count to normal levels (good)
One or the other, both in either order, or neither may occur.
Covariates
We are interested in possibly using the covariatesz1-z10 to adjust for other factors.
In addition, the time-varying covariates for acute GVHD, chronic GVHD, and platelet recovery may be useful.
Preprocessing
We reformat the data before analysis:
[R code]
# reformat the data:bmt1 <- bmt |>as_tibble() |>mutate(# `id` will be used to connect multiple records for the same individual:id = dplyr::row_number(),group = group |>case_match(1~"ALL",2~"Low Risk AML",3~"High Risk AML" ) |>factor(levels =c("ALL", "Low Risk AML", "High Risk AML")),`patient age`= z1,`donor age`= z2,`patient sex`= z3 |>case_match(0~"Female",1~"Male" ),`donor sex`= z4 |>case_match(0~"Female",1~"Male" ),`Patient CMV Status`= z5 |>case_match(0~"CMV Negative",1~"CMV Positive" ),`Donor CMV Status`= z6 |>case_match(0~"CMV Negative",1~"CMV Positive" ),`Waiting Time to Transplant`= z7,FAB = z8 |>case_match(1~"Grade 4 Or 5 (AML only)",0~"Other" ) |>factor() |>relevel(ref ="Other"),hospital = z9 |># `z9` is hospitalcase_match(1~"Ohio State University",2~"Alferd",3~"St. Vincent",4~"Hahnemann" ) |>factor() |>relevel(ref ="Ohio State University"),MTX = (z10 ==1) # a prophylatic treatment for GVHD ) |>select(-(z1:z10)) # don't need these anymorebmt1 |>select(group, id:MTX) |>print(n =10)#> # A tibble: 137 × 12#> group id `patient age` `donor age` `patient sex` `donor sex`#> <fct> <int> <int> <int> <chr> <chr> #> 1 ALL 1 26 33 Male Female #> 2 ALL 2 21 37 Male Male #> 3 ALL 3 26 35 Male Male #> 4 ALL 4 17 21 Female Male #> 5 ALL 5 32 36 Male Male #> 6 ALL 6 22 31 Male Male #> 7 ALL 7 20 17 Male Female #> 8 ALL 8 22 24 Male Female #> 9 ALL 9 18 21 Female Male #> 10 ALL 10 24 40 Male Male #> # ℹ 127 more rows#> # ℹ 6 more variables: `Patient CMV Status` <chr>, `Donor CMV Status` <chr>,#> # `Waiting Time to Transplant` <int>, FAB <fct>, hospital <fct>, MTX <lgl>
Time-Dependent Covariates
A time-dependent covariate (“TDC”) is a covariate whose value changes during the course of the study.
For variables like age that change in a linear manner with time, we can just use the value at the start.
But it may be plausible that when and if GVHD occurs, the risk of relapse or death increases, and when and if platelet recovery occurs, the risk decreases.
Analysis in R
We form a variable precovery which is = 0 before platelet recovery and is = 1 after platelet recovery, if it occurs.
For each subject where platelet recovery occurs, we set up multiple records (lines in the data frame); for example one from t = 0 to the time of platelet recovery, and one from that time to relapse, recovery, or death.
We do the same for acute GVHD and chronic GVHD.
For each record, the covariates are constant.
[R code]
bmt2 <- bmt1 |># set up new long-format data set:tmerge(bmt1, id = id, tstop = t2) |># the following three steps can be in any order,# and will still produce the same result:# add aghvd as tdc:tmerge(bmt1, id = id, agvhd =tdc(ta)) |># add cghvd as tdc:tmerge(bmt1, id = id, cgvhd =tdc(tc)) |># add platelet recovery as tdc:tmerge(bmt1, id = id, precovery =tdc(tp))bmt2 <- bmt2 |>as_tibble() |>mutate(status =as.numeric((tstop == t2) & d3))# status only = 1 if at end of t2 and not censored
Let’s see how we’ve rearranged the first row of the data:
[R code]
bmt1 |> dplyr::filter(id ==1) |> dplyr::select(id, t1, d1, t2, d2, d3, ta, da, tc, dc, tp, dp)
The event times for this individual are:
t = 0 time of transplant
tp = 13 platelet recovery
ta = 67 acute GVHD onset
tc = 121 chronic GVHD onset
t2 = 2081 end of study, patient not relapsed or dead
After converting the data to long-format, we have:
Note that status could have been 1 on the last row, indicating that relapse or death occurred; since it is false, the participant must have exited the study without experiencing relapse or death (i.e., they were censored).
Event sequences
Let:
A = acute GVHD
C = chronic GVHD
P = platelet recovery
Each of the eight possible combinations of A or not-A, with C or not-C, with P or not-P occurs in this data set.
A always occurs before C, and P always occurs before C, if both occur.
Thus there are ten event sequences in the data set: None, A, C, P, AC, AP, PA, PC, APC, and PAC.
In general, there could be as many as \(1+3+(3)(2)+6=16\) sequences, but our domain knowledge tells us that some are missing: CA, CP, CAP, CPA, PCA, PC, PAC
Different subjects could have 1, 2, 3, or 4 intervals, depending on which of acute GVHD, chronic GVHD, and/or platelet recovery occurred.
The final interval for any subject has status = 1 if the subject relapsed or died at that time; otherwise status = 0.
Any earlier intervals have status = 0.
Even though there might be multiple lines per ID in the dataset, there is never more than one event, so no alterations need be made in the estimation procedures or in the interpretation of the output.
The function tmerge in the survival package eases the process of constructing the new long-format dataset.
Neither acute GVHD (agvhd) nor chronic GVHD (cgvhd) has a statistically significant effect here, nor are they significant in models with the other one removed.
The bladder cancer dataset from Kleinbaum and Klein [7] contains recurrent event outcome information for eighty-six cancer patients followed for the recurrence of bladder cancer tumor after transurethral surgical excision (Byar and Green 1980). The exposure of interest is the effect of the drug treatment of thiotepa. Control variables are the initial number and initial size of tumors. The data layout is suitable for a counting processes approach.
This drug is still a possible choice for some patients. Another therapeutic choice is Bacillus Calmette-Guerin (BCG), a live bacterium related to cow tuberculosis.
Data dictionary
Variables in the bladder dataset
Variable
Definition
id
Patient unique ID
status
for each time interval: 1 = recurred, 0 = censored
interval
1 = first recurrence, etc.
intime
`tstop - tstart (all times in months)
tstart
start of interval
tstop
end of interval
tx
treatment code, 1 = thiotepa
num
number of initial tumors
size
size of initial tumors (cm)
There are 85 patients and 190 lines in the dataset, meaning that many patients have more than one line.
Patient 1 with 0 observation time was removed.
Of the 85 patients, 47 had at least one recurrence and 38 had none.
18 patients had exactly one recurrence.
There were up to 4 recurrences in a patient.
Of the 190 intervals, 112 terminated with a recurrence and 78 were censored.
Different intervals for the same patient are correlated.
Is the effective sample size 47 or 112? This difference might narrow confidence intervals by as much as a factor of \(\sqrt{112/47}=1.54\)
What happens if I have 5 treatment and 5 control values and want to do a t-test and I then duplicate the 10 values as if the sample size was 20? This falsely narrows confidence intervals by a factor of \(\sqrt{2}=1.41\).
bladder <- bladder |>mutate(surv =Surv(time = start,time2 = stop,event = event,type ="counting" ) )bladder_cox1 <-coxph(formula = surv ~ tx + num + size,data = bladder)# results with biased variance-covariance matrix:summary(bladder_cox1)#> Call:#> coxph(formula = surv ~ tx + num + size, data = bladder)#> #> n= 190, number of events= 112 #> #> coef exp(coef) se(coef) z Pr(>|z|) #> tx -0.4116 0.6626 0.1999 -2.06 0.03947 * #> num 0.1637 1.1778 0.0478 3.43 0.00061 ***#> size -0.0411 0.9598 0.0703 -0.58 0.55897 #> ---#> Signif. codes: 0 '***' 0.001 '**' 0.01 '*' 0.05 '.' 0.1 ' ' 1#> #> exp(coef) exp(-coef) lower .95 upper .95#> tx 0.663 1.509 0.448 0.98#> num 1.178 0.849 1.073 1.29#> size 0.960 1.042 0.836 1.10#> #> Concordance= 0.624 (se = 0.032 )#> Likelihood ratio test= 14.7 on 3 df, p=0.002#> Wald test = 15.9 on 3 df, p=0.001#> Score (logrank) test = 16.2 on 3 df, p=0.001
Note
The likelihood ratio and score tests assume independence of observations within a cluster. The Wald and robust score tests do not.
adding cluster = id
If we add cluster= id to the call to coxph, the coefficient estimates don’t change, but we get an additional column in the summary() output: robust se:
[R code]
bladder_cox2 <-coxph(formula = surv ~ tx + num + size,cluster = id,data = bladder)# unbiased though this reduces power:summary(bladder_cox2)#> Call:#> coxph(formula = surv ~ tx + num + size, data = bladder, cluster = id)#> #> n= 190, number of events= 112 #> #> coef exp(coef) se(coef) robust se z Pr(>|z|) #> tx -0.4116 0.6626 0.1999 0.2488 -1.65 0.0980 . #> num 0.1637 1.1778 0.0478 0.0584 2.80 0.0051 **#> size -0.0411 0.9598 0.0703 0.0742 -0.55 0.5799 #> ---#> Signif. codes: 0 '***' 0.001 '**' 0.01 '*' 0.05 '.' 0.1 ' ' 1#> #> exp(coef) exp(-coef) lower .95 upper .95#> tx 0.663 1.509 0.407 1.08#> num 1.178 0.849 1.050 1.32#> size 0.960 1.042 0.830 1.11#> #> Concordance= 0.624 (se = 0.031 )#> Likelihood ratio test= 14.7 on 3 df, p=0.002#> Wald test = 11.2 on 3 df, p=0.01#> Score (logrank) test = 16.2 on 3 df, p=0.001, Robust = 10.8 p=0.01#> #> (Note: the likelihood ratio and score tests assume independence of#> observations within a cluster, the Wald and robust score tests do not).
robust se is larger than se, and accounts for the repeated observations from the same individuals:
Definition 27 (Competing Risks Data)Competing risks data arise when multiple events can occur, and follow-up can end due to occurrence of one or more of those types of events, precluding observation of at least one of the other event types.
Competing risks are common in medical research. For example, in a study of bone fracture risk in elderly men, participants may:
Experience the event of interest (fracture)
Die before experiencing a fracture (competing event)
Be lost to follow-up or reach the end of the study period (censored)
Why Competing Risks Matter
When analyzing time-to-event data, standard survival analysis methods make assumptions about censoring. The independent censoring assumption assumes that the future risk of censored observations can be represented by those who remain under follow-up.
This assumption is reasonable for:
Administrative censoring (end of study)
Loss to follow-up (if unrelated to outcome risk)
However, this assumption is questionable for competing events like death, because:
We cannot extrapolate beyond participant lifetimes
Death fundamentally alters the risk set for the primary outcome
Projecting to a setting “without death” creates a hypothetical population
Approaches to Analyzing Competing Risks Data
Two main approaches exist for analyzing competing risks:
Elimination approach: Extrapolates to a scenario where a competing event is not possible (appropriate for losses to follow-up)
Accommodation approach: Acknowledges and allows for the competing risks in the analysis (appropriate for death and other true competing events)
Notation for Competing Risks
We denote competing risks outcome data using two variables:
\(Y\): time of the first observed event of any type
\(\delta = k\): if the \(k\)-th event type occurs first
where each of the \(K\) possible types of failure are denoted by a numerical code.
Example coding scheme:
0: loss to follow-up (censored)
1: event of interest (e.g., fracture)
2: competing event (e.g., death)
A participant followed for 18 months who dies before experiencing a fracture would have \(Y = 18\) months and \(\delta = 2\).
Summaries for Competing Risks Data
Cause-Specific Hazard Functions
Definition 28 (Cause-Specific Hazard Function) The cause-specific hazard function for event type \(k\), denoted \(h_k(t)\), is the short-term rate at which participants experience the onset of the \(k\)-th event among those who have not yet experienced the event of interest or a competing event prior to time \(t\).
Key properties:
The numerator counts only events of type \(k\)
The denominator includes all participants who could have developed the event by time \(t\)
Reduces to the ordinary hazard function when there is only one failure type
Estimation:
To estimate and model cause-specific hazard functions:
Set up data as ordinary survival data
Define the \(k\)-th failure type as the only “event”
Treat all competing causes (including death) as “censored”
Definition 29 (Cumulative Incidence Function) The cumulative incidence function (CIF) for cause type \(k\) at time \(t\), denoted \(F_k(t)\), is the proportion of the population who have experienced the \(k\)-th event prior to time \(t\).
The cumulative incidence function:
Measures the prevalence of a particular event at each time \(t\)
Accounts for all competing risks
Differs from cause-specific hazards in how it treats competing events
Interpretation (MrOS study):
In the MrOS study, at 5 years of follow-up:
8% of men had experienced a hip fracture
9.3% had died without a fracture
82.7% remained alive without fracture
Estimation of Cumulative Incidence
The cumulative incidence at time \(t\) is calculated as:
\({\mathop{\hat{\operatorname{S}}}\nolimits_{\text{KM}}\mathopen{}\left(t_{i-1}\right)\mathclose{}}\) is the Kaplan-Meier estimate of event-free survival just before time \(t_i\)
The estimation proceeds in steps:
Calculate the overall event-free probability at each time point using the Kaplan-Meier method (combining all event types)
For each time interval, calculate the probability of a new type-\(k\) event as:
Probability of being event-free at the start of the interval
Times the rate of type-\(k\) events during the interval
The cumulative incidence is the cumulative sum of these time-specific probabilities
Numerical Example: MrOS Study
The mros dataset from the rmb package contains data from the Osteoporotic Fractures in Men (MrOS) study [11], a prospective cohort study of older men. The outcome variable is coded as:
0: censored (no fracture or death during follow-up)
1: hip fracture (event of interest)
2: death without fracture (competing event)
[R code]
ggplot(cif_df) +aes(x = time, y = cif, color = event) +geom_step() +labs(x ="Years of follow-up",y ="Cumulative incidence",color ="Event type",caption ="Data: rmb::mros (MrOS study, Orwoll et al. 2005)" ) +scale_y_continuous(limits =c(0, 0.20)) +theme_bw() +theme(legend.position ="bottom")
Figure 24
At approximately 5 years of follow-up:
About 8% of men had experienced a hip fracture
About 9.3% had died without a fracture
These two cumulative incidences sum to less than the overall event probability because many men are still event-free at 5 years.
Naive vs. Proper Cumulative Incidence
A naive approach treats competing events as censored and uses the standard Kaplan-Meier method: \(1 - {\mathop{\hat{\operatorname{S}}}\nolimits_{\text{KM}}\mathopen{}\left(t\right)\mathclose{}}\). This naive Kaplan-Meier approach overestimates the true cumulative incidence because it assumes censored individuals (including those who died) have the same risk as those still event-free.
[R code]
# Naive KM estimate for fracture (treating death as censored)km_naive <-survfit(Surv(years, status ==1) ~1,data = mros_data)naive_df <-tibble(time = km_naive$time,cif =1- km_naive$surv,method ="Naive KM (1 - S(t))")proper_df <- fracture_cif |>mutate(method ="Proper CIF")comparison_df <-bind_rows(naive_df, proper_df)ggplot(comparison_df) +aes(x = time, y = cif, color = method) +geom_step() +labs(x ="Years of follow-up",y ="Estimated probability of fracture",color ="Method",caption ="Data: rmb::mros (MrOS study)" ) +scale_y_continuous(limits =c(0, 0.15)) +theme_bw() +theme(legend.position ="bottom")
Figure 25
The naive KM curve overestimates the probability of fracture because it imagines a hypothetical world without competing mortality. The proper CIF curve represents the actual clinical probability of experiencing a fracture.
Modeling Competing Risks
When analyzing competing risks data with predictors, two main approaches are available:
Cause-Specific Hazards Models
Fit separate Cox models for each event type, treating other event types as censored:
D. R. Cox, “Regression models and life-tables,”Journal of the Royal Statistical Society: Series B (Methodological), vol. 34, no. 2, pp. 187–202, 1972.
[3]
J. P. Klein and M. L. Moeschberger, Survival analysis: Techniques for censored and truncated data, vol. 1230. Springer, 2003. Available: https://link.springer.com/book/10.1007/b97377
[4]
S. Johansen, “An extension of cox’s regression model,”International Statistical Review / Revue Internationale de Statistique, vol. 51, no. 2, pp. 165–174, 1983, doi: 10.2307/1402746.
[5]
P. M. Grambsch and T. M. Therneau, “Proportional hazards tests and diagnostics based on weighted residuals,”Biometrika, vol. 81, no. 3, pp. 515–526, 1994, Available: https://doi.org/10.1093/biomet/81.3.515
[6]
A. J. Dobson and A. G. Barnett, An introduction to generalized linear models, 4th ed. CRC press, 2018. Available: https://doi.org/10.1201/9781315182780
E. A. Copelan et al., “Treatment for acute myelocytic leukemia with allogeneic bone marrow transplantation following preparation with BuCy2,” 1991, doi: 10.1182/blood.V78.3.838.838.
E. Vittinghoff, D. V. Glidden, S. C. Shiboski, and C. E. McCulloch, Regression methods in biostatistics: Linear, logistic, survival, and repeated measures models, 2nd ed. Springer, 2012. Available: https://doi.org/10.1007/978-1-4614-1353-0
[11]
E. Orwoll et al., “Design and baseline characteristics of the osteoporotic fractures in men (MrOS) study – a large observational study of the determinants of fracture in older men,”Contemporary Clinical Trials, vol. 26, no. 5, pp. 569–585, 2005, doi: 10.1016/j.cct.2005.04.005.
[12]
J. P. Fine and R. J. Gray, “A proportional hazards model for the subdistribution of a competing risk,”Journal of the American Statistical Association, vol. 94, no. 446, pp. 496–509, 1999, doi: 10.1080/01621459.1999.10474144.