Functions from these packages will be used throughout this document:
[R code]
library(conflicted) # check for conflicting function definitions# printr is not loaded here: it inserts help-file output into markdown outputlibrary(rmarkdown) # Convert R Markdown documents into a variety of formats.library(pander) # format tables for markdownlibrary(ggplot2) # graphicslibrary(ggfortify) # help with graphicslibrary(dplyr) # manipulate datalibrary(tibble) # `tibble`s extend `data.frame`slibrary(magrittr) # `%>%` and other additional piping toolslibrary(haven) # import Stata fileslibrary(knitr) # format R output for markdownlibrary(tidyr) # Tools to help to create tidy datalibrary(plotly) # interactive graphicslibrary(dobson) # datasets from Dobson and Barnett 2018library(parameters) # format model output tables for markdownlibrary(haven) # import Stata fileslibrary(latex2exp) # use LaTeX in R code (for figures and tables)library(fs) # filesystem path manipulationslibrary(survival) # survival analysislibrary(survminer) # survival analysis graphicslibrary(KMsurv) # datasets from Klein and Moeschbergerlibrary(parameters) # format model output tables forlibrary(webshot2) # convert interactive content to static for pdflibrary(forcats) # functions for categorical variables ("factors")library(stringr) # functions for dealing with stringslibrary(lubridate) # functions for dealing with dates and times# Summarizes key information about statistical objects in tidy tibbleslibrary(broom)# Provides suite of functions to work with regression model# `broom::tidy()` tibbleslibrary(broom.helpers)
Here are some R settings I use in this document:
[R code]
rm(list =ls()) # delete any data that's already loaded into Rconflicts_prefer(dplyr::filter)ggplot2::theme_set( ggplot2::theme_bw() +# ggplot2::labs(col = "") + ggplot2::theme(legend.position ="bottom",text = ggplot2::element_text(size =12, family ="serif") ))knitr::opts_chunk$set(message =FALSE)options(digits =6)panderOptions("big.mark", ",")pander::panderOptions("table.emphasize.rownames", FALSE)pander::panderOptions("table.split.table", Inf)# use the `filter()` function from dplyr() by defaultconflicts_prefer(dplyr::filter)legend_text_size <-9run_graphs <-TRUE
See also Hernán and Robins [2] for a comprehensive treatment of causal inference from observational data.
1 Introduction
Regression models describe statistical associations between variables. But in many research settings, the goal is not merely to describe associations but to estimate causal effects: what would happen if we intervened to change a variable?
The causal inference framework covered in this chapter is based on the potential outcomes model [3], [4]. This framework provides:
A precise language for defining causal effects
Explicit assumptions required to identify causal effects from data
Before turning to causal questions, it helps to separate them from descriptive ones.
Suppose we want to know how heavy a cow will be if it eats grass all summer. This question is a descriptive question about the conditional distribution of weight given diet, \(\operatorname{p}(Y = y \mid X = \text{grass})\), where \(Y\) is weight and \(X\) is diet. We have not asked how heavy a cow would be if we intervened to make it eat grass all summer.
Suppose we find some cows eating grass and others eating hay. We can observe the weights of the grass-fed cows and the weights of the hay-fed cows, but we cannot observe what would have happened if we had made the grass-fed cows eat hay instead. Would they have weighed the same as the cows we found eating hay? Several things could make the answer no:
the two groups might differ in breed;
the way the cows ended up with their diets might matter: perhaps the bigger cows chased the smaller ones off the grass.
We can answer causal questions of this kind, but we generally need to answer the descriptive questions first. Descriptive questions do not require covariates that we could intervene on; they only require covariates that we can observe. This hypothetical example illustrates the distinction that the potential outcomes framework of this chapter makes precise.
The same distinction arises with binary outcomes, where the descriptive summary is often a risk difference: the difference between the proportions of two groups who experience the outcome.
Example 1 (A crude risk difference that reverses within age groups) Consider a hypothetical population of 1000 adults, with a binary treatment \(A\) (\(A = 1\) for treated), a binary outcome \(Y\) (\(Y = 1\) for death within a year), and a binary covariate \(L\) (\(L = 1\) for age 65 or older). Older adults are more likely to be treated, and older adults are also more likely to die, whether or not they are treated:
\(L\)
treated
untreated
\({\mathbb{P}\mathopen{}\left(Y = 1 \mid A = 1, L\right)\mathclose{}}\)
\({\mathbb{P}\mathopen{}\left(Y = 1 \mid A = 0, L\right)\mathclose{}}\)
0 (younger)
100
500
0.05
0.10
1 (older)
300
100
0.30
0.40
Within each age group, the treated have lower risk than the untreated:
\[
\begin{aligned}
\text{RD}_{L = 0}
&\stackrel{\text{def}}{=}{\mathbb{P}\mathopen{}\left(Y = 1 \mid A = 1, L = 0\right)\mathclose{}} - {\mathbb{P}\mathopen{}\left(Y = 1 \mid A = 0, L = 0\right)\mathclose{}}
&& \text{(define the age-specific risk difference)} \\
&= 0.05 - 0.10
&& \text{(substitute from the table)} \\
&= -0.05
&& \text{(subtract)} \\
\text{RD}_{L = 1}
&\stackrel{\text{def}}{=}{\mathbb{P}\mathopen{}\left(Y = 1 \mid A = 1, L = 1\right)\mathclose{}} - {\mathbb{P}\mathopen{}\left(Y = 1 \mid A = 0, L = 1\right)\mathclose{}}
&& \text{(define the age-specific risk difference)} \\
&= 0.30 - 0.40
&& \text{(substitute from the table)} \\
&= -0.10
&& \text{(subtract)}
\end{aligned}
\]
Ignoring age, the risk in each treatment group averages the age-specific risks in proportion to that group’s own age distribution:
The crude risk difference of \(+0.0875\) is a correct descriptive answer: in this population, treated adults really did die more often than untreated adults. It is a misleading answer to the causal question “would treating someone raise or lower their risk?”, because 75% of the treated group is older, compared with about 17% of the untreated group. If age were the only factor that influenced both who was treated and who died, the age-specific risk differences (\(-0.05\) and \(-0.10\)) would compare like with like, and they say that treatment lowers risk. The rest of this chapter makes precise when a comparison of this kind has a causal interpretation.
2 Potential Outcomes
The fundamental challenge in causal inference is that we can only observe one potential outcome for each unit: the outcome under the treatment that actually occurred. This unobservability of counterfactual outcomes is called the fundamental problem of causal inference[3].
Definition 1 (Potential outcomes (counterfactual outcomes)) For a binary treatment \(A \in \{0, 1\}\), the potential outcomes for unit \(i\) are:
\(Y_i(1)\): the outcome that would be observed if unit \(i\) received treatment (\(A_i = 1\))
\(Y_i(0)\): the outcome that would be observed if unit \(i\) received control (\(A_i = 0\))
These potential outcomes are also called counterfactual outcomes, because for each unit, one of them is necessarily counterfactual (it corresponds to a treatment that did not occur).
Definition 2 (Observed outcome) The observed outcome for unit \(i\) is the potential outcome corresponding to the treatment actually received: \[Y_i \stackrel{\text{def}}{=}Y_i(A_i) = A_i \cdot Y_i(1) + (1 - A_i) \cdot Y_i(0)\]
Remark 1 (Observed and potential outcomes: the consistency assumption). This relationship between observed and potential outcomes is sometimes called the consistency assumption: the observed outcome under the observed treatment equals the potential outcome under that treatment.
Definition 3 (Individual causal effect) The individual causal effect for unit \(i\) is the difference between that unit’s two potential outcomes: \[\tau_i \stackrel{\text{def}}{=}Y_i(1) - Y_i(0)\]
Example 2 (Potential outcomes and observed outcomes in a toy sample) Consider a sample of three individuals being evaluated for a medication (\(A \in \{0, 1\}\)) where the outcome\(Y\) is blood pressure reduction (mmHg):
Unit \(i\)
\(Y_i(0)\)
\(Y_i(1)\)
\(\tau_i = Y_i(1) - Y_i(0)\)
Observed \(A_i\)
Observed \(Y_i\)
1
5
15
+10
1
15
2
2
8
+6
0
2
3
10
12
+2
1
12
For unit 1 (\(A_1 = 1\)), we observe \(Y_1 = Y_1(1) = 15\), while \(Y_1(0) = 5\) is unobserved (counterfactual). For unit 2 (\(A_2 = 0\)), we observe \(Y_2 = Y_2(0) = 2\), while \(Y_2(1) = 8\) is counterfactual. Because only one potential outcome is observed per unit, we cannot directly calculate \(\tau_i\) for any individual in real data.
Remark 2 (Individual causal effects are not identified). Because of the fundamental problem of causal inference, we can never observe both \(Y_i(1)\) and \(Y_i(0)\) for the same unit, so individual causal effects are generally not identified.
Definition 4 (Average Treatment Effect (ATE)) The Average Treatment Effect is the expected difference in potential outcomes in the study population: \[\text{ATE} \stackrel{\text{def}}{=}{\mathbb{E}\mathopen{}\left[Y(1) - Y(0)\right]\mathclose{}} = {\mathbb{E}\mathopen{}\left[Y(1)\right]\mathclose{}} - {\mathbb{E}\mathopen{}\left[Y(0)\right]\mathclose{}}\]
Remark 3 (Interpretation of the ATE). The ATE represents the average causal effect of treatment compared with control, averaged over all units in the population (both those who would and would not actually receive treatment).
Definition 5 (Average Treatment Effect on the Treated (ATT)) The Average Treatment Effect on the Treated is the expected difference in potential outcomes among units who actually received treatment: \[\text{ATT} \stackrel{\text{def}}{=}{\mathbb{E}\mathopen{}\left[Y(1) - Y(0) \mid A = 1\right]\mathclose{}} = {\mathbb{E}\mathopen{}\left[Y(1) \mid A = 1\right]\mathclose{}} - {\mathbb{E}\mathopen{}\left[Y(0) \mid A = 1\right]\mathclose{}}\]
Remark 4 (Interpretation of the ATT). The ATT answers the question: “On average, how much did treatment help the people who received it?”
Definition 6 (Average Treatment Effect on the Untreated (ATU)) The Average Treatment Effect on the Untreated is the expected difference in potential outcomes among units who did not receive treatment: \[\text{ATU} \stackrel{\text{def}}{=}{\mathbb{E}\mathopen{}\left[Y(1) - Y(0) \mid A = 0\right]\mathclose{}} = {\mathbb{E}\mathopen{}\left[Y(1) \mid A = 0\right]\mathclose{}} - {\mathbb{E}\mathopen{}\left[Y(0) \mid A = 0\right]\mathclose{}}\]
Example 3 (Calculating population-level causal estimands in a toy population) Revisiting the three-unit population from Example 2:
ATT: Average over treated units (\(i = 1, 3\)): \(\frac{\tau_1 + \tau_3}{2} = \frac{10 + 2}{2} = +6.0\).
ATU: Average over untreated units (\(i = 2\)): \(\frac{\tau_2}{1} = +6.0\).
In this toy population, treatment effect heterogeneity exists (\(\tau_i\) varies across units), but because average gains happen to balance across treatment groups, ATE = ATT = ATU. In general observational datasets with selection bias, ATT and ATU often differ markedly from ATE.
Remark 5 (Interpretation of the ATU). The ATU answers the question: “On average, how much would treatment have helped the people who did not receive it?”
4 Causal Assumptions
Three key assumptions are required to identify causal effects from observed data [2]:
4.1 Consistency
Definition 7 (Consistency) The consistency assumption states that the observed outcome for a treated unit equals that unit’s potential outcome under treatment, and similarly for control: \[Y_i \stackrel{\text{def}}{=}Y_i(A_i)\]
Remark 6 (Well-defined treatment and violations of consistency). Consistency requires that the treatment is well-defined: there is only one version of treatment, or different versions have the same effect on the outcome. Violations of consistency (e.g., different doses of a drug being lumped together as “treated”) can introduce bias.
4.2 Exchangeability (No Unmeasured Confounding)
Definition 8 (Exchangeability (no unmeasured confounding, ignorability))Exchangeability (also called no unmeasured confounding or ignorability) states that, conditional on observed covariates \(\mathord{\smash[b]{\underset{\raise.3ex\hbox{$\scriptstyle\sim$}}{L}}\vphantom{L}}\), treatment assignment is independent of potential outcomes: \[A \perp\!\!\!\perp (Y(0), Y(1)) \mid \mathord{\smash[b]{\underset{\raise.3ex\hbox{$\scriptstyle\sim$}}{L}}\vphantom{L}}\]
Remark 7 (Interpretation of exchangeability). Intuitively, exchangeability means that among individuals with the same covariate values, treatment was assigned as if at random — there are no unmeasured common causes of treatment and outcome.
Definition 9 (Unconditional exchangeability)Unconditional exchangeability (\(A \perp\!\!\!\perp (Y(0), Y(1))\)) holds in perfectly randomized trials. Exchangeability conditional on \(\mathord{\smash[b]{\underset{\raise.3ex\hbox{$\scriptstyle\sim$}}{L}}\vphantom{L}}\) (Definition 8) requires adjusting for \(\mathord{\smash[b]{\underset{\raise.3ex\hbox{$\scriptstyle\sim$}}{L}}\vphantom{L}}\).
Example 4 (A population where exchangeability holds only within strata) Consider a large population of 1000 patients, with a binary covariate \(L\) (disease severity: \(L = 1\) for severe) and treatment \(A\). Severe patients are more likely to be treated, and both potential outcomes are higher for severe patients (treating proportions as probabilities):
Within each severity stratum, suppose treatment was assigned as if at random, so that \(A \perp\!\!\!\perp(Y(0), Y(1)) \mid L\): conditional exchangeability (Definition 8) holds with \(\mathord{\smash[b]{\underset{\raise.3ex\hbox{$\scriptstyle\sim$}}{L}}\vphantom{L}} = L\).
Unconditional exchangeability (Definition 9) fails, though. Averaging \(Y(0)\) over the strata in proportion to each treatment group’s members:
\[
\begin{aligned}
{\mathbb{E}\mathopen{}\left[Y(0) \mid A = 1\right]\mathclose{}}
&= \frac{120 \cdot 8 + 280 \cdot 18}{400}
&& \text{(average over the 400 treated)} \\
&= \frac{960 + 5040}{400}
&& \text{(multiply)} \\
&= 15
&& \text{(add and divide)} \\
{\mathbb{E}\mathopen{}\left[Y(0) \mid A = 0\right]\mathclose{}}
&= \frac{480 \cdot 8 + 120 \cdot 18}{600}
&& \text{(average over the 600 untreated)} \\
&= \frac{3840 + 2160}{600}
&& \text{(multiply)} \\
&= 10
&& \text{(add and divide)}
\end{aligned}
\]
The treated group would have had a higher mean outcome even without treatment, because it contains more severe patients, so \(A\) is not independent of \(Y(0)\).
4.3 Positivity
Definition 10 (Positivity) The positivity assumption states that every individual has a positive probability of receiving each treatment level, at every covariate value \(\mathord{\smash[b]{\underset{\raise.3ex\hbox{$\scriptstyle\sim$}}{l}}\vphantom{l}}\) in the support of \(\mathord{\smash[b]{\underset{\raise.3ex\hbox{$\scriptstyle\sim$}}{L}}\vphantom{L}}\): \[0 < {\mathbb{P}\mathopen{}\left(A = 1 \mid \mathord{\smash[b]{\underset{\raise.3ex\hbox{$\scriptstyle\sim$}}{L}}\vphantom{L}} = \mathord{\smash[b]{\underset{\raise.3ex\hbox{$\scriptstyle\sim$}}{l}}\vphantom{l}}\right)\mathclose{}} < 1
\quad \text{for all } \mathord{\smash[b]{\underset{\raise.3ex\hbox{$\scriptstyle\sim$}}{l}}\vphantom{l}} \text{ in the support of } \mathord{\smash[b]{\underset{\raise.3ex\hbox{$\scriptstyle\sim$}}{L}}\vphantom{L}}\]
Remark 8 (Why positivity is needed). Without positivity, some subgroups have no treated (or untreated) members, making it impossible to estimate the counterfactual outcome for those subgroups.
Definition 11 (Positivity violation) A failure of positivity is sometimes called a positivity violation. When near-zero probabilities occur in small strata, the failure is called a practical positivity violation.
Example 5 (Checking positivity) In the population of Example 4, \({\mathbb{P}\mathopen{}\left(A = 1 \mid L = 0\right)\mathclose{}} = 0.2\) and \({\mathbb{P}\mathopen{}\left(A = 1 \mid L = 1\right)\mathclose{}} = 0.7\). Both probabilities lie strictly between 0 and 1, so positivity (Definition 10) holds: each severity stratum contains both treated and untreated patients.
If instead every severe patient were treated, then \({\mathbb{P}\mathopen{}\left(A = 1 \mid L = 1\right)\mathclose{}} = 1\), the population would contain no untreated severe patients, and the data could not tell us what \({\mathbb{E}\mathopen{}\left[Y(0) \mid L = 1\right]\mathclose{}}\) is: a positivity violation (Definition 11).
5 Randomized Experiments
In a randomized controlled trial (RCT), treatment is assigned by the investigator using a random mechanism, independent of any characteristics of the participants. Randomization makes the treatment groups exchangeable: the distribution of potential outcomes is the same in treated and untreated groups.
As a result, in a perfectly randomized trial, the observed group means identify the mean potential outcomes:
Theorem 1 (Identification of the ATE under randomization) If consistency and unconditional exchangeability hold, and \(0 < {\mathbb{P}\mathopen{}\left(A = 1\right)\mathclose{}} < 1\), then for each treatment level \(a \in \mathopen{}\left\{0, 1\right\}\mathclose{}\),
\[{\mathbb{E}\mathopen{}\left[Y(a)\right]\mathclose{}} = {\mathbb{E}\mathopen{}\left[Y \mid A = a\right]\mathclose{}}\]
and therefore
\[\text{ATE} = {\mathbb{E}\mathopen{}\left[Y \mid A = 1\right]\mathclose{}} - {\mathbb{E}\mathopen{}\left[Y \mid A = 0\right]\mathclose{}} \tag{1}\]
Proof. For treatment level \(a\):
\[
\begin{aligned}
{\mathbb{E}\mathopen{}\left[Y(a)\right]\mathclose{}}
&= {\mathbb{E}\mathopen{}\left[Y(a) \mid A = a\right]\mathclose{}}
&& \text{(unconditional exchangeability: } Y(a) \perp\!\!\!\perp A \text{)} \\
&= {\mathbb{E}\mathopen{}\left[Y \mid A = a\right]\mathclose{}}
&& \text{(consistency: } Y = Y(a) \text{ when } A = a \text{)}
\end{aligned}
\]
where the condition \(0 < {\mathbb{P}\mathopen{}\left(A = 1\right)\mathclose{}} < 1\) makes both conditioning events \(\mathopen{}\left\{A = 1\right\}\mathclose{}\) and \(\mathopen{}\left\{A = 0\right\}\mathclose{}\) have positive probability. Substituting into the ATE:
\[
\begin{aligned}
\text{ATE}
&= {\mathbb{E}\mathopen{}\left[Y(1)\right]\mathclose{}} - {\mathbb{E}\mathopen{}\left[Y(0)\right]\mathclose{}}
&& \text{(definition of ATE)} \\
&= {\mathbb{E}\mathopen{}\left[Y \mid A = 1\right]\mathclose{}} - {\mathbb{E}\mathopen{}\left[Y \mid A = 0\right]\mathclose{}}
&& \text{(apply the first result with } a = 1 \text{ and } a = 0 \text{)}
\end{aligned}
\]
Example 6 (Randomizing the severity example) Suppose the 1000 patients of Example 4 had instead been randomized, each treated with probability 0.5 regardless of severity. Then each treatment group has the population’s severity mix, 60% non-severe and 40% severe (treating proportions as probabilities), so by consistency
\[
\begin{aligned}
{\mathbb{E}\mathopen{}\left[Y \mid A = 1\right]\mathclose{}}
&= 0.6 \cdot 10 + 0.4 \cdot 20
&& \text{(severity mix of the treated; } {\mathbb{E}\mathopen{}\left[Y(1) \mid L\right]\mathclose{}} \text{)} \\
&= 14
&& \text{(multiply and add)} \\
{\mathbb{E}\mathopen{}\left[Y \mid A = 0\right]\mathclose{}}
&= 0.6 \cdot 8 + 0.4 \cdot 18
&& \text{(severity mix of the untreated; } {\mathbb{E}\mathopen{}\left[Y(0) \mid L\right]\mathclose{}} \text{)} \\
&= 12
&& \text{(multiply and add)}
\end{aligned}
\]
and Equation 1 gives \(\text{ATE} = 14 - 12 = 2\), the treatment’s effect in every stratum.
Example 7 (Without exchangeability, the naive contrast is biased) In the population of Example 4, treatment was not randomized, so Theorem 1 does not apply. The observed group means are
\[
\begin{aligned}
{\mathbb{E}\mathopen{}\left[Y \mid A = 1\right]\mathclose{}}
&= \frac{120 \cdot 10 + 280 \cdot 20}{400}
&& \text{(consistency; average over the treated)} \\
&= \frac{1200 + 5600}{400}
&& \text{(multiply)} \\
&= 17
&& \text{(add and divide)} \\
{\mathbb{E}\mathopen{}\left[Y \mid A = 0\right]\mathclose{}}
&= 10
&& \text{(consistency; } {\mathbb{E}\mathopen{}\left[Y(0) \mid A = 0\right]\mathclose{}} = 10 \text{ in that population)}
\end{aligned}
\]
so the naive contrast Equation 1 would give \(17 - 10 = 7\). But the treatment raises each patient’s mean outcome by exactly 2 in both strata (\(10 - 8 = 20 - 18 = 2\)), so the true ATE is 2. The extra 5 units come from the severe patients’ over-representation among the treated: confounding by \(L\).
In a randomized trial, therefore, the observed mean difference between treatment groups is an unbiased estimate of the ATE:
The “heart and estrogen/progestin study” (HERS) was a clinical trial of hormone therapy for prevention of recurrent heart attacks and death among 2,763 post-menopausal women with existing coronary heart disease (CHD) [5].
The trial was conducted at 20 US clinical centers. Participants were randomized to receive either conjugated equine estrogens (0.625 mg/day) plus medroxyprogesterone acetate (2.5 mg/day) or a matching placebo [5]. Women were followed for a sample mean of 4.1 years [5].
The primary outcome was nonfatal myocardial infarction or CHD death [5].
In HERS, hormone therapy (HT) was randomized, so the treatment groups were exchangeable at baseline. The observed difference in CHD event rates between the HT and placebo groups estimates the causal effect of HT.
Despite observational studies suggesting up to 35–80% fewer recurrent CHD events among hormone users than non-users, [5], HERS found no significant difference in CHD event rates between the hormone therapy (HT) and placebo groups (relative hazard 0.99; 95% CI: 0.80–1.22) [5].
The HERS investigators noted a statistically significant time trend: more CHD events occurred in the HT group in year 1, while fewer occurred in years 4 and 5, suggesting that HT may have early harmful effects that are later reversed.
A key finding was that HT significantly altered lipid profiles:
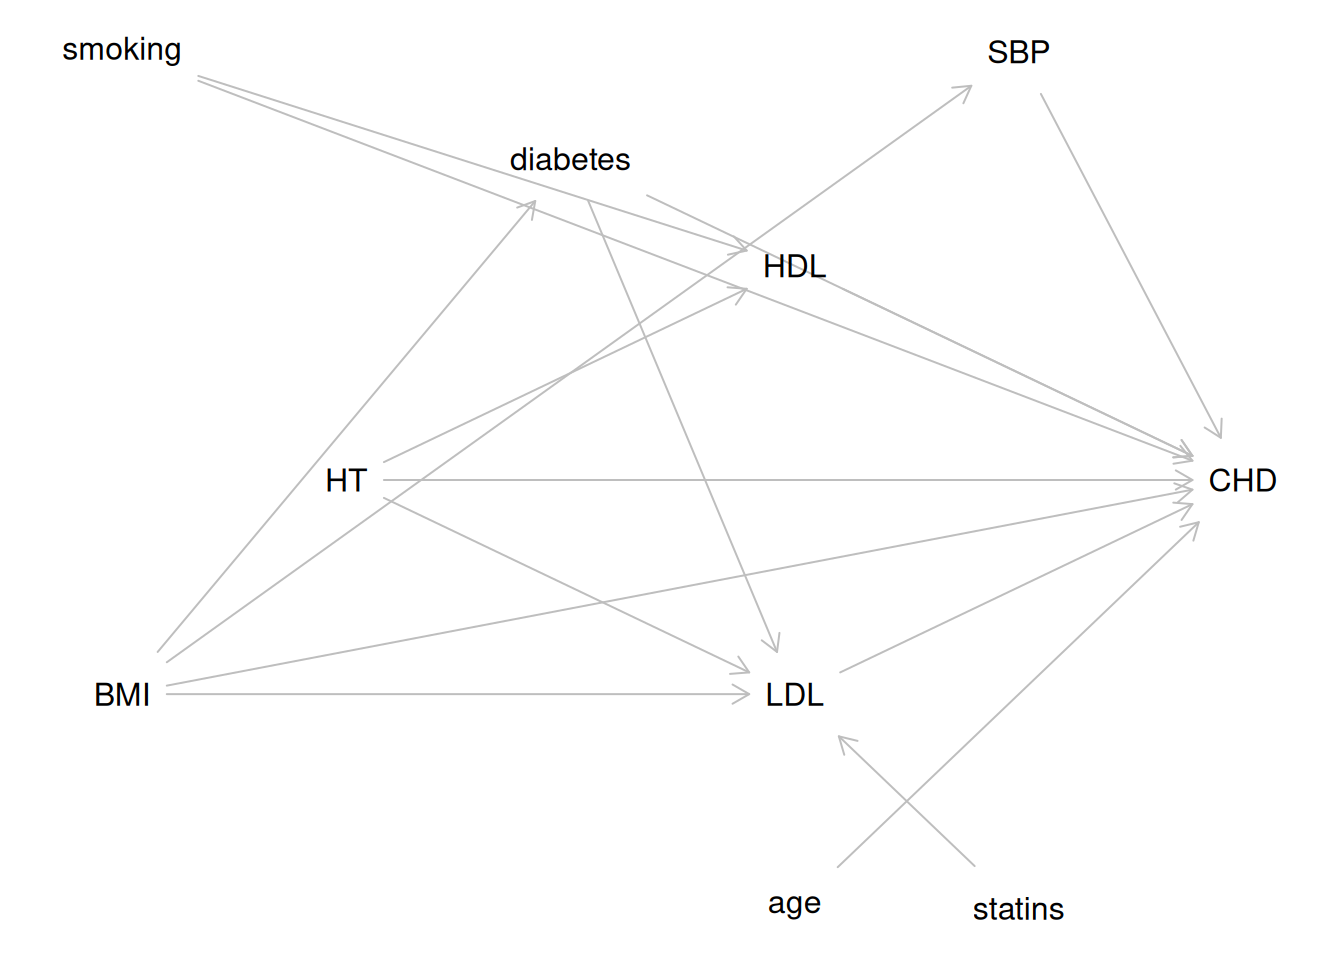
Yet these favorable lipid changes did not translate into fewer CHD events overall. One explanation consistent with the DAG in Figure 1 is that the effects of HT on lipids (a mediator pathway) were offset by other, harmful pathways — possibly thrombotic — that are not captured in the lipid mediators.
5.2 Covariate adjustment in RCTs
Although randomization ensures no confounding, adjusting for baseline covariates in an RCT can still be useful:
Improved precision: Adjusting for strong predictors of the outcome reduces residual variance and narrows confidence intervals.
Covariate imbalance: When randomization produces chance imbalances in small trials, adjustment can correct for these baseline differences.
However, in an RCT, covariates that are mediators of the treatment effect (i.e., variables affected by treatment) should generally not be adjusted for when estimating the total causal effect of treatment. Adjusting for mediators blocks part of the causal pathway and gives only the direct effect of treatment.
In an observational study, treatment is not assigned by the investigator. Instead, individuals self-select into treatment, or treatment is assigned based on clinical or administrative criteria. As a result, treatment groups may differ systematically in ways that also affect the outcome — this systematic difference is called confounding.
6.1 Confounding
Definition 12 (Confounding)Confounding occurs when there is a common cause of both the treatment \(A\) and the outcome \(Y\). This common cause is called a confounder.
Remark 9 (Confounding in the potential outcomes framework). In the potential outcomes framework, confounding means that treatment assignment is not independent of potential outcomes: \[A \not\perp\!\!\!\perp (Y(0), Y(1))\]
As a result, the observed association between \(A\) and \(Y\) does not equal the causal effect of \(A\) on \(Y\).
Example 8 (Confounding of coffee and lung cancer by smoking) Consider a hypothetical cohort of 1000 adults, with coffee drinking \(A\) (\(A = 1\) for daily coffee), lung cancer \(Y\) (\(Y = 1\) for diagnosis during follow-up), and smoking \(L\) (\(L = 1\) for smokers). Suppose coffee has no effect on lung cancer, so that \(Y_i(1) = Y_i(0)\) for every individual, but smokers are both more likely to drink coffee and more likely to develop lung cancer:
\(L\)
coffee
no coffee
\({\mathbb{P}\mathopen{}\left(Y = 1 \mid A = 1, L\right)\mathclose{}}\)
\({\mathbb{P}\mathopen{}\left(Y = 1 \mid A = 0, L\right)\mathclose{}}\)
0 (nonsmokers)
200
500
0.01
0.01
1 (smokers)
200
100
0.10
0.10
Within each smoking stratum, the risk difference is \(0\), matching the true (null) causal effect. Ignoring smoking:
The crude risk difference of \(0.03\) suggests that coffee is harmful, even though coffee has no effect in this cohort. Because \(Y_i(0) = Y_i(1) = Y_i\) for everyone here, the crude risks are also the mean potential outcomes under no coffee in each group: \({\mathbb{E}\mathopen{}\left[Y(0) \mid A = 1\right]\mathclose{}} = 0.055 \neq 0.025 = {\mathbb{E}\mathopen{}\left[Y(0) \mid A = 0\right]\mathclose{}}\). So \(A \not\perp\!\!\!\perp Y(0)\), which is the failure of unconditional exchangeability described in Remark 9. Smoking \(L\) is a confounder: it is a common cause of \(A\) and \(Y\).
6.2 Why observational studies are harder than randomized trials
In a randomized experiment, the investigator controls treatment assignment, so the identification assumptions hold by design [2, Ch. 3]:
randomization makes the groups exchangeable without conditioning on any covariates (Definition 9);
the randomization probabilities are strictly between 0 and 1, so positivity holds;
the protocol specifies the treatment, which supports consistency.
In an observational study, none of these assumptions is guaranteed by design [2, Ch. 3]:
exchangeability (Definition 8) can hold at best conditionally on measured covariates \(\mathord{\smash[b]{\underset{\raise.3ex\hbox{$\scriptstyle\sim$}}{L}}\vphantom{L}}\), so we must measure and adjust for a sufficient set of confounders, and we cannot check from the data that no confounder is missing;
positivity (Definition 10) can fail when some covariate patterns, such as the most severe patients, are always (or never) treated;
consistency (Definition 7) requires a well-defined treatment, which is harder to ensure when “treatment” is a self-chosen exposure, such as “drinks coffee” in Example 8, that people can take up in many different ways.
Directed Acyclic Graphs (DAGs) help with the first of these difficulties, by showing which covariates must be in \(\mathord{\smash[b]{\underset{\raise.3ex\hbox{$\scriptstyle\sim$}}{L}}\vphantom{L}}\). More generally, DAGs provide a formal graphical tool for representing causal assumptions and identifying confounders, mediators, colliders, and sufficient adjustment sets.
6.3 Directed Acyclic Graphs (DAGs)
A Directed Acyclic Graph (DAG) is a graphical model that encodes assumed causal relationships among variables.
In a DAG:
Nodes represent variables.
Directed edges (arrows) represent direct causal effects.
The graph is acyclic: there are no directed cycles (a variable cannot cause itself, even indirectly).
Identify mediators that should generally not be adjusted for when estimating the total causal effect.
Identify colliders that should not be adjusted for (adjusting for a collider opens a non-causal path).
6.4 Key concepts from DAG theory
Definition 13 (Confounder) A confounder of the relationship between an exposure \(X\) and outcome\(Y\) is a variable \(C\) that is a common cause of both \(X\) and \(Y\).
Remark 10 (Confounders compared with mediators). Unlike a confounder (Definition 13), a mediator lies on the causal path from \(X\) to \(Y\) and is not a common cause of \(X\) and \(Y\).
Adjusting for confounders removes confounding bias.
Definition 14 (Mediator) A mediator\(M\) is a variable that lies on the causal pathway from the exposure \(X\) to the outcome \(Y\): \[X \to M \to Y\]
Remark 11 (Adjusting for a mediator). Adjusting for a mediator blocks the indirect causal pathway through \(M\), so the estimated coefficient for \(X\) reflects only the direct effect of \(X\) on \(Y\) not through \(M\).
Whether to adjust for mediators depends on the research question:
If you want the total causal effect of \(X\) on \(Y\), do not adjust for \(M\).
If you want the direct effect of \(X\) on \(Y\) not through \(M\), adjust for \(M\).
Definition 15 (Collider) A collider is a variable \(L\) that is caused by two or more variables on a path: \[X \to L \leftarrow Y\]
Remark 12 (Adjusting for a collider). Adjusting for a collider opens a non-causal (backdoor) path between \(X\) and \(Y\).
Definition 16 (Collider bias) Adjusting for a collider (Definition 15) introduces collider bias: the bias from the non-causal path that the adjustment opens between \(X\) and \(Y\).
Definition 17 (Backdoor criterion) A set of variables \(\mathord{\smash[b]{\underset{\raise.3ex\hbox{$\scriptstyle\sim$}}{L}}\vphantom{L}}\) satisfies the backdoor criterion with respect to the ordered pair \((A, Y)\) in a DAG if:
No variable in \(\mathord{\smash[b]{\underset{\raise.3ex\hbox{$\scriptstyle\sim$}}{L}}\vphantom{L}}\) is a descendant of \(A\).
\(\mathord{\smash[b]{\underset{\raise.3ex\hbox{$\scriptstyle\sim$}}{L}}\vphantom{L}}\) blocks every path between \(A\) and \(Y\) that has an arrow into \(A\) (a “backdoor” path).
Remark 13 (Identification by backdoor adjustment). If \(\mathord{\smash[b]{\underset{\raise.3ex\hbox{$\scriptstyle\sim$}}{L}}\vphantom{L}}\) satisfies the backdoor criterion, then adjusting for \(\mathord{\smash[b]{\underset{\raise.3ex\hbox{$\scriptstyle\sim$}}{L}}\vphantom{L}}\) identifies the causal effect of \(A\) on \(Y\): \[{\mathbb{E}\mathopen{}\left[Y(a)\right]\mathclose{}} = \sum_{\mathord{\smash[b]{\underset{\raise.3ex\hbox{$\scriptstyle\sim$}}{l}}\vphantom{l}}} {\mathbb{E}\mathopen{}\left[Y \mid A = a, \mathord{\smash[b]{\underset{\raise.3ex\hbox{$\scriptstyle\sim$}}{L}}\vphantom{L}} = \mathord{\smash[b]{\underset{\raise.3ex\hbox{$\scriptstyle\sim$}}{l}}\vphantom{l}}\right]\mathclose{}} {\mathbb{P}\mathopen{}\left(\mathord{\smash[b]{\underset{\raise.3ex\hbox{$\scriptstyle\sim$}}{L}}\vphantom{L}} = \mathord{\smash[b]{\underset{\raise.3ex\hbox{$\scriptstyle\sim$}}{l}}\vphantom{l}}\right)\mathclose{}}\]
6.5 HERS study DAG
The “heart and estrogen/progestin study” (HERS) was a clinical trial of hormone therapy for prevention of recurrent heart attacks and death among 2,763 post-menopausal women with existing coronary heart disease (CHD) [5].
The trial was conducted at 20 US clinical centers. Participants were randomized to receive either conjugated equine estrogens (0.625 mg/day) plus medroxyprogesterone acetate (2.5 mg/day) or a matching placebo [5]. Women were followed for a sample mean of 4.1 years [5].
The primary outcome was nonfatal myocardial infarction or CHD death [5].
We now examine the assumed causal structure among key baseline variables, treatment, and recurrent CHD events.
Figure 1 shows a DAG for the HERS study, representing the assumed causal structure among key variables.
The main goal of the HERS study was to estimate the causal effect of hormone therapy (HT) on recurrent CHD event risk.
Table 1
Data dictionary for key HERS variables used in the DAG and examples.
Variable
Meaning
Type
HT
Hormone-therapy assignment (placebo vs estrogen+progestin)
Table 3: Summary table for LDL analysis variables in HERS
Characteristic
Overall
N = 2,7521
Placebo
N = 1,3791
HT
N = 1,3731
LDL cholesterol (mg/dl)
141 (120, 166)
141 (119, 165)
141 (120, 167)
age in years
67 (62, 72)
68 (62, 72)
67 (62, 72)
BMI (kg/m^2)
27.7 (24.6, 31.7)
27.6 (24.5, 31.7)
27.9 (24.7, 31.8)
Unknown
5
4
1
diabetes
727 (26%)
350 (25%)
377 (27%)
smoking
355 (13%)
180 (13%)
175 (13%)
statins
998 (36%)
516 (37%)
482 (35%)
1 Median (Q1, Q3); n (%)
Unadjusted model
[R code]
model_ldl_unadj <-lm(LDL ~ HT, data = hers_ldl)model_ldl_unadj |>tbl_regression() |>bold_labels()
Table 4: Unadjusted linear regression for LDL in HERS
Characteristic
Beta
95% CI
p-value
HT
Placebo
—
—
HT
0.36
-2.5, 3.2
0.8
Abbreviation: CI = Confidence Interval
Adjusted model
Based on the DAG in Figure 1, BMI is a common cause of LDL and other outcomes (but age does not confound the HT → LDL relationship, since HT was randomized).
model_ldl_adj <-lm(LDL ~ HT + age + BMI + diabetes + statins, data = hers_ldl)model_ldl_adj |>tbl_regression() |>bold_labels()
Table 5: Adjusted linear regression for LDL in HERS
Characteristic
Beta
95% CI
p-value
HT
Placebo
—
—
HT
-0.14
-2.9, 2.6
>0.9
age in years
-0.23
-0.44, -0.02
0.035
BMI (kg/m^2)
0.46
0.19, 0.72
<0.001
diabetes
No
—
—
Yes
-4.6
-7.9, -1.4
0.005
statins
No
—
—
Yes
-17
-20, -14
<0.001
Abbreviation: CI = Confidence Interval
Note that statins is a strong predictor of LDL (statin medications are prescribed specifically to lower LDL). Including statins substantially reduces residual variability, improving precision of the HT coefficient.
6.8 An observational study example: WCGS
The HERS study is a randomized trial, so confounding of the treatment-outcome relationship is not a concern. To illustrate DAG-guided confounder selection in an observational study, we use the Western Collaborative Group Study (WCGS).
The WCGS was a prospective cohort study of 3,154 men employed by California companies, followed from 1960 to 1969 [8]. The exposure of primary interest is Type A behavior pattern (a personality trait characterized by competitive drive, time urgency, and hostility), hypothesized to increase CHD risk independently of classic cardiovascular risk factors.
Table 6
Data dictionary for key WCGS variables used in the DAG and examples.
Variable
Meaning
Type
personality_type
Personality type (Type A vs Type B behavior pattern)
Binary categorical
CHD
Coronary heart disease event outcome
Binary categorical
age
Baseline age (years)
Continuous
smoking
Baseline smoking status
Binary categorical
chol
Serum cholesterol
Continuous
sbp
Systolic blood pressure
Continuous
bmi
Body mass index
Continuous
[R code]
wcgs_dag <-dagitty('dag { personality_type [exposure, pos="0,0"] CHD [outcome, pos="4,0"] age [pos="1.4,2"] bmi [pos="-0.3,1.1"] smoking [pos="1.1,-1.8"] chol [pos="2.7,1"] sbp [pos="2.8,-1.2"] personality_type -> CHD age -> CHD age -> chol age -> sbp age -> bmi age -> personality_type personality_type -> smoking smoking -> CHD chol -> CHD sbp -> CHD bmi -> CHD bmi -> chol bmi -> sbp }')plot(wcgs_dag)
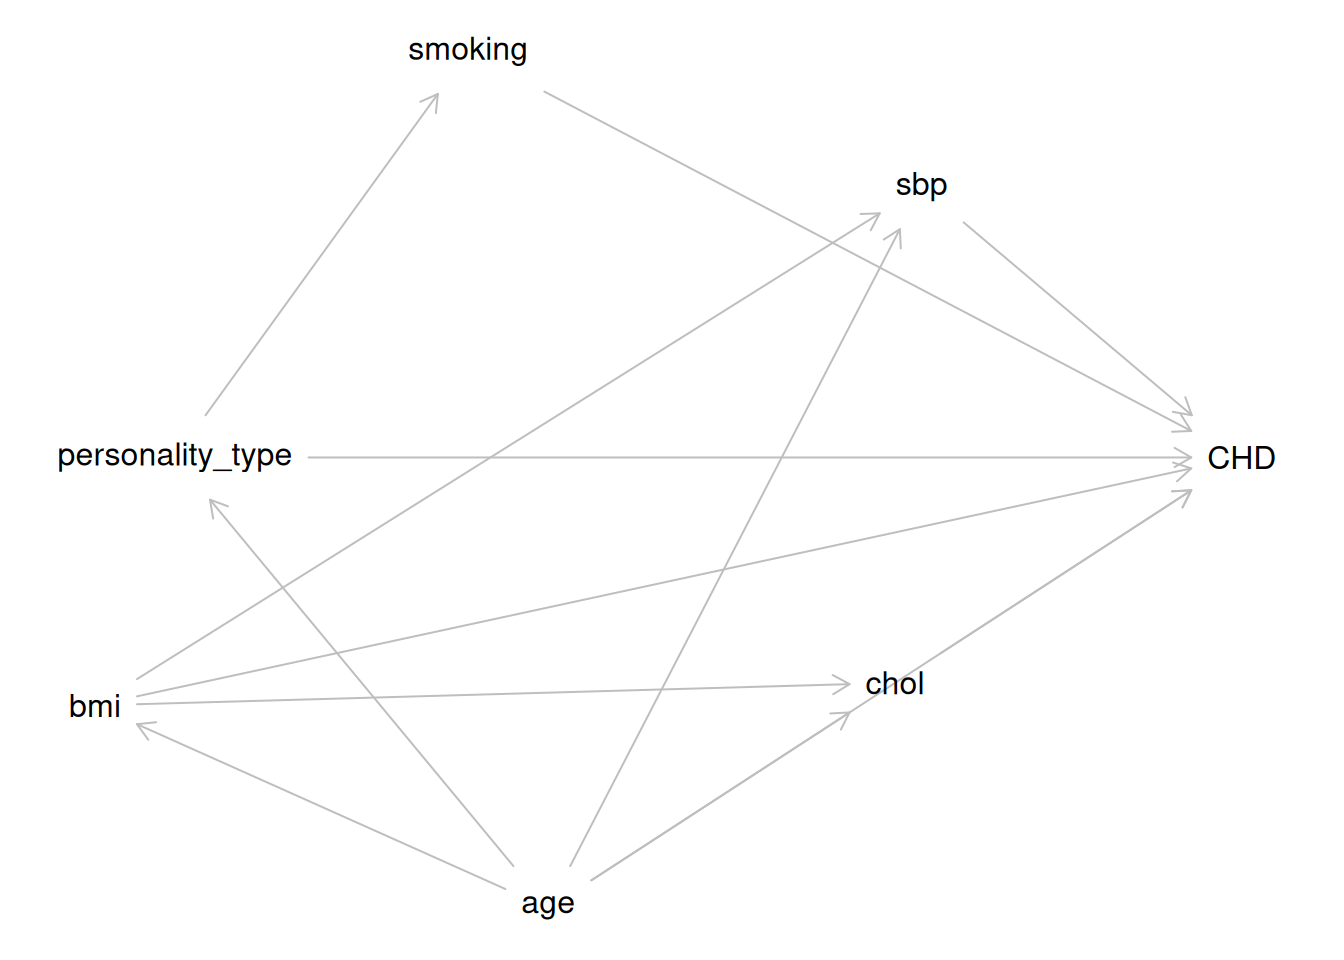
Figure 2: Directed Acyclic Graph (DAG) for the WCGS study. personality_type = personality type (exposure; Type A vs Type B); CHD = coronary heart disease events (outcome); chol = serum cholesterol; sbp = systolic blood pressure.
In Figure 2, age is a confounder: it has direct causal arrows to both the exposure (personality_type) and the outcome (CHD). We assume personality_type -> smoking rather than smoking -> personality_type as an explicit modeling assumption for this teaching example: we treat Type A behavior pattern as a relatively stable trait that can influence smoking behavior. Under that assumption, smoking is a mediator on the path personality_type -> smoking -> CHD, not a confounder. BMI is causally affected by age. Cholesterol and SBP are causally affected by both age and BMI. All three have direct effects on CHD. Unlike in HERS, where HT was randomized to estimate its causal effect on CHD event risk, we cannot assume the exposure is unconfounded here.
[R code]
wcgs_adj <-adjustmentSets( wcgs_dag,exposure ="personality_type",outcome ="CHD",type ="minimal")wcgs_adj#> { age }
7 Regression Adjustment
Video lecture
Richard McElreath’s Good and Bad Controls (Statistical Rethinking 2026, Lecture A07) also accompanies Chapter 6 of McElreath [6], and discusses which covariates a regression model should and should not adjust for [7].
Under the causal assumptions (consistency, conditional exchangeability, and positivity), the causal effect can be estimated by adjusting for the confounders\(\mathord{\smash[b]{\underset{\raise.3ex\hbox{$\scriptstyle\sim$}}{L}}\vphantom{L}}\) in a regression model. The identification result behind that adjustment is standardization:
Theorem 2 (Identification by standardization) Suppose \(\mathord{\smash[b]{\underset{\raise.3ex\hbox{$\scriptstyle\sim$}}{L}}\vphantom{L}}\) is discrete, and that consistency, conditional exchangeability given \(\mathord{\smash[b]{\underset{\raise.3ex\hbox{$\scriptstyle\sim$}}{L}}\vphantom{L}}\), and positivity hold. Then for each treatment level \(a \in \mathopen{}\left\{0, 1\right\}\mathclose{}\),
\[
{\mathbb{E}\mathopen{}\left[Y(a)\right]\mathclose{}} = \sum_{\mathord{\smash[b]{\underset{\raise.3ex\hbox{$\scriptstyle\sim$}}{l}}\vphantom{l}}} {\mathbb{E}\mathopen{}\left[Y \mid A = a, \mathord{\smash[b]{\underset{\raise.3ex\hbox{$\scriptstyle\sim$}}{L}}\vphantom{L}} = \mathord{\smash[b]{\underset{\raise.3ex\hbox{$\scriptstyle\sim$}}{l}}\vphantom{l}}\right]\mathclose{}} {\mathbb{P}\mathopen{}\left(\mathord{\smash[b]{\underset{\raise.3ex\hbox{$\scriptstyle\sim$}}{L}}\vphantom{L}} = \mathord{\smash[b]{\underset{\raise.3ex\hbox{$\scriptstyle\sim$}}{l}}\vphantom{l}}\right)\mathclose{}}
\tag{2}\]
where the sum runs over the support of \(\mathord{\smash[b]{\underset{\raise.3ex\hbox{$\scriptstyle\sim$}}{L}}\vphantom{L}}\).
Proof. For treatment level \(a\):
\[
\begin{aligned}
{\mathbb{E}\mathopen{}\left[Y(a)\right]\mathclose{}}
&= \sum_{\mathord{\smash[b]{\underset{\raise.3ex\hbox{$\scriptstyle\sim$}}{l}}\vphantom{l}}} {\mathbb{E}\mathopen{}\left[Y(a) \mid \mathord{\smash[b]{\underset{\raise.3ex\hbox{$\scriptstyle\sim$}}{L}}\vphantom{L}} = \mathord{\smash[b]{\underset{\raise.3ex\hbox{$\scriptstyle\sim$}}{l}}\vphantom{l}}\right]\mathclose{}} {\mathbb{P}\mathopen{}\left(\mathord{\smash[b]{\underset{\raise.3ex\hbox{$\scriptstyle\sim$}}{L}}\vphantom{L}} = \mathord{\smash[b]{\underset{\raise.3ex\hbox{$\scriptstyle\sim$}}{l}}\vphantom{l}}\right)\mathclose{}}
&& \text{(law of total expectation over } \mathord{\smash[b]{\underset{\raise.3ex\hbox{$\scriptstyle\sim$}}{L}}\vphantom{L}} \text{)} \\
&= \sum_{\mathord{\smash[b]{\underset{\raise.3ex\hbox{$\scriptstyle\sim$}}{l}}\vphantom{l}}} {\mathbb{E}\mathopen{}\left[Y(a) \mid A = a, \mathord{\smash[b]{\underset{\raise.3ex\hbox{$\scriptstyle\sim$}}{L}}\vphantom{L}} = \mathord{\smash[b]{\underset{\raise.3ex\hbox{$\scriptstyle\sim$}}{l}}\vphantom{l}}\right]\mathclose{}} {\mathbb{P}\mathopen{}\left(\mathord{\smash[b]{\underset{\raise.3ex\hbox{$\scriptstyle\sim$}}{L}}\vphantom{L}} = \mathord{\smash[b]{\underset{\raise.3ex\hbox{$\scriptstyle\sim$}}{l}}\vphantom{l}}\right)\mathclose{}}
&& \text{(conditional exchangeability: } Y(a) \perp\!\!\!\perp A \mid \mathord{\smash[b]{\underset{\raise.3ex\hbox{$\scriptstyle\sim$}}{L}}\vphantom{L}} \text{)} \\
&= \sum_{\mathord{\smash[b]{\underset{\raise.3ex\hbox{$\scriptstyle\sim$}}{l}}\vphantom{l}}} {\mathbb{E}\mathopen{}\left[Y \mid A = a, \mathord{\smash[b]{\underset{\raise.3ex\hbox{$\scriptstyle\sim$}}{L}}\vphantom{L}} = \mathord{\smash[b]{\underset{\raise.3ex\hbox{$\scriptstyle\sim$}}{l}}\vphantom{l}}\right]\mathclose{}} {\mathbb{P}\mathopen{}\left(\mathord{\smash[b]{\underset{\raise.3ex\hbox{$\scriptstyle\sim$}}{L}}\vphantom{L}} = \mathord{\smash[b]{\underset{\raise.3ex\hbox{$\scriptstyle\sim$}}{l}}\vphantom{l}}\right)\mathclose{}}
&& \text{(consistency: } Y = Y(a) \text{ when } A = a \text{)}
\end{aligned}
\]
Positivity guarantees \({\mathbb{P}\mathopen{}\left(A = a \mid \mathord{\smash[b]{\underset{\raise.3ex\hbox{$\scriptstyle\sim$}}{L}}\vphantom{L}} = \mathord{\smash[b]{\underset{\raise.3ex\hbox{$\scriptstyle\sim$}}{l}}\vphantom{l}}\right)\mathclose{}} > 0\) for every \(\mathord{\smash[b]{\underset{\raise.3ex\hbox{$\scriptstyle\sim$}}{l}}\vphantom{l}}\) in the support, so each conditioning event \(\mathopen{}\left\{A = a, \mathord{\smash[b]{\underset{\raise.3ex\hbox{$\scriptstyle\sim$}}{L}}\vphantom{L}} = \mathord{\smash[b]{\underset{\raise.3ex\hbox{$\scriptstyle\sim$}}{l}}\vphantom{l}}\right\}\mathclose{}\) has positive probability and every term in the second and third lines is defined.
Example 9 (Standardizing over disease severity) In the population of Example 4, \({\mathbb{P}\mathopen{}\left(L = 0\right)\mathclose{}} = 600/1000 = 0.6\) and \({\mathbb{P}\mathopen{}\left(L = 1\right)\mathclose{}} = 0.4\), and by consistency the observed stratum means are \({\mathbb{E}\mathopen{}\left[Y \mid A = 1, L = l\right]\mathclose{}} = {\mathbb{E}\mathopen{}\left[Y(1) \mid L = l\right]\mathclose{}}\) and \({\mathbb{E}\mathopen{}\left[Y \mid A = 0, L = l\right]\mathclose{}} = {\mathbb{E}\mathopen{}\left[Y(0) \mid L = l\right]\mathclose{}}\). By Theorem 2:
Standardization recovers the true ATE of 2, whereas the naive contrast in Example 7 gave 7. Standardization weights both treatment groups’ stratum means by the same distribution of \(L\), the whole population’s, instead of each group’s own distribution of \(L\).
7.1 Direct standardization (G-computation)
The G-computation estimator (also called direct standardization or standardization) estimates the ATE by:
Fitting a regression model: \(\hat{\mu}(a, \mathord{\smash[b]{\underset{\raise.3ex\hbox{$\scriptstyle\sim$}}{l}}\vphantom{l}}) \stackrel{\text{def}}{=}\widehat{{\mathbb{E}\mathopen{}\left[Y \mid A = a, \mathord{\smash[b]{\underset{\raise.3ex\hbox{$\scriptstyle\sim$}}{L}}\vphantom{L}} = \mathord{\smash[b]{\underset{\raise.3ex\hbox{$\scriptstyle\sim$}}{l}}\vphantom{l}}\right]\mathclose{}}}\)
Predicting the potential outcome mean for each individual under both treatment levels \(a = 1\) and \(a = 0\): \[\hat{Y}_i(a) \stackrel{\text{def}}{=}\hat{\mu}(a, \mathord{\smash[b]{\underset{\raise.3ex\hbox{$\scriptstyle\sim$}}{L}}\vphantom{L}}_i)\]
Averaging over the study population: \[\widehat{{\mathbb{E}\mathopen{}\left[Y(a)\right]\mathclose{}}} \stackrel{\text{def}}{=}\frac{1}{n} \sum_{i=1}^n \hat{Y}_i(a)\]
Estimating the ATE as the contrast: \[\widehat{\text{ATE}} \stackrel{\text{def}}{=}\widehat{{\mathbb{E}\mathopen{}\left[Y(1)\right]\mathclose{}}} - \widehat{{\mathbb{E}\mathopen{}\left[Y(0)\right]\mathclose{}}}\]
7.2 Regression adjustment in linear models
When the outcome is continuous and the regression model is linear, G-computation simplifies to the adjusted treatment coefficient from a linear regression:
Thus, when the outcome model is correctly specified and contains no treatment-covariate interactions, \(\beta_A\) directly identifies the ATE.
7.3 Example: regression adjustment for LDL in HERS
The HERS study DAG (see Section 6.5) shows that LDL and HDL are mediators of the HT → CHD pathway. For estimating the total causal effect of HT on CHD, we should not adjust for LDL or HDL.
However, to estimate the causal effect of HT on LDL itself, we use a separate regression model with LDL as the outcome. In this model, LDL is no longer a mediator but the outcome of interest.
Since HT was randomized in HERS, no adjustment is needed for causal identification of HT → LDL. However, adjusting for strong predictors of LDL improves precision:
library(gtsummary)model_ldl_adj <-lm(LDL ~ HT + age + BMI + diabetes + statins, data = hers_ldl)model_ldl_adj |>tbl_regression() |>bold_labels()
Table 7: Adjusted regression for the causal effect of HT on LDL in HERS. Since HT was randomized, adjustment is for precision only.
Characteristic
Beta
95% CI
p-value
HT
Placebo
—
—
HT
-0.14
-2.9, 2.6
>0.9
age in years
-0.23
-0.44, -0.02
0.035
BMI (kg/m^2)
0.46
0.19, 0.72
<0.001
diabetes
No
—
—
Yes
-4.6
-7.9, -1.4
0.005
statins
No
—
—
Yes
-17
-20, -14
<0.001
Abbreviation: CI = Confidence Interval
The estimated causal effect of HT on LDL is approximately −11 mg/dL (negative = lower LDL on HT), with narrower confidence intervals than the unadjusted estimate.
8 Propensity Score Methods
Propensity score methods are an alternative approach to confounding adjustment in observational studies. They replace adjustment for a high-dimensional confounder set \(\mathord{\smash[b]{\underset{\raise.3ex\hbox{$\scriptstyle\sim$}}{L}}\vphantom{L}}\) with adjustment for a single scalar summary: the propensity score.
Definition 18 (Propensity score) The propensity score is the conditional probability of treatment given the observed covariates: \[e(\mathord{\smash[b]{\underset{\raise.3ex\hbox{$\scriptstyle\sim$}}{L}}\vphantom{L}}) \stackrel{\text{def}}{=}{\mathbb{P}\mathopen{}\left(A = 1 \mid \mathord{\smash[b]{\underset{\raise.3ex\hbox{$\scriptstyle\sim$}}{L}}\vphantom{L}}\right)\mathclose{}}\]
Example 10 (Propensity scores in the severity example) In the population of Example 4, the propensity score (Definition 18) takes two values: \(e(0) = {\mathbb{P}\mathopen{}\left(A = 1 \mid L = 0\right)\mathclose{}} = 120/600 = 0.2\) and \(e(1) = {\mathbb{P}\mathopen{}\left(A = 1 \mid L = 1\right)\mathclose{}} = 280/400 = 0.7\). A severe patient is \(0.7 / 0.2 = 3.5\) times as likely to be treated as a non-severe patient.
Remark 14 (Propensity scores and exchangeability). Rosenbaum and Rubin [9] showed that if \(A \perp\!\!\!\perp (Y(0), Y(1)) \mid \mathord{\smash[b]{\underset{\raise.3ex\hbox{$\scriptstyle\sim$}}{L}}\vphantom{L}}\) (conditional exchangeability given \(\mathord{\smash[b]{\underset{\raise.3ex\hbox{$\scriptstyle\sim$}}{L}}\vphantom{L}}\)), then also: \[A \perp\!\!\!\perp (Y(0), Y(1)) \mid e(\mathord{\smash[b]{\underset{\raise.3ex\hbox{$\scriptstyle\sim$}}{L}}\vphantom{L}})\]
Definition 19 (Balancing score) In other words, the propensity score (Definition 18) is a balancing score: conditioning on the propensity score is sufficient to remove confounding.
8.1 Propensity score estimation
The propensity score is estimated by fitting a model for the probability of treatment given covariates, typically using logistic regression:
The estimated propensity score \(\hat{e}(\mathord{\smash[b]{\underset{\raise.3ex\hbox{$\scriptstyle\sim$}}{L}}\vphantom{L}}_i)\) is the predicted probability of treatment for each individual.
8.2 Propensity score methods
There are four main ways to use the propensity score:
Matching: Match each treated individual to one or more untreated individuals with similar propensity scores. The matched dataset is then analyzed as a simple comparison.
Stratification (subclassification): Divide individuals into strata based on propensity score quantiles. Estimate the causal effect within each stratum, then combine across strata.
Inverse probability weighting (IPW): Weight each individual by the inverse of their probability of receiving the treatment they actually received. See Definition 20.
Covariate adjustment using the propensity score: Include the estimated propensity score as a covariate in a regression model for the outcome.
Definition 20 (Inverse probability weighting (IPW)) The inverse probability weighted (IPW) estimator of the ATE uses weights: \[w_i \stackrel{\text{def}}{=}\frac{A_i}{\hat{e}(\mathord{\smash[b]{\underset{\raise.3ex\hbox{$\scriptstyle\sim$}}{L}}\vphantom{L}}_i)} +
\frac{1 - A_i}{1 - \hat{e}(\mathord{\smash[b]{\underset{\raise.3ex\hbox{$\scriptstyle\sim$}}{L}}\vphantom{L}}_i)}\]
The IPW estimator of \({\mathbb{E}\mathopen{}\left[Y(a)\right]\mathclose{}}\) is: \[\widehat{{\mathbb{E}\mathopen{}\left[Y(a)\right]\mathclose{}}}_{\text{IPW}} \stackrel{\text{def}}{=}
\frac{\sum_{i: A_i = a} w_i Y_i}{\sum_{i: A_i = a} w_i}\]
Definition 21 (Pseudo-population) Reweighting by the weights \(w_i\) of Definition 20 creates a pseudo-population in which treatment is independent of covariates, effectively removing confounding.
Theorem 3 (Identification by inverse probability weighting) For \(a \in \mathopen{}\left\{0, 1\right\}\mathclose{}\), write \(\pi_a(\mathord{\smash[b]{\underset{\raise.3ex\hbox{$\scriptstyle\sim$}}{l}}\vphantom{l}}) \stackrel{\text{def}}{=}{\mathbb{P}\mathopen{}\left(A = a \mid \mathord{\smash[b]{\underset{\raise.3ex\hbox{$\scriptstyle\sim$}}{L}}\vphantom{L}} = \mathord{\smash[b]{\underset{\raise.3ex\hbox{$\scriptstyle\sim$}}{l}}\vphantom{l}}\right)\mathclose{}}\), so that \(\pi_1 = e\) and \(\pi_0 = 1 - e\). If consistency, conditional exchangeability given \(\mathord{\smash[b]{\underset{\raise.3ex\hbox{$\scriptstyle\sim$}}{L}}\vphantom{L}}\), and positivity hold, then
Proof. \[
\begin{aligned}
{\mathbb{E}\mathopen{}\left[\frac{{\mathbb{1}\mathopen{}\left(A = a\right)\mathclose{}} \, Y}{\pi_a(\mathord{\smash[b]{\underset{\raise.3ex\hbox{$\scriptstyle\sim$}}{L}}\vphantom{L}})}\right]\mathclose{}}
&= {\mathbb{E}\mathopen{}\left[{\mathbb{E}\mathopen{}\left[\frac{{\mathbb{1}\mathopen{}\left(A = a\right)\mathclose{}} \, Y}{\pi_a(\mathord{\smash[b]{\underset{\raise.3ex\hbox{$\scriptstyle\sim$}}{L}}\vphantom{L}})} \mid \mathord{\smash[b]{\underset{\raise.3ex\hbox{$\scriptstyle\sim$}}{L}}\vphantom{L}}\right]\mathclose{}}\right]\mathclose{}}
&& \text{(law of total expectation)} \\
&= {\mathbb{E}\mathopen{}\left[\frac{1}{\pi_a(\mathord{\smash[b]{\underset{\raise.3ex\hbox{$\scriptstyle\sim$}}{L}}\vphantom{L}})} {\mathbb{E}\mathopen{}\left[{\mathbb{1}\mathopen{}\left(A = a\right)\mathclose{}} \, Y \mid \mathord{\smash[b]{\underset{\raise.3ex\hbox{$\scriptstyle\sim$}}{L}}\vphantom{L}}\right]\mathclose{}}\right]\mathclose{}}
&& \text{(pull out } 1 / \pi_a(\mathord{\smash[b]{\underset{\raise.3ex\hbox{$\scriptstyle\sim$}}{L}}\vphantom{L}}) \text{, which positivity keeps finite)} \\
&= {\mathbb{E}\mathopen{}\left[\frac{1}{\pi_a(\mathord{\smash[b]{\underset{\raise.3ex\hbox{$\scriptstyle\sim$}}{L}}\vphantom{L}})} {\mathbb{E}\mathopen{}\left[{\mathbb{1}\mathopen{}\left(A = a\right)\mathclose{}} \, Y(a) \mid \mathord{\smash[b]{\underset{\raise.3ex\hbox{$\scriptstyle\sim$}}{L}}\vphantom{L}}\right]\mathclose{}}\right]\mathclose{}}
&& \text{(consistency: } Y = Y(a) \text{ when } A = a \text{)} \\
&= {\mathbb{E}\mathopen{}\left[\frac{1}{\pi_a(\mathord{\smash[b]{\underset{\raise.3ex\hbox{$\scriptstyle\sim$}}{L}}\vphantom{L}})} {\mathbb{E}\mathopen{}\left[{\mathbb{1}\mathopen{}\left(A = a\right)\mathclose{}} \mid \mathord{\smash[b]{\underset{\raise.3ex\hbox{$\scriptstyle\sim$}}{L}}\vphantom{L}}\right]\mathclose{}} {\mathbb{E}\mathopen{}\left[Y(a) \mid \mathord{\smash[b]{\underset{\raise.3ex\hbox{$\scriptstyle\sim$}}{L}}\vphantom{L}}\right]\mathclose{}}\right]\mathclose{}}
&& \text{(conditional exchangeability: } A \perp\!\!\!\perp Y(a) \mid \mathord{\smash[b]{\underset{\raise.3ex\hbox{$\scriptstyle\sim$}}{L}}\vphantom{L}} \text{)} \\
&= {\mathbb{E}\mathopen{}\left[\frac{1}{\pi_a(\mathord{\smash[b]{\underset{\raise.3ex\hbox{$\scriptstyle\sim$}}{L}}\vphantom{L}})} \pi_a(\mathord{\smash[b]{\underset{\raise.3ex\hbox{$\scriptstyle\sim$}}{L}}\vphantom{L}}) {\mathbb{E}\mathopen{}\left[Y(a) \mid \mathord{\smash[b]{\underset{\raise.3ex\hbox{$\scriptstyle\sim$}}{L}}\vphantom{L}}\right]\mathclose{}}\right]\mathclose{}}
&& \text{(} {\mathbb{E}\mathopen{}\left[{\mathbb{1}\mathopen{}\left(A = a\right)\mathclose{}} \mid \mathord{\smash[b]{\underset{\raise.3ex\hbox{$\scriptstyle\sim$}}{L}}\vphantom{L}}\right]\mathclose{}} = {\mathbb{P}\mathopen{}\left(A = a \mid \mathord{\smash[b]{\underset{\raise.3ex\hbox{$\scriptstyle\sim$}}{L}}\vphantom{L}}\right)\mathclose{}} \text{)} \\
&= {\mathbb{E}\mathopen{}\left[{\mathbb{E}\mathopen{}\left[Y(a) \mid \mathord{\smash[b]{\underset{\raise.3ex\hbox{$\scriptstyle\sim$}}{L}}\vphantom{L}}\right]\mathclose{}}\right]\mathclose{}}
&& \text{(cancel } \pi_a(\mathord{\smash[b]{\underset{\raise.3ex\hbox{$\scriptstyle\sim$}}{L}}\vphantom{L}}) \text{)} \\
&= {\mathbb{E}\mathopen{}\left[Y(a)\right]\mathclose{}}
&& \text{(law of total expectation)}
\end{aligned}
\]
Example 11 (The pseudo-population in the severity example) In the population of Example 4, with the propensity scores of Example 10, the weights of Definition 20 are:
Group
patients
weight \(w_i\)
weighted count
treated, \(L = 0\)
120
\(1/0.2 = 5\)
600
treated, \(L = 1\)
280
\(1/0.7 \approx 1.43\)
400
untreated, \(L = 0\)
480
\(1/0.8 = 1.25\)
600
untreated, \(L = 1\)
120
\(1/0.3 \approx 3.33\)
400
In the pseudo-population, each treatment group has 1000 members, 600 non-severe and 400 severe: the same severity mix as the whole population, so \(L\) no longer predicts treatment. The weighted means are:
These weighted means match Example 9, as Theorem 3 says they should, and their difference recovers the ATE of 2.
8.3 Propensity score example: WCGS
In the WCGS study, we can use propensity score methods to estimate the causal effect of Type A behavior on CHD. We first fit a logistic regression model predicting Type A behavior from the confounders identified by the DAG (Section 6.8):
library(ggplot2)ggplot(wcgs_ps, aes(x = ps, fill =factor(dibpat_A))) +geom_histogram(alpha =0.6, bins =30, position ="identity") +scale_fill_manual(values =c("steelblue", "tomato"),labels =c("Type B", "Type A"),name ="Personality type" ) +labs(x ="Estimated propensity score",y ="Count",title ="Propensity score distributions by personality type (WCGS)" ) +theme_bw()
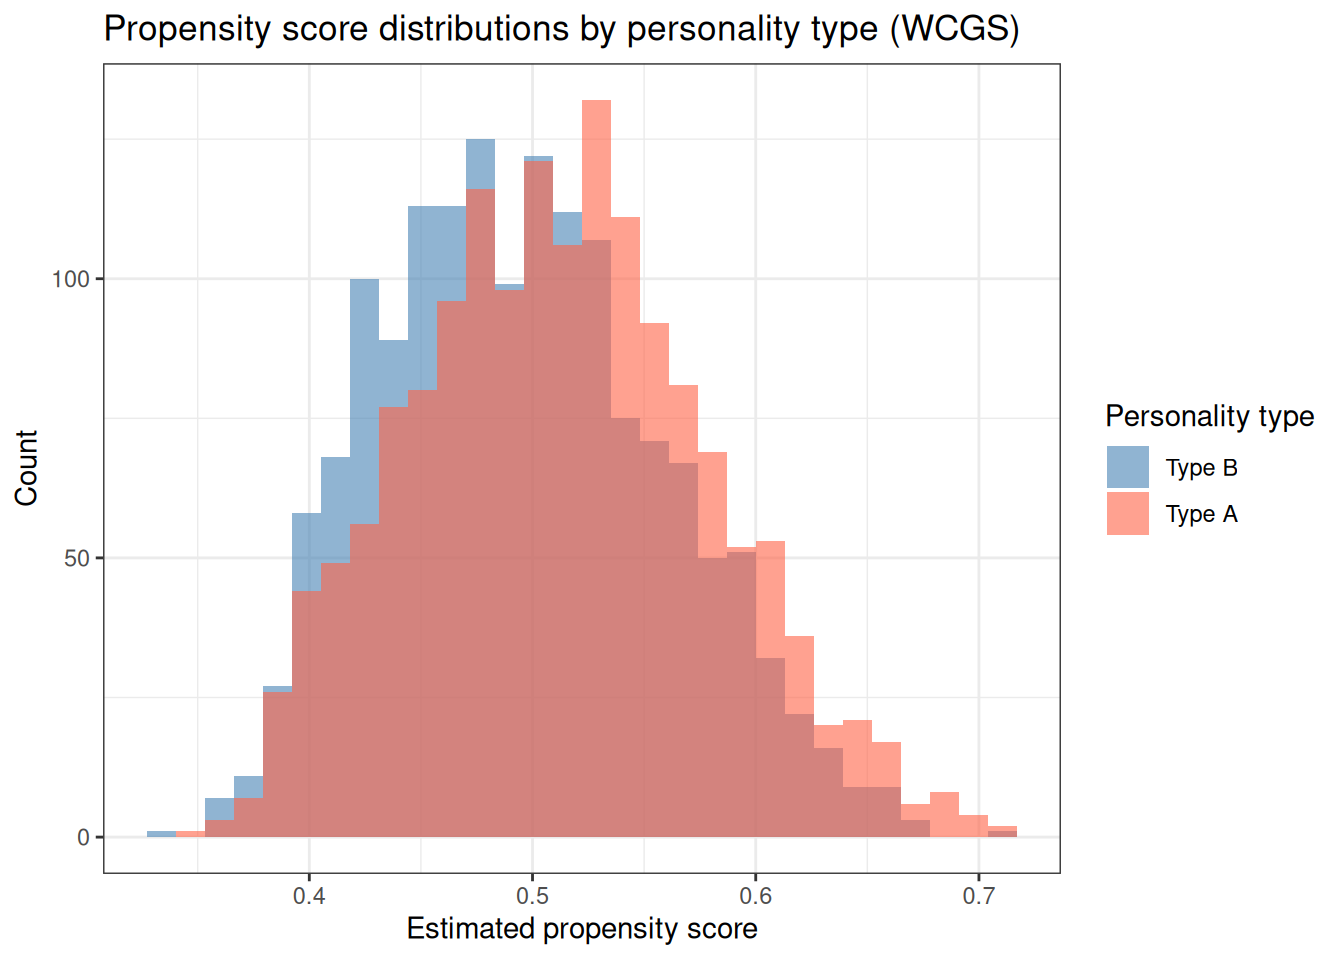
Figure 3: Distribution of estimated propensity scores by personality type in the WCGS study. Good overlap between the two groups (the overlap or common support assumption) supports positivity.
Table 8: Inverse probability weighted (IPW) logistic regression model for the effect of Type A personality on CHD in WCGS.
Characteristic
OR
95% CI
p-value
dibpat_A
1.93
1.48, 2.53
<0.001
Abbreviations: CI = Confidence Interval, OR = Odds Ratio
9 Summary
Causal inference requires moving beyond statistical association to make statements about what would happen under intervention. The key ideas from this chapter are:
Potential outcomes define what we mean by a causal effect. For each unit, there is a potential outcome under treatment and a potential outcome under control; the individual causal effect is their difference.
Causal estimands — ATE, ATT, ATU — summarize the causal effect at the population level.
Three key assumptions are needed to identify causal effects from observed data:
Positivity: Every individual has a positive probability of receiving each treatment level.
Randomized experiments achieve unconditional exchangeability and allow unbiased causal inference from simple treatment comparisons.
In observational studies, confounding violates exchangeability. DAGs help identify which variables are confounders, mediators, and colliders, and the backdoor criterion identifies sufficient adjustment sets.
Describe propensity score methods (matching, stratification, IPW) and explain how they use the propensity score to remove confounding.
Contrast causal inference from randomized trials with causal inference from observational studies, and articulate the additional assumptions required in each setting.
References
[1]
E. Vittinghoff, D. V. Glidden, S. C. Shiboski, and C. E. McCulloch, Regression methods in biostatistics: Linear, logistic, survival, and repeated measures models, 2nd ed. Springer, 2012. Available: https://doi.org/10.1007/978-1-4614-1353-0
P. W. Holland, “Statistics and causal inference,”Journal of the American Statistical Association, vol. 81, no. 396, pp. 945–960, 1986, doi: 10.2307/2289064.
[4]
D. B. Rubin, “Estimating causal effects of treatments in randomized and nonrandomized studies,”Journal of Educational Psychology, vol. 66, no. 5, pp. 688–701, 1974, doi: 10.1037/h0037350.
[5]
S. Hulley et al., “Randomized trial of estrogen plus progestin for secondary prevention of coronary heart disease in postmenopausal women,”JAMA : the journal of the American Medical Association, vol. 280, no. 7, pp. 605–613, 1998.
[6]
R. McElreath, Statistical rethinking : A Bayesian course with examples in R and Stan, Second edition. in Chapman & hall/CRC texts in statistical science series. Boca Raton, FL: CRC Press, 2020.
R. H. Rosenman, R. J. Brand, C. D. Jenkins, M. Friedman, R. Straus, and M. Wurm, “Coronary heart disease in the Western Collaborative Group Study: Final follow-up experience of 8 1/2 years,”JAMA, vol. 233, no. 8, pp. 872–877, 1975, doi: 10.1001/jama.1975.03260080034016.
[9]
P. R. Rosenbaum and D. B. Rubin, “The central role of the propensity score in observational studies for causal effects,”Biometrika, vol. 70, no. 1, pp. 41–55, 1983, doi: 10.1093/biomet/70.1.41.