chol_by_chd <- split(wcgs$chol, wcgs$chd69) |>
  lapply(function(x) x[!is.na(x)])
x1 <- chol_by_chd[["Yes"]]
x0 <- chol_by_chd[["No"]]
diff_means <- mean(x1) - mean(x0)
se_diff <- sqrt(var(x1) / length(x1) + var(x0) / length(x0))
z <- diff_means / se_diff
p_value <- 2 * pnorm(-abs(z))
c(difference = diff_means, se = se_diff, z = z, p_value = p_value)
#>  difference          se           z     p_value
#> 2.58087e+01 3.17988e+00 8.11626e+00 4.80780e-16Statistical Inference
1 Inference
DefDefinition 1 (Statistical inference)
Definition 1 (Statistical inference) Statistical inference is the process of analyzing data to learn about the shape and structure of the probability distribution that generated those data.
This definition is adapted from Wikipedia’s [1].
ExmExample 1 (Inference about cholesterol in the WCGS population)
Example 1 (Inference about cholesterol in the WCGS population) The WCGS measured total cholesterol in 3,142 of its 3,154 participants. Using those measurements to learn about the distribution of cholesterol among men like the participants, for example its population mean, and quantifying how uncertain that knowledge is, is statistical inference.
Statistical inference typically consists of two steps:
- fitting a statistical model to data;
- summarizing our uncertainty about the parameters of the fitted model, based on the data (and, in Bayesian inference, on prior beliefs).
There are two predominant paradigms for statistical inference:
- frequentist inference, which treats parameters as fixed unknown constants;
- Bayesian inference, which treats parameters as random variables with prior distributions.
2 Hypothesis tests
2.1 Hypotheses
DefDefinition 2 (Null hypothesis)
Definition 2 (Null hypothesis) The null hypothesis, written \(H_0\), is a specific claim about the parameters of a statistical model, which a hypothesis test assesses against the data.
Source: Wikipedia contributors [2].
DefDefinition 3 (Alternative hypothesis)
Definition 3 (Alternative hypothesis) The alternative hypothesis, written \(H_1\) or \(H_A\), is the claim that a hypothesis test weighs the data as evidence for, against the null hypothesis.
DefDefinition 4 (Two-sided alternative)
Definition 4 (Two-sided alternative) For a null hypothesis that a parameter equals a value, such as \(H_0: \theta= \theta_0\), the two-sided alternative is that the parameter differs from that value in either direction: \(H_1: \theta\ne \theta_0\).
Source: Wikipedia contributors [3].
ExmExample 2 (Cholesterol and CHD in the WCGS)
Example 2 (Cholesterol and CHD in the WCGS) Let \(\mu_1\) and \(\mu_0\) be the population mean cholesterol of men who do and do not have a CHD event by 1969, in the population the WCGS sampled. A comparison of the two groups tests the null hypothesis that the population means are equal against the two-sided alternative that they differ:
\[H_0: \mu_1 = \mu_0 \qquad H_1: \mu_1 \ne \mu_0\]
2.2 p-values
DefDefinition 5 (Test statistic)
Definition 5 (Test statistic) A test statistic \(T\) is a function of the data whose distribution under the null hypothesis is known, exactly or approximately, and whose larger values are more extreme, meaning less consistent with \(H_0\) and more consistent with \(H_1\).
Source: Wikipedia contributors [4].
DefDefinition 6 (p-value)
Definition 6 (p-value) Given a test statistic \(T\) whose observed value is \(t\), the p-value is the probability that \(T\) is at least as extreme as the value observed, computed with the data distributed as the null hypothesis specifies:
\[p \stackrel{\text{def}}{=}\Pr_{H_0}(T \ge t)\]
If the null hypothesis allows more than one distribution (a composite null hypothesis, such as \(H_0: \mu_1 = \mu_0\) with unknown variances), the p-value is the largest such probability over those distributions, or an approximation to it.
Source: Wikipedia contributors [5].
RemarkRemark 1 (A p-value is not the probability that the null hypothesis is true)
Remark 1 (A p-value is not the probability that the null hypothesis is true). A p-value is computed assuming \(H_0\) is true, so it is not the probability that \(H_0\) is true given the data.
DefDefinition 7 (Significance level)
Definition 7 (Significance level) A hypothesis test with significance level \(\alpha\) rejects the null hypothesis when the p-value is at most \(\alpha\).
Source: Wikipedia contributors [6].
RemarkRemark 2 (Choosing a significance level)
Remark 2 (Choosing a significance level). \(\alpha= 0.05\) is a common convention, not a rule. When \(H_0\) is true and the p-value is computed exactly, a test with significance level \(\alpha\) rejects \(H_0\) with probability at most \(\alpha\); for a test based on an approximate p-value, such as a large-sample test, this holds only approximately.
DefDefinition 8 (Statistically significant)
Definition 8 (Statistically significant) A result is statistically significant at level \(\alpha\) if it leads a test with significance level \(\alpha\) to reject the null hypothesis.
ExmExample 3 (Testing whether population mean cholesterol differs by CHD status)
Example 3 (Testing whether population mean cholesterol differs by CHD status) Continuing Example 2, let \(\bar x_1\) and \(\bar x_0\) be the two groups’ sample mean cholesterol, with sample variances \(s_1^2\) and \(s_0^2\) and sample sizes \(n_1\) and \(n_0\). By the central limit theorem, when \(H_0\) holds and the samples are large, the statistic
\[Z \stackrel{\text{def}}{=}\frac{\bar x_1 - \bar x_0}{\sqrt{s_1^2/n_1 + s_0^2/n_0}}\]
has approximately a standard Gaussian distribution. Extreme values in either direction are evidence for the two-sided \(H_1\), so the test statistic is \(T = \mathopen{}\left|Z\right|\mathclose{}\), and the p-value is \(\Pr(\mathopen{}\left|Z\right|\mathclose{} \ge \mathopen{}\left|z\right|\mathclose{}) = 2\Phi(-\mathopen{}\left|z\right|\mathclose{})\), where \(\Phi\) is the standard Gaussian CDF.
The p-value is far below 0.05, so at significance level 0.05 the test rejects \(H_0\): the data provide statistically significant evidence that population mean cholesterol differs between the two groups.
VideosWatch
5MinuteAI explains hypothesis testing in five minutes, following the University of Washington’s CSE 312 [7].
ReadingRead
- Hogg et al. [8, Sec. 8.1], pp. 361–368 covers tests about one mean.
- Hogg et al. [8, Sec. 8.6], pp. 403–409 covers power of a statistical test.
- Casella and Berger [9, Sec. 8.3], pp. 382–401 covers methods of evaluating tests.
- Rice [10, Sec. 9.2], pp. 331–336 covers the Neyman–Pearson paradigm.
3 Reference distributions
The tests on this page compare a test statistic with one of three families of distributions, each built from independent standard Gaussian random variables. Here, “independent” means mutually independent.
DefDefinition 9 (Chi-square distribution)
Definition 9 (Chi-square distribution) Let \(Z_1, \ldots, Z_k\) be independent random variables, each with the standard Gaussian distribution. The distribution of \(\sum_{j=1}^{k} Z_j^2\) is the chi-square distribution with \(k\) degrees of freedom, written \(\chi^2_k\).
Source: Wikipedia contributors [11].
Example 4 (The 0.95 quantile of \(\chi^2_1\)) By Definition 9, a \(\chi^2_1\) random variable is \(Z^2\) for a standard Gaussian \(Z\). So \(\Pr(Z^2 \le c) = \Pr(-\sqrt{c} \le Z \le \sqrt{c})\), and the 0.95 quantile of \(\chi^2_1\) is the square of the 0.975 quantile of the standard Gaussian distribution:
DefDefinition 10 (t-distribution (Student’s t-distribution))
Definition 10 (t-distribution (Student’s t-distribution)) Let \(Z\) have the standard Gaussian distribution, let \(V\) have the \(\chi^2_k\) distribution (Definition 9), and let \(Z\) and \(V\) be independent. The distribution of
\[\frac{Z}{\sqrt{V/k}}\]
is the t-distribution with \(k\) degrees of freedom (or Student’s t-distribution), written \(t_k\) [12].
ExmExample 5 (t quantiles approach Gaussian quantiles)
Example 5 (t quantiles approach Gaussian quantiles) The 0.975 quantile of \(t_k\) is larger than the standard Gaussian’s 0.975 quantile, 1.96, and approaches it as \(k\) grows:
So t-based intervals and tests differ noticeably from Gaussian-based ones only in small samples.
DefDefinition 11 (F-distribution)
Definition 11 (F-distribution) Let \(U\) have the \(\chi^2_{k_1}\) distribution, let \(V\) have the \(\chi^2_{k_2}\) distribution, and let \(U\) and \(V\) be independent. The distribution of
\[\frac{U / k_1}{V / k_2}\]
is the F-distribution with \(k_1\) and \(k_2\) degrees of freedom, written \(F_{k_1, k_2}\).
ExmExample 6 (A squared t random variable has an F-distribution)
Example 6 (A squared t random variable has an F-distribution) Let \(T = Z / \sqrt{V/k}\) as in Definition 10. Then
\[T^2 = \frac{Z^2 / 1}{V / k},\]
where \(Z^2\) has the \(\chi^2_1\) distribution (Definition 9) and is independent of \(V\). So \(T^2\) has the \(F_{1, k}\) distribution (Definition 11), and the 0.95 quantile of \(F_{1, k}\) is the square of the 0.975 quantile of \(t_k\):
4 Confidence intervals
DefDefinition 12 (Confidence interval)
Definition 12 (Confidence interval) A \(100(1-\alpha)\%\) confidence interval for a parameter \(\theta\) is a random closed interval \({\mathopen{}\left[{L\mathopen{}\left(X\right)\mathclose{}}, {U\mathopen{}\left(X\right)\mathclose{}}\right]\mathclose{}}\) whose endpoints \({L\mathopen{}\left(X\right)\mathclose{}} \le {U\mathopen{}\left(X\right)\mathclose{}}\) are statistics computed from the data \(X\), such that for every possible value of \(\theta\):
\[{\Pr_{\theta}\mathopen{}\left(\theta\in {\mathopen{}\left[{L\mathopen{}\left(X\right)\mathclose{}}, {U\mathopen{}\left(X\right)\mathclose{}}\right]\mathclose{}}\right)\mathclose{}} \ge 1 - \alpha\]
The probability is over repeated samples from the data-generating process, with \(\theta\) held fixed. The interval is random and \(\theta\) is not.
Source: [9], Definitions 9.1.1, 9.1.4 and 9.1.5.
DefDefinition 13 (Coverage probability)
Definition 13 (Coverage probability) The coverage probability of an interval \({\mathopen{}\left[{L\mathopen{}\left(X\right)\mathclose{}}, {U\mathopen{}\left(X\right)\mathclose{}}\right]\mathclose{}}\) for a parameter \(\theta\) is \({\Pr_{\theta}\mathopen{}\left(\theta\in {\mathopen{}\left[{L\mathopen{}\left(X\right)\mathclose{}}, {U\mathopen{}\left(X\right)\mathclose{}}\right]\mathclose{}}\right)\mathclose{}}\), computed over repeated samples with \(\theta\) held fixed. A \(100(1-\alpha)\%\) confidence interval has coverage probability at least \(1 - \alpha\) for every \(\theta\).
Source: [9], Definition 9.1.4.
DefDefinition 14 (Confidence coefficient)
Definition 14 (Confidence coefficient) The confidence coefficient of an interval \({\mathopen{}\left[{L\mathopen{}\left(X\right)\mathclose{}}, {U\mathopen{}\left(X\right)\mathclose{}}\right]\mathclose{}}\) for a parameter \(\theta\) is the infimum over \(\theta\) of its coverage probability, \(\inf_{\theta} {\Pr_{\theta}\mathopen{}\left(\theta\in {\mathopen{}\left[{L\mathopen{}\left(X\right)\mathclose{}}, {U\mathopen{}\left(X\right)\mathclose{}}\right]\mathclose{}}\right)\mathclose{}}\).
Source: [9], Definition 9.1.5.
DefDefinition 15 (Exact confidence interval)
Definition 15 (Exact confidence interval) A \(100(1-\alpha)\%\) confidence interval \({\mathopen{}\left[{L\mathopen{}\left(X\right)\mathclose{}}, {U\mathopen{}\left(X\right)\mathclose{}}\right]\mathclose{}}\) is exact when its coverage probability equals \(1 - \alpha\) for every possible value of \(\theta\).
DefDefinition 16 (Conservative confidence interval)
Definition 16 (Conservative confidence interval) A \(100(1-\alpha)\%\) confidence interval \({\mathopen{}\left[{L\mathopen{}\left(X\right)\mathclose{}}, {U\mathopen{}\left(X\right)\mathclose{}}\right]\mathclose{}}\) is conservative when its coverage probability is at least \(1 - \alpha\) for every possible value of \(\theta\) and larger than \(1 - \alpha\) for some possible value of \(\theta\).
DefDefinition 17 (Confidence set)
Definition 17 (Confidence set) A \(100(1-\alpha)\%\) confidence set for a parameter \(\theta\) is a random subset \(C(X)\) of the parameter space, computed from the data \(X\), such that for every possible value of \(\theta\):
\[{\Pr_{\theta}\mathopen{}\left(\theta\in C(X)\right)\mathclose{}} \ge 1 - \alpha\]
A confidence interval is a confidence set whose values are closed intervals.
Source: [9, Sec. 9.1].
ExmExample 7 (A conservative interval for a binomial proportion)
Example 7 (A conservative interval for a binomial proportion) Let \(X \sim \text{Bin}(n, p)\) with \(n = 20\), and let \({\mathopen{}\left[{L\mathopen{}\left(X\right)\mathclose{}}, {U\mathopen{}\left(X\right)\mathclose{}}\right]\mathclose{}}\) be the Clopper-Pearson 95% interval returned by binom.test(). Its coverage probability at each \(p\) is the sum of the binomial probabilities of the values \(x\) of \(X\) for which \({\mathopen{}\left[{L\mathopen{}\left(x\right)\mathclose{}}, {U\mathopen{}\left(x\right)\mathclose{}}\right]\mathclose{}}\) contains \(p\):
The smallest coverage probability on this grid is 0.959, and the largest is 0.994. The grid is coarse and the coverage probability jumps at the interval endpoints, so the smallest grid value is only an upper bound for the confidence coefficient. The Clopper-Pearson interval is built to have coverage probability at least 0.95 at every \(p\), and here it is above 0.95 at all 99 grid values of \(p\), so it is conservative.
RemarkRemark 3 (Why most intervals are conservative)
Remark 3 (Why most intervals are conservative). Definition 12 requires the coverage probability to be at least \(1 - \alpha\) at every \(\theta\), which is the same as requiring the confidence coefficient to be at least \(1 - \alpha\). The coverage probability can depend on \(\theta\), and the confidence coefficient is its greatest lower bound, which the coverage probability need not attain at any \(\theta\). An exact interval has the same coverage probability at every \(\theta\). Discrete data take only countably many values, so they usually allow only a conservative interval, as Example 7 shows. A confidence set drops the requirement that the region be an interval.
DefDefinition 18 (Approximate confidence interval)
Definition 18 (Approximate confidence interval) An approximate \(100(1-\alpha)\%\) confidence interval is an interval whose coverage probability is approximately \(1 - \alpha\), for example only in large samples.
ExmExample 8 (Confidence interval for population mean cholesterol in the WCGS)
Example 8 (Confidence interval for population mean cholesterol in the WCGS) By the central limit theorem, the sample mean \(\bar X\) of a large sample has approximately a Gaussian distribution with mean \(\mu\) and standard error \(\sigma/\sqrt{n}\), which we estimate by \(s/\sqrt{n}\). So \(\bar x \pm z_{0.975} \, s/\sqrt{n}\), where \(z_{0.975} \approx 1.96\) is the 0.975 quantile of the standard Gaussian distribution, is an approximate 95% confidence interval for \(\mu\):
DefDefinition 19 (Margin of error (radius))
Definition 19 (Margin of error (radius)) The margin of error (or radius) of a confidence interval is half the interval’s width.
Source: Wikipedia contributors [13].
ExmExample 9 (Margin of error for population mean cholesterol)
Example 9 (Margin of error for population mean cholesterol) In Example 8, the margin of error is \(z_{0.975} \times s/\sqrt{n} \approx\) 1.52 mg/dL.
VideosWatch
5MinuteAI explains confidence intervals in five minutes, following the University of Washington’s CSE 312 [7].
ReadingRead
- Hogg et al. [8, Sec. 7.1], pp. 307–313 covers confidence intervals for means.
- Casella and Berger [9, Sec. 9.2], pp. 420–439 covers methods of finding interval estimators.
- Rice [10, Sec. 9.3], pp. 337–338 covers duality of confidence intervals and hypothesis tests.
5 Further reading on confidence intervals
For more on confidence intervals:
6 Interpretation of negative findings
If a confidence interval includes the null value, or a hypothesis test fails to reject the null hypothesis, that result does not necessarily mean that the null hypothesis is true. (When the interval and the test are built from the same statistic, with coverage \(1 - \alpha\) and significance level \(\alpha\), the two results coincide.) So we should not interpret such results as “the odds (or risks, hazards, or means) are not significantly different”. Instead, we should write something like “the data do not provide statistically significant evidence that the odds (or risks, hazards, or means) differ”. Statistical significance is a property of evidence, not of the estimands.
P-values do not distinguish between absence of evidence and evidence of absence. Confidence intervals do:
- a narrow confidence interval that includes the null value is evidence of absence (of any effect large enough to matter);
- a confidence interval that includes the null value but also includes substantially non-null values represents absence of evidence.
Conversely, even statistically significant evidence of a non-null value does not mean the value is large enough to matter; that depends on what the estimand is. For example, we might have statistically significant evidence that an exercise program prolongs human lifespans by 20 seconds, but an effect that small would be negligible in practical terms.
Figure 1 sketches these scenarios.
Show code
ci_scenarios <- tibble::tribble(
  ~scenario, ~lower, ~upper,
  "not enough data: we know almost nothing", 0.2, 5,
  "absence of evidence", 0.5, 2,
  "\"trending toward significance\" (still absence of evidence)", 0.95, 2.5,
  "evidence of absence", 0.97, 1.03,
  "evidence of a negligible effect", 1.02, 1.1,
  "uncertain whether negligible or substantial", 1.05, 1.8,
  "evidence of a substantial effect", 1.7, 1.8,
  "substantial, but imprecise", 1.5, 4
) |>
  dplyr::mutate(scenario = factor(scenario, levels = rev(scenario)))

ci_scenarios |>
  ggplot2::ggplot() +
  ggplot2::aes(y = scenario, xmin = lower, xmax = upper) +
  ggplot2::geom_errorbarh(height = 0.3) +
  ggplot2::geom_vline(xintercept = 1, linetype = "dashed") +
  ggplot2::scale_x_log10() +
  ggplot2::labs(x = "Ratio estimand (log scale); null value = 1", y = NULL)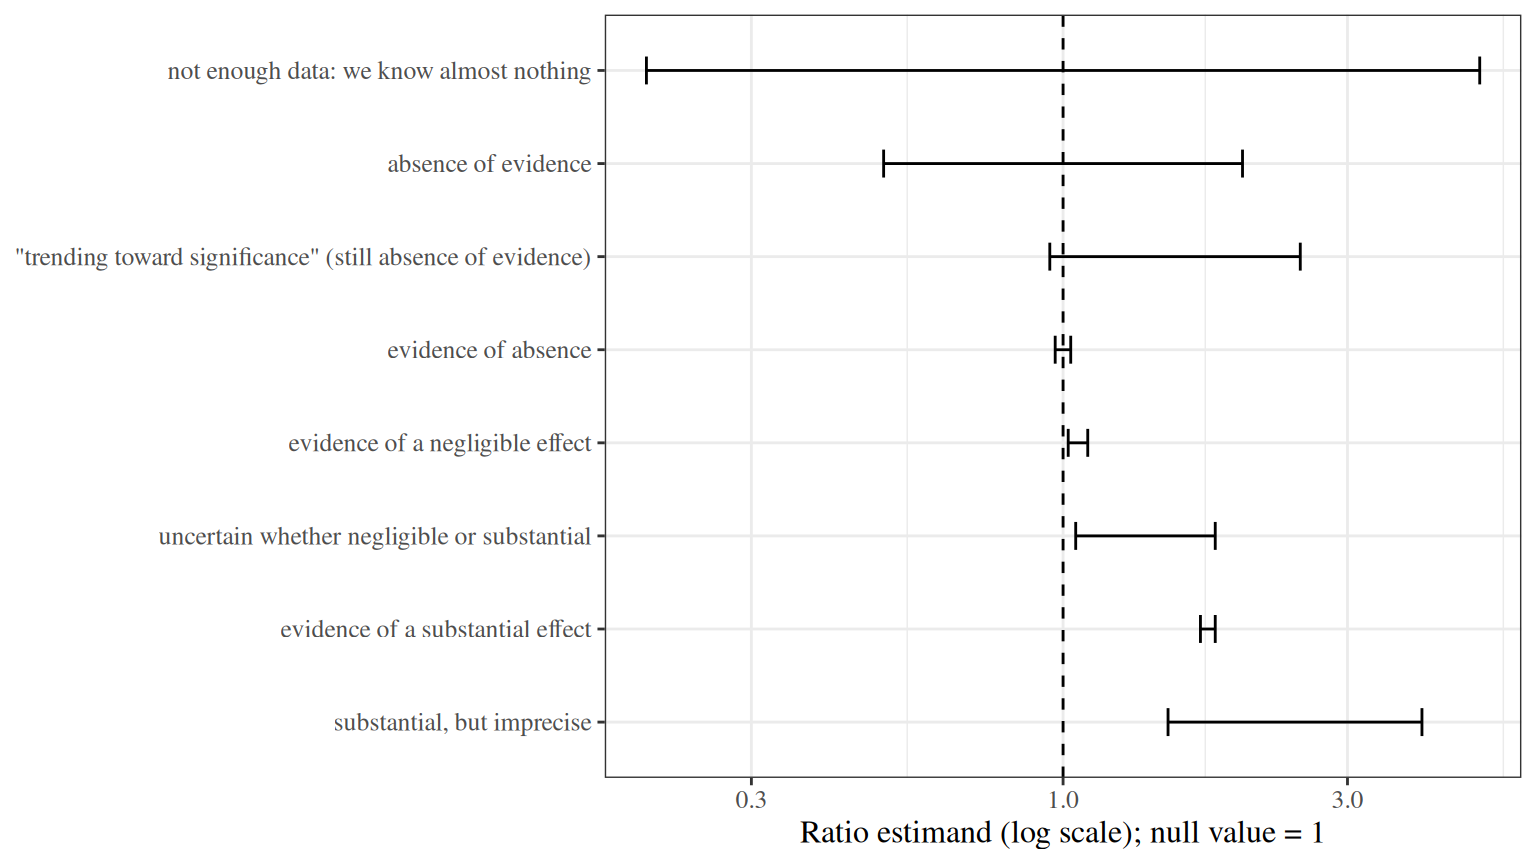
See also [14, Sec. 3.7].
Definitions on this page
- Definition 1 (Statistical inference)
- Definition 2 (Null hypothesis)
- Definition 3 (Alternative hypothesis)
- Definition 4 (Two-sided alternative)
- Definition 5 (Test statistic)
- Definition 6 (p-value)
- Definition 7 (Significance level)
- Definition 8 (Statistically significant)
- Definition 9 (Chi-square distribution)
- Definition 10 (t-distribution (Student’s t-distribution))
- Definition 11 (F-distribution)
- Definition 12 (Confidence interval)
- Definition 13 (Coverage probability)
- Definition 14 (Confidence coefficient)
- Definition 15 (Exact confidence interval)
- Definition 16 (Conservative confidence interval)
- Definition 17 (Confidence set)
- Definition 18 (Approximate confidence interval)
- Definition 19 (Margin of error (radius))
References
[1]
Wikipedia contributors, “Statistical inference — Wikipedia, the free encyclopedia.” 2025. Available: https://en.wikipedia.org/w/index.php?title=Statistical_inference&oldid=1304071803
[2]
Wikipedia contributors, “Statistical hypothesis test — Wikipedia, the free encyclopedia.” 2026. Available: https://en.wikipedia.org/wiki/Statistical_hypothesis_test
[3]
Wikipedia contributors, “One- and two-tailed tests — Wikipedia, the free encyclopedia.” 2026. Available: https://en.wikipedia.org/wiki/One-_and_two-tailed_tests
[4]
Wikipedia contributors, “Test statistic — Wikipedia, the free encyclopedia.” 2026. Available: https://en.wikipedia.org/wiki/Test_statistic
[5]
Wikipedia contributors, “P-value — Wikipedia, the free encyclopedia.” 2026. Available: https://en.wikipedia.org/wiki/P-value
[6]
Wikipedia contributors, “Statistical significance — Wikipedia, the free encyclopedia.” 2026. Available: https://en.wikipedia.org/wiki/Statistical_significance
[7]
5MinuteAI, “Probability & statistics.” Video playlist on YouTube. Accessed: Oct. 12, 2026. [Online]. Available: https://www.youtube.com/playlist?list=PLeB45KifGiuHesi4PALNZSYZFhViVGQJK
[8]
R. V. Hogg, E. A. Tanis, and D. L. Zimmerman, Probability and statistical inference, Tenth edition. Boston: Pearson, 2019.
[9]
G. Casella and R. Berger, Statistical inference, 2nd ed. Cengage Learning, 2002. Available: https://www.cengage.com/c/statistical-inference-2e-casella-berger/9780534243128/
[10]
J. A. Rice, Mathematical statistics and data analysis, 3rd ed. Belmont, CA: Cengage Learning, 2007.
[11]
Wikipedia contributors, “Chi-squared distribution — Wikipedia, the free encyclopedia.” 2026. Available: https://en.wikipedia.org/wiki/Chi-squared_distribution
[12]
Wikipedia contributors, “Student’s t-distribution — Wikipedia, the free encyclopedia.” 2026. Available: https://en.wikipedia.org/wiki/Student%27s_t-distribution
[13]
Wikipedia contributors, “Margin of error — Wikipedia, the free encyclopedia.” 2026. Available: https://en.wikipedia.org/wiki/Margin_of_error
[14]
E. Vittinghoff, D. V. Glidden, S. C. Shiboski, and C. E. McCulloch, Regression methods in biostatistics: Linear, logistic, survival, and repeated measures models, 2nd ed. Springer, 2012. doi: 10.1007/978-1-4614-1353-0.