Correlation and Simple Linear Regression
This page reviews two ways to relate two continuous variables: correlation coefficients, with tests of whether they differ from zero, and simple linear regression. It uses the \(t\) reference distribution defined on the Statistical Inference page. This page is adapted from Vittinghoff et al. [1], Chapter 3.
1 The HERS data
The examples on this page use the HERS data, which the Comparing Means page describes. The rmb R package includes the dataset; haven::as_factor() converts its Stata value labels to factors:
2 Correlation
2.1 Testing the Pearson correlation
DefDefinition 1 (Population correlation)
Definition 1 (Population correlation) The population correlation of two random variables \(X\) and \(Y\) with positive variances is
\[\rho\stackrel{\text{def}}{=}\frac{{\operatorname{Cov}\mathopen{}\left(X, Y\right)\mathclose{}}}{\sqrt{{\operatorname{Var}\mathopen{}\left(X\right)\mathclose{}} {\operatorname{Var}\mathopen{}\left(Y\right)\mathclose{}}}},\]
where \({\operatorname{Cov}\mathopen{}\left(X, Y\right)\mathclose{}}\) is their covariance.
Source: Wikipedia contributors [2].
RemarkRemark 1 (The sample correlation estimates the population correlation)
Remark 1 (The sample correlation estimates the population correlation). The Pearson correlation coefficient \(r\) of a sample is the corresponding sample statistic, and estimates \(\rho\).
DefDefinition 2 (Test of zero correlation)
Definition 2 (Test of zero correlation) Let \(r\) be the Pearson correlation coefficient of \(n \ge 3\) pairs, with \(\mathopen{}\left|r\right|\mathclose{} < 1\). The t-test of zero correlation of \(H_0: \rho= 0\) against \(H_1: \rho\neq 0\) (Definition 1) uses the statistic
\[t \stackrel{\text{def}}{=}\frac{r \sqrt{n - 2}}{\sqrt{1 - r^2}}.\]
Its p-value is \(\Pr(\mathopen{}\left|T\right|\mathclose{} \ge \mathopen{}\left|t\right|\mathclose{})\), where \(T\) has the \(t_{n-2}\) distribution (t-distribution).
LemTheorem 1 (Null distribution of the correlation t statistic)
Theorem 1 (Null distribution of the correlation t statistic) Let the pairs \((X_1, Y_1), \ldots, (X_n, Y_n)\) be independent, and let each \(Y_i\), given \(X_1, \ldots, X_n\), be Gaussian with a mean and variance that do not depend on the \(X\) values. Then the statistic \(t\) of Definition 2 has the \(t_{n-2}\) distribution [3, Sec. 9.6], pp. 472-473:
\[ t \sim t_{n-2}. \]
RemarkRemark 2 (When the conditions hold)
Remark 2 (When the conditions hold). The conditions of Theorem 1 hold, for example, when the pairs are independent draws from a bivariate Gaussian distribution with \(\rho= 0\).
ExmExample 1 (Correlation between BMI and fasting glucose in HERS)
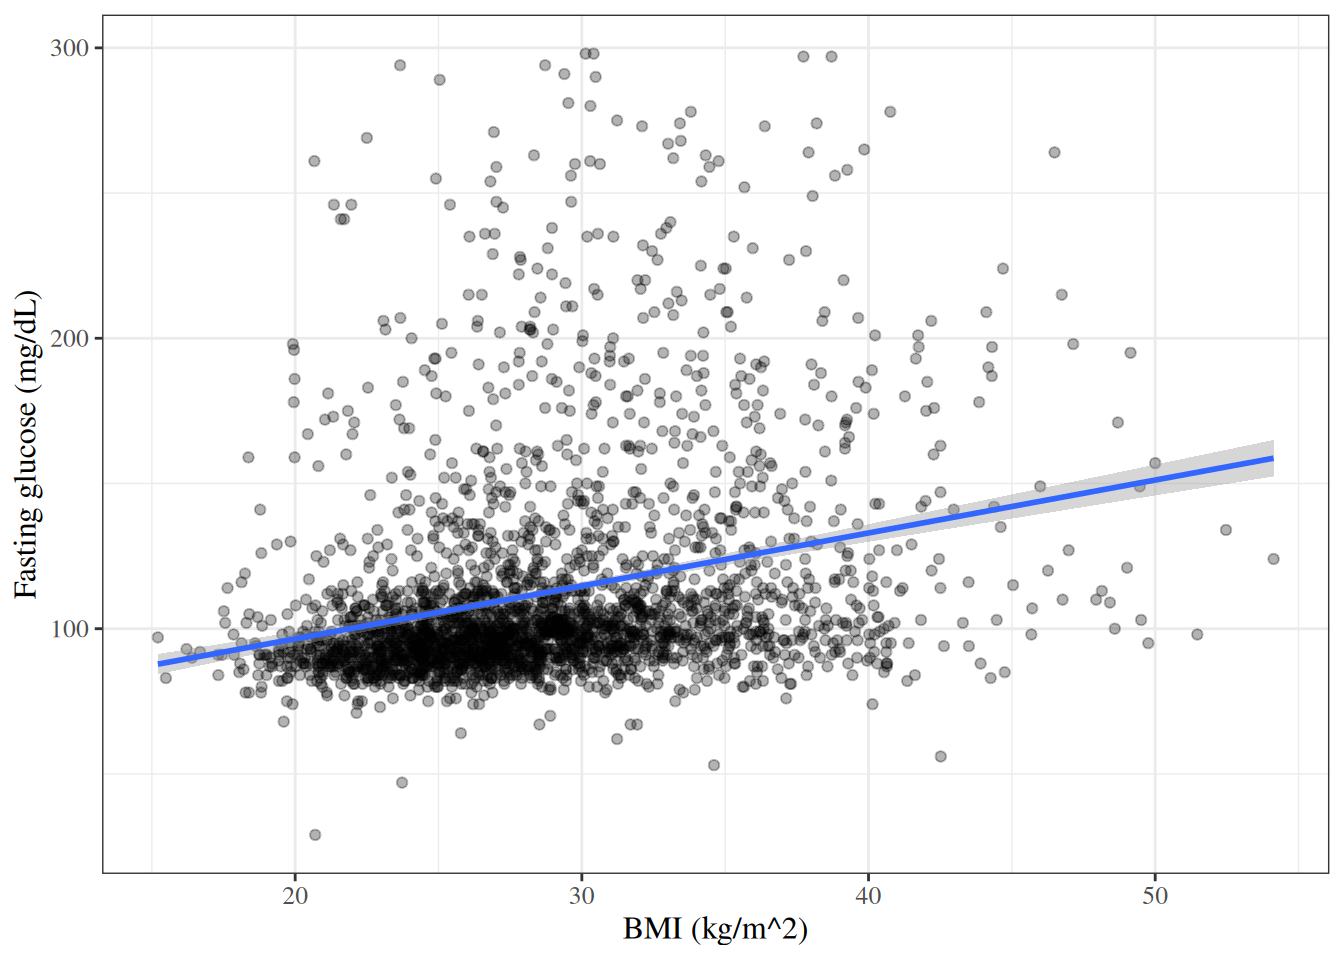
Example 1 (Correlation between BMI and fasting glucose in HERS) Figure 1 plots baseline fasting glucose against BMI.
Show code
hers |>
  dplyr::filter(!is.na(BMI)) |>
  ggplot2::ggplot() +
  ggplot2::aes(x = BMI, y = glucose) +
  ggplot2::geom_point(alpha = 0.3) +
  ggplot2::geom_smooth(method = "lm", formula = y ~ x) +
  ggplot2::labs(
    x = "BMI (kg/m^2)",
    y = "Fasting glucose (mg/dL)"
  )
The statistic of Definition 2, using the 2758 participants with a BMI measurement:
cor.test() reports the same values, and a confidence interval for \(\rho\):
cor.test(hers$BMI, hers$glucose, method = "pearson")
#>
#>  Pearson's product-moment correlation
#>
#> data:  hers$BMI and hers$glucose
#> t = 14.88, df = 2756, p-value <2e-16
#> alternative hypothesis: true correlation is not equal to 0
#> 95 percent confidence interval:
#>  0.237760 0.306865
#> sample estimates:
#>      cor
#> 0.272664
The correlation is positive but modest: glucose tends to be higher at higher BMI, with wide scatter around the line in Figure 1.
ReadingRead
- Hogg et al. [3, Sec. 9.6], pp. 471–476 covers tests concerning regression and correlation.
- Rice [4, Sec. 14.2.3], pp. 560–563 covers correlation and regression.
2.2 Spearman rank correlation
DefDefinition 3 (Spearman rank correlation)
Definition 3 (Spearman rank correlation) Replace each \(x_i\) by its rank \(u_i\) among \(x_1, \ldots, x_n\), and each \(y_i\) by its rank \(v_i\) among \(y_1, \ldots, y_n\), giving tied values the average of the ranks they span. The Spearman rank correlation \(r_S\) is the Pearson correlation coefficient evaluated at the rank pairs:
\[ r_S \stackrel{\text{def}}{=}r\mathopen{}\left((u_1, v_1), \ldots, (u_n, v_n)\right)\mathclose{}. \]
Source: Wikipedia contributors [5].
RemarkRemark 3 (What the Spearman correlation measures)
Remark 3 (What the Spearman correlation measures). Because ranks depend only on the ordering of the values, \(r_S\) measures how close the association is to monotone, whether or not it is linear, and a single extreme value moves \(r_S\) less than it moves \(r\).
ExmExample 2 (Spearman correlation between BMI and fasting glucose in HERS)
Example 2 (Spearman correlation between BMI and fasting glucose in HERS) The Pearson correlation of the ranks (Definition 3), and cor.test()’s Spearman test (exact = FALSE, because tied values rule out the exact p-value):
hers_bmi <- hers |> dplyr::filter(!is.na(BMI))
cor(rank(hers_bmi$BMI), rank(hers_bmi$glucose))
#> [1] 0.333751
cor.test(hers_bmi$BMI, hers_bmi$glucose, method = "spearman", exact = FALSE)
#>
#>  Spearman's rank correlation rho
#>
#> data:  hers_bmi$BMI and hers_bmi$glucose
#> S = 2.33e+09, p-value <2e-16
#> alternative hypothesis: true rho is not equal to 0
#> sample estimates:
#>      rho
#> 0.333751
\(r_S\) is larger than the Pearson \(r\) of Example 1: the association is closer to monotone than to linear.
3 Simple linear regression
3.1 Model specification
DefDefinition 4 (Conditional Gaussian model)
Definition 4 (Conditional Gaussian model) A conditional Gaussian model for outcomes \(Y_1, \ldots, Y_n\) with covariate values \(x_1, \ldots, x_n\) (each a single value or a vector) says that, given the covariates, the outcomes are independent and Gaussian: outcome \(Y_i\) is centered on a mean function \(\mu(x)\) evaluated at \(x_i\), and has its own variance \(\sigma^2_i\):
\[ \begin{aligned} Y_i\mid X_i= x_i&\ \sim_{\perp\!\!\!\perp}\ {\operatorname{N}\mathopen{}\left(\mu_i, \sigma^2_i\right)\mathclose{}},\\ \mu_i&\stackrel{\text{def}}{=}\mu(x_i). \end{aligned} \]
DefDefinition 5 (Deviation from the conditional mean)
Definition 5 (Deviation from the conditional mean) In a conditional Gaussian model (Definition 4), the deviation \(\mathbb{d}_i\) of outcome \(Y_i\) is its deviation from its population mean, taking the mean conditional on \(X_i= x_i\):
\[\mathbb{d}_i\stackrel{\text{def}}{=}Y_i- \mu(x_i).\]
ExrExercise 1 (Decomposing an outcome)
Exercise 1 (Decomposing an outcome) Express each outcome \(Y_i\) in a conditional Gaussian model (Definition 4) in terms of its conditional mean \(\mu_i\) and its deviation \(\mathbb{d}_i\) (Definition 5).
LemTheorem 2 (Additive form of the conditional Gaussian model)
Theorem 2 (Additive form of the conditional Gaussian model) In a conditional Gaussian model (Definition 4), each outcome is its conditional mean plus its deviation (Definition 5):
\[Y_i= \mu_i+ \mathbb{d}_i.\]
ProofProof
Proof. This is the solution to Exercise 1.
ExrExercise 2 (Distribution of the deviations)
Exercise 2 (Distribution of the deviations) Find the joint distribution of the deviations (Definition 5) in a conditional Gaussian model (Definition 4), given the covariate values.
LemTheorem 3 (Distribution of the deviations)
Theorem 3 (Distribution of the deviations) In a conditional Gaussian model (Definition 4), given the covariates, the deviations (Definition 5) are independent and Gaussian with mean 0 and variance \(\sigma^2_i\):
\[\mathbb{d}_i\mid X_i= x_i\ \sim_{\perp\!\!\!\perp}\ {\operatorname{N}\mathopen{}\left(0, \sigma^2_i\right)\mathclose{}}.\]
ProofProof
Proof. This is the solution to Exercise 2.
DefDefinition 6 (Homoskedastic model)
Definition 6 (Homoskedastic model) A conditional Gaussian model (Definition 4) is homoskedastic if all outcomes share one variance \(\sigma^2\), which does not depend on \(i\):
\[\sigma^2_i= \sigma^2\text{ for all } i.\]
Source: Wikipedia contributors [6].
CorCorollary 1 (Deviations in a homoskedastic model)
Corollary 1 (Deviations in a homoskedastic model) In a homoskedastic model (Definition 6), the deviations (Definition 5) all have the same variance \(\sigma^2\):
\[\mathbb{d}_i\mid X_i= x_i\ \sim_{\perp\!\!\!\perp}\ {\operatorname{N}\mathopen{}\left(0, \sigma^2\right)\mathclose{}}.\]
ProofProof
Proof. By Theorem 3, \(\mathbb{d}_i\mid X_i= x_i\ \sim_{\perp\!\!\!\perp}\ {\operatorname{N}\mathopen{}\left(0, \sigma^2_i\right)\mathclose{}}\), and Definition 6 sets \(\sigma^2_i= \sigma^2\) for all \(i\).
DefDefinition 7 (Linear regression model)
Definition 7 (Linear regression model) A linear regression model is a homoskedastic (Definition 6) conditional Gaussian model (Definition 4) whose mean function is linear in \(p\) covariates, where observation \(i\) has covariate values \(\mathord{\smash[b]{\underset{\raise.3ex\hbox{$\scriptstyle\sim$}}{x}}\vphantom{x}}_i= (x_{i1}, \ldots, x_{ip})\):
\[\mu(x_1, \ldots, x_p) \stackrel{\text{def}}{=}\beta_{0}+ \sum_{j=1}^p\beta_{x_j} x_j.\]
Source: Wikipedia contributors [7].
DefDefinition 8 (Simple linear regression model)
Definition 8 (Simple linear regression model) A simple linear regression model is a linear regression model (Definition 7) with \(p = 1\) covariate \(X\), writing \(x_i\) for \(x_{i1}\):
\[\mu(x) \stackrel{\text{def}}{=}\beta_{0}+ \beta_{x} x.\]
Source: Wikipedia contributors [8].
DefDefinition 9 (Intercept)
Definition 9 (Intercept) In a simple linear regression model (Definition 8), the intercept is \(\beta_{0}= \mu(0)\): the mean of \(Y\) among observations with \(X = 0\).
DefDefinition 10 (Slope)
Definition 10 (Slope) In a simple linear regression model (Definition 8), the slope is \(\beta_{x} = \mu(x + 1) - \mu(x)\): the difference in the mean of \(Y\) between two groups whose values of \(X\) differ by one unit.
RemarkRemark 4 (Interpreting the variance parameter)
Remark 4 (Interpreting the variance parameter). \(\sigma^2\) is the variance of \(Y\) around its mean at each value of \(X\).
3.2 Ordinary least squares estimation
DefDefinition 11 (Residual sum of squares)
Definition 11 (Residual sum of squares) For a regression model whose conditional mean \(\mu(x; \mathord{\smash[b]{\underset{\raise.3ex\hbox{$\scriptstyle\sim$}}{\theta}}\vphantom{\theta}})\) depends on a parameter vector \(\mathord{\smash[b]{\underset{\raise.3ex\hbox{$\scriptstyle\sim$}}{\theta}}\vphantom{\theta}}\), the residual sum of squares at \(\mathord{\smash[b]{\underset{\raise.3ex\hbox{$\scriptstyle\sim$}}{\theta}}\vphantom{\theta}}\) is the sum of the squared residuals \(\hat{\varepsilon}_i(\mathord{\smash[b]{\underset{\raise.3ex\hbox{$\scriptstyle\sim$}}{\theta}}\vphantom{\theta}}) \stackrel{\text{def}}{=}y_i- \mu(x_i; \mathord{\smash[b]{\underset{\raise.3ex\hbox{$\scriptstyle\sim$}}{\theta}}\vphantom{\theta}})\) that the model has when its parameters equal \(\mathord{\smash[b]{\underset{\raise.3ex\hbox{$\scriptstyle\sim$}}{\theta}}\vphantom{\theta}}\):
\[\text{RSS}(\mathord{\smash[b]{\underset{\raise.3ex\hbox{$\scriptstyle\sim$}}{\theta}}\vphantom{\theta}}) \stackrel{\text{def}}{=}\sum_{i=1}^n\hat{\varepsilon}_i(\mathord{\smash[b]{\underset{\raise.3ex\hbox{$\scriptstyle\sim$}}{\theta}}\vphantom{\theta}})^2.\]
At the estimate \(\hat{\mathord{\smash[b]{\underset{\raise.3ex\hbox{$\scriptstyle\sim$}}{\theta}}\vphantom{\theta}}}\), \(\hat{\varepsilon}_i(\hat{\mathord{\smash[b]{\underset{\raise.3ex\hbox{$\scriptstyle\sim$}}{\theta}}\vphantom{\theta}}})\) is the residual \(\hat{\varepsilon}_i\) of the fitted model.
Source: Wikipedia contributors [9].
ExmExample 3 (Residual sum of squares of a simple linear regression)
Example 3 (Residual sum of squares of a simple linear regression) The mean function of a simple linear regression model has parameter vector \(\mathord{\smash[b]{\underset{\raise.3ex\hbox{$\scriptstyle\sim$}}{\theta}}\vphantom{\theta}}= (\beta_{0}, \beta_{x})\), so write \(\text{RSS}(\beta_{0}, \beta_{x})\) for its residual sum of squares (Definition 11):
\[ \begin{aligned} \text{RSS}(\beta_{0}, \beta_{x}) &= \sum_{i=1}^n\hat{\varepsilon}_i(\beta_{0}, \beta_{x})^2 && \text{(definition of RSS)}\\ &= \sum_{i=1}^n\mathopen{}\left(y_i- \mu(x_i; \beta_{0}, \beta_{x})\right)\mathclose{}^2 && \text{(definition of $\hat{\varepsilon}_i(\mathord{\smash[b]{\underset{\raise.3ex\hbox{$\scriptstyle\sim$}}{\theta}}\vphantom{\theta}})$)}\\ &= \sum_{i=1}^n\mathopen{}\left(y_i- (\beta_{0}+ \beta_{x} x_i)\right)\mathclose{}^2 && \text{(definition of $\mu(x)$)}\\ &= \sum_{i=1}^n(y_i- \beta_{0}- \beta_{x} x_i)^2 && \text{(distribute the minus sign)} \end{aligned} \]
ExmExample 4 (Residual sum of squares of a line through three points)
Example 4 (Residual sum of squares of a line through three points) For the points \((0, 1)\), \((1, 2)\), \((2, 2)\) and the line with \(\beta_{0}= 1\) and \(\beta_{x} = 0.5\) (Example 3), the residuals are \(1 - 1 = 0\), \(2 - 1.5 = 0.5\), and \(2 - 2 = 0\), so
\[ \begin{aligned} \text{RSS}(1, 0.5) &= 0^2 + 0.5^2 + 0^2 \\ &= 0.25 \end{aligned} \]
(Figure 2).
Show code
rss_points <- tibble::tibble(x = c(0, 1, 2), y = c(1, 2, 2)) |>
  dplyr::mutate(fitted = 1 + 0.5 * x)

ggplot2::ggplot(rss_points, ggplot2::aes(x = x, y = y)) +
  ggplot2::geom_abline(intercept = 1, slope = 0.5) +
  ggplot2::geom_segment(
    ggplot2::aes(xend = x, yend = fitted),
    linetype = "dashed",
    color = "firebrick"
  ) +
  ggplot2::geom_point(size = 3) +
  ggplot2::coord_cartesian(xlim = c(-0.25, 2.25), ylim = c(0.75, 2.25))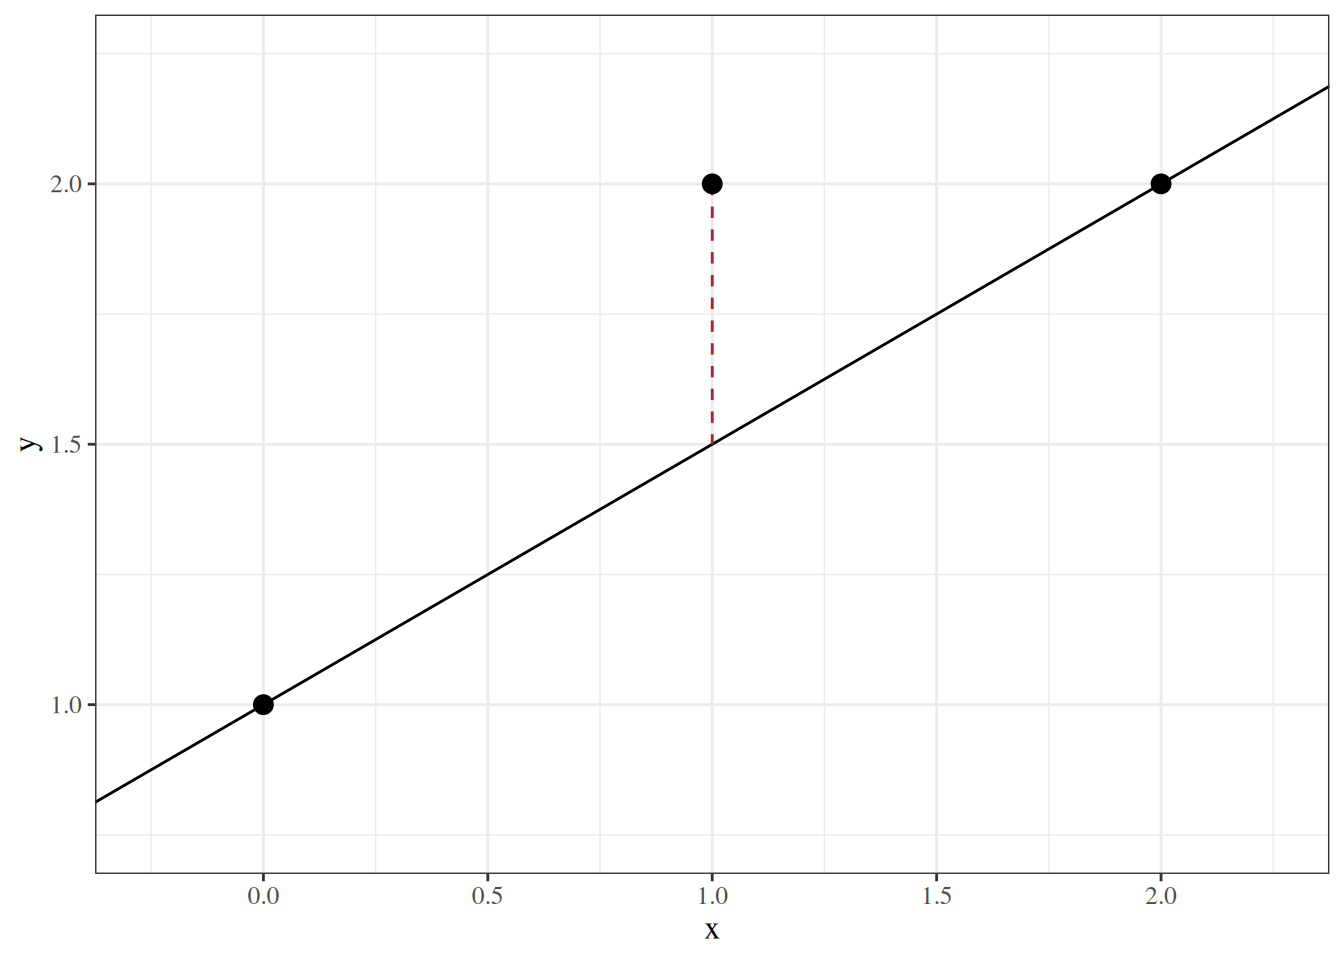
ExrExercise 3 (Sample mean squared error and residual sum of squares)
Exercise 3 (Sample mean squared error and residual sum of squares) For a regression model with conditional mean \(\mu(x; \mathord{\smash[b]{\underset{\raise.3ex\hbox{$\scriptstyle\sim$}}{\theta}}\vphantom{\theta}})\), let \(\hat y_i\stackrel{\text{def}}{=}\mu(x_i; \mathord{\smash[b]{\underset{\raise.3ex\hbox{$\scriptstyle\sim$}}{\theta}}\vphantom{\theta}})\) be its predictions of \(n \ge 1\) outcomes \(y_1, \ldots, y_n\), and let \(\text{RSS}(\mathord{\smash[b]{\underset{\raise.3ex\hbox{$\scriptstyle\sim$}}{\theta}}\vphantom{\theta}})\) (Definition 11) be taken over those same outcomes. Express the sMSE of these predictions in terms of \(\text{RSS}(\mathord{\smash[b]{\underset{\raise.3ex\hbox{$\scriptstyle\sim$}}{\theta}}\vphantom{\theta}})\), and \(\text{RSS}(\mathord{\smash[b]{\underset{\raise.3ex\hbox{$\scriptstyle\sim$}}{\theta}}\vphantom{\theta}})\) in terms of that sMSE.
Theorem 4 (Sample mean squared error is the residual sum of squares divided by \(n\)) For a regression model with conditional mean \(\mu(x; \mathord{\smash[b]{\underset{\raise.3ex\hbox{$\scriptstyle\sim$}}{\theta}}\vphantom{\theta}})\), the sMSE of its predictions \(\hat y_i= \mu(x_i; \mathord{\smash[b]{\underset{\raise.3ex\hbox{$\scriptstyle\sim$}}{\theta}}\vphantom{\theta}})\) of \(n \ge 1\) outcomes \(y_1, \ldots, y_n\) and the residual sum of squares \(\text{RSS}(\mathord{\smash[b]{\underset{\raise.3ex\hbox{$\scriptstyle\sim$}}{\theta}}\vphantom{\theta}})\) (Definition 11) over those same \(n\) outcomes satisfy
\[{\operatorname{sMSE}\mathopen{}\left(\hat y\right)\mathclose{}} = \frac{1}{n} \text{RSS}(\mathord{\smash[b]{\underset{\raise.3ex\hbox{$\scriptstyle\sim$}}{\theta}}\vphantom{\theta}}),\]
and equivalently
\[\text{RSS}(\mathord{\smash[b]{\underset{\raise.3ex\hbox{$\scriptstyle\sim$}}{\theta}}\vphantom{\theta}}) = n \, {\operatorname{sMSE}\mathopen{}\left(\hat y\right)\mathclose{}}.\]
ProofProof
Proof. Both equations are derived in Exercise 3.
RemarkRemark 5 (The same observations on both sides)
Remark 5 (The same observations on both sides). The identities in Theorem 4 need the sMSE and the residual sum of squares to be taken over the same \(n\) observations. The RSS minimized in fitting is taken over the fitting data, so dividing it by \(n\) gives the sMSE on the fitting data, not the sMSE of predictions of new outcomes.
DefDefinition 12 (Ordinary least squares)
Definition 12 (Ordinary least squares) The ordinary least squares (OLS) estimate of a model’s parameter vector \(\mathord{\smash[b]{\underset{\raise.3ex\hbox{$\scriptstyle\sim$}}{\theta}}\vphantom{\theta}}\) is the value of \(\mathord{\smash[b]{\underset{\raise.3ex\hbox{$\scriptstyle\sim$}}{\theta}}\vphantom{\theta}}\) that minimizes the residual sum of squares:
\[\hat{\mathord{\smash[b]{\underset{\raise.3ex\hbox{$\scriptstyle\sim$}}{\theta}}\vphantom{\theta}}} \stackrel{\text{def}}{=}\arg \min_{\mathord{\smash[b]{\underset{\raise.3ex\hbox{$\scriptstyle\sim$}}{\theta}}\vphantom{\theta}}} \text{RSS}(\mathord{\smash[b]{\underset{\raise.3ex\hbox{$\scriptstyle\sim$}}{\theta}}\vphantom{\theta}}).\]
Source: Wikipedia contributors [10].
ExmExample 5 (OLS estimates of a simple linear regression)
Example 5 (OLS estimates of a simple linear regression) For a simple linear regression, the OLS estimates (Definition 12) \(\hat{\beta}_{0}\) and \(\hat{\beta}_{x}\) are the values of \(\beta_{0}\) and \(\beta_{x}\) that minimize \(\text{RSS}(\beta_{0}, \beta_{x})\) from Example 3. Figure 3 shows \(\text{RSS}(\beta_{0}, \beta_{x})\) for the three points of Example 4: the OLS estimates sit at the bottom of the bowl, and the line of Example 4 sits higher up.
Show code
rss_grid <- expand.grid(
  b0 = seq(0, 2.5, length.out = 101),
  bx = seq(-0.5, 1.5, length.out = 101)
)
rss_grid$rss <- mapply(
  function(b0, bx) sum((rss_points$y - b0 - bx * rss_points$x)^2),
  rss_grid$b0,
  rss_grid$bx
)
ols_coefs <- coef(lm(y ~ x, data = rss_points))

ggplot2::ggplot(rss_grid, ggplot2::aes(x = b0, y = bx, z = rss)) +
  ggplot2::geom_contour(
    ggplot2::aes(color = ggplot2::after_stat(level)),
    breaks = c(0.25, 0.5, 1, 2, 4, 8)
  ) +
  ggplot2::annotate(
    "point",
    x = ols_coefs[[1]], y = ols_coefs[[2]], size = 3
  ) +
  ggplot2::annotate("point", x = 1, y = 0.5, shape = 4, size = 3) +
  ggplot2::labs(
    x = expression("Intercept, " * beta[0]),
    y = expression("Slope, " * beta[x]),
    color = "RSS"
  )
Show code
ols_coefs
#> (Intercept)           x
#>     1.16667     0.50000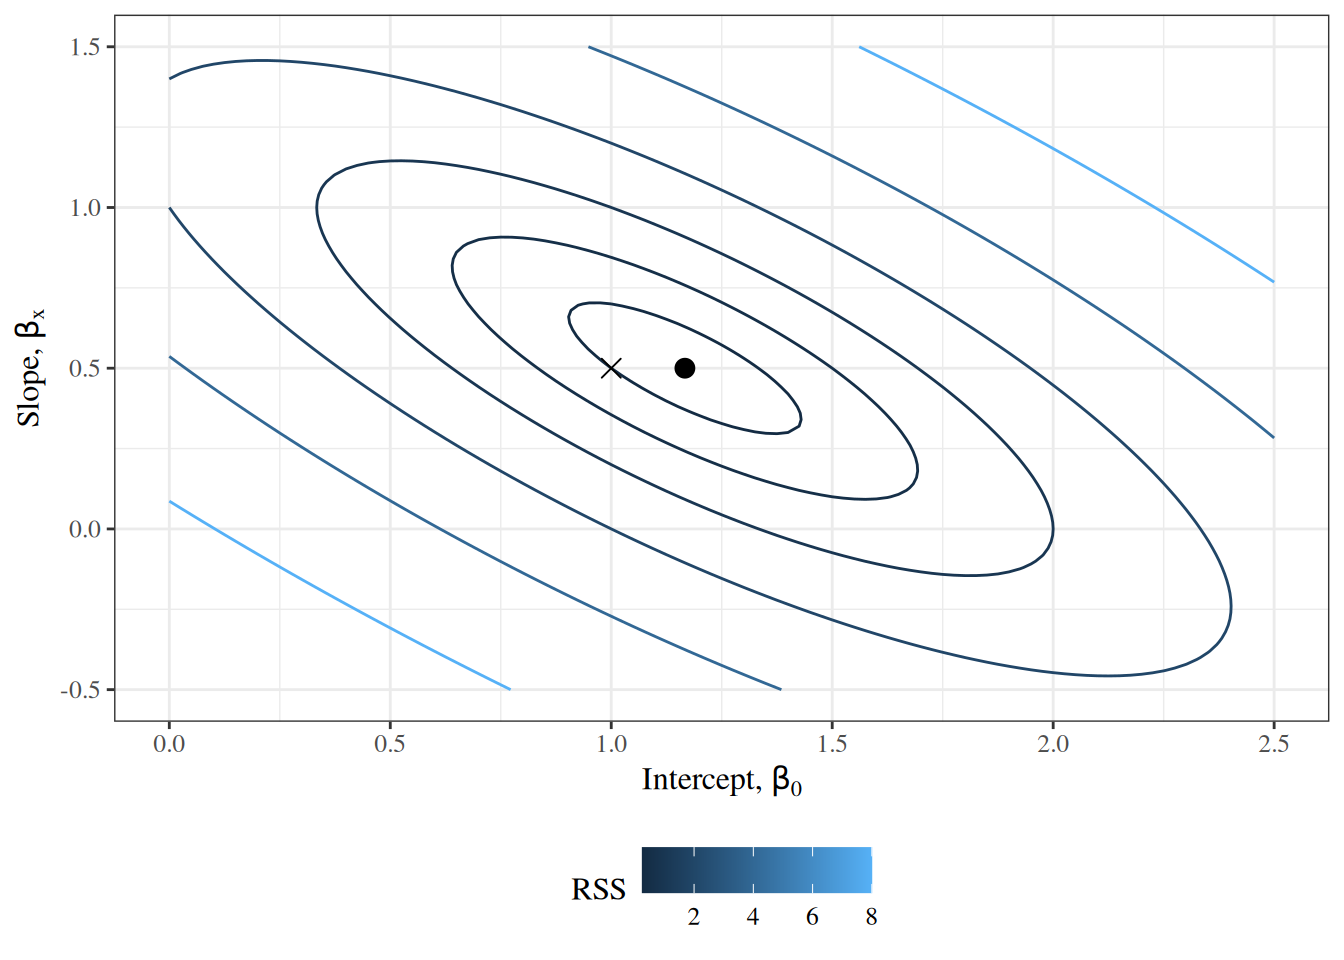
DefDefinition 13 (Normal equations)
Definition 13 (Normal equations) For a model fitted by least squares with parameter vector \(\mathord{\smash[b]{\underset{\raise.3ex\hbox{$\scriptstyle\sim$}}{\theta}}\vphantom{\theta}}\), the normal equations set the gradient of the residual sum of squares to zero:
\[\frac{\partial}{\partial \mathord{\smash[b]{\underset{\raise.3ex\hbox{$\scriptstyle\sim$}}{\theta}}\vphantom{\theta}}} \text{RSS}(\mathord{\smash[b]{\underset{\raise.3ex\hbox{$\scriptstyle\sim$}}{\theta}}\vphantom{\theta}}) = \mathord{\smash[b]{\underset{\raise.3ex\hbox{$\scriptstyle\sim$}}{0}}\vphantom{0}}.\]
ExmExample 6 (Normal equations of a simple linear regression)
Example 6 (Normal equations of a simple linear regression) For a simple linear regression, the parameter vector is \(\mathord{\smash[b]{\underset{\raise.3ex\hbox{$\scriptstyle\sim$}}{\beta}}\vphantom{\beta}}\stackrel{\text{def}}{=}{\mathopen{}\left(\beta_{0}, \beta_{x}\right)\mathclose{}}^{\top}\), and \(\text{RSS}(\mathord{\smash[b]{\underset{\raise.3ex\hbox{$\scriptstyle\sim$}}{\beta}}\vphantom{\beta}})\) is \(\text{RSS}(\beta_{0}, \beta_{x})\) from Example 3. Its gradient has one entry per coefficient, so the normal equations (Definition 13) are two scalar equations:
\[ \frac{\partial \text{RSS}}{\partial \beta_{0}} = 0, \qquad \frac{\partial \text{RSS}}{\partial \beta_{x}} = 0. \]
DefDefinition 14 (Centered sums of squares)
Definition 14 (Centered sums of squares) For data \((x_1, y_1), \ldots, (x_n, y_n)\), the centered sums of squares of the \(x_i\) and of the \(y_i\) are
\[ \begin{aligned} S_{xx}&\stackrel{\text{def}}{=}\sum_{i=1}^n(x_i- {\bar{x}})^2, & S_{yy}&\stackrel{\text{def}}{=}\sum_{i=1}^n(y_i- {\bar{y}})^2. \end{aligned} \]
DefDefinition 15 (Centered sum of cross-products)
Definition 15 (Centered sum of cross-products) For the data of Definition 14, the centered sum of cross-products is
\[ S_{xy}\stackrel{\text{def}}{=}\sum_{i=1}^n(x_i- {\bar{x}})(y_i- {\bar{y}}). \]
ExrExercise 4 (Summing the deviations from the sample mean)
Exercise 4 (Summing the deviations from the sample mean) Find \(\sum_{i=1}^n(x_i- {\bar{x}})\).
LemLemma 1 (Deviations from the sample mean sum to zero)
Lemma 1 (Deviations from the sample mean sum to zero) For any data \(z_1, \ldots, z_n\) with sample mean \(\bar{z}\) (for example, the \(x_i\) or the \(y_i\)), the deviations from the sample mean sum to zero:
\[\sum_{i=1}^n(z_i - \bar{z}) = 0.\]
ProofProof
Proof. This is the solution to Exercise 4.
ExrExercise 5 (Expanding the centered sum of squares)
Exercise 5 (Expanding the centered sum of squares) Expand the centered sum of squares \(S_{xx}\) (Definition 14) into an expression in terms of \(n\), \(\sum_{i=1}^nx_i^2\) and \({\bar{x}}\).
LemLemma 2 (Expanded centered sum of squares)
Lemma 2 (Expanded centered sum of squares) The centered sum of squares \(S_{xx}\) (Definition 14) equals
\[S_{xx}= \sum_{i=1}^nx_i^2 - n {\bar{x}}^2.\]
ProofProof
Proof. This is the solution to Exercise 5.
ExrExercise 6 (Expanding the centered sum of cross-products)
Exercise 6 (Expanding the centered sum of cross-products) Expand the centered sum of cross-products \(S_{xy}\) (Definition 15) into an expression in terms of \(n\), \(\sum_{i=1}^nx_iy_i\), \({\bar{x}}\) and \({\bar{y}}\).
LemLemma 3 (Expanded centered sum of cross-products)
Lemma 3 (Expanded centered sum of cross-products) The centered sum of cross-products \(S_{xy}\) (Definition 15) equals
\[S_{xy}= \sum_{i=1}^nx_iy_i- n {\bar{x}}{\bar{y}}.\]
ProofProof
Proof. This is the solution to Exercise 6.
ExrExercise 7 (Derivative of RSS with respect to the intercept)
Exercise 7 (Derivative of RSS with respect to the intercept) Find the partial derivative of the simple linear regression residual sum of squares \(\text{RSS}(\beta_{0}, \beta_{x})\) (Example 3) with respect to the intercept, \({\partial \text{RSS} / \partial \beta_{0}}\).
ExrExercise 8 (Derivative of RSS in terms of the means)
Exercise 8 (Derivative of RSS in terms of the means) In the setting of Exercise 7, write the partial derivative in terms of \({\bar{x}}\) and \({\bar{y}}\).
LemLemma 4 (Derivative of RSS with respect to the intercept)
Lemma 4 (Derivative of RSS with respect to the intercept) The partial derivative of the simple linear regression residual sum of squares \(\text{RSS}(\beta_{0}, \beta_{x})\) (Example 3) with respect to the intercept is
\[\frac{\partial \text{RSS}}{\partial \beta_{0}} = -2 \sum_{i=1}^n(y_i- \beta_{0}- \beta_{x} x_i) = -2 \mathopen{}\left(n {\bar{y}}- n \beta_{0}- \beta_{x} n {\bar{x}}\right)\mathclose{}.\]
ProofProof
Proof. The derivative in sum form is the solution to Exercise 7. The form in terms of means is the solution to Exercise 8.
ExrExercise 9 (Derivative of RSS with respect to the slope)
LemLemma 5 (Derivative of RSS with respect to the slope)
Lemma 5 (Derivative of RSS with respect to the slope) The partial derivative of the simple linear regression residual sum of squares \(\text{RSS}(\beta_{0}, \beta_{x})\) (Example 3) with respect to the slope is
\[\frac{\partial \text{RSS}}{\partial \beta_{x}} = -2 \sum_{i=1}^nx_i(y_i- \beta_{0}- \beta_{x} x_i).\]
ProofProof
Proof. This is the solution to Exercise 9.
ExrExercise 10 (Solving the normal equations)
Exercise 10 (Solving the normal equations) Using Exercise 7 and Exercise 9, solve the normal equations of Example 6 for \(\beta_{0}\) and \(\beta_{x}\), assuming \(S_{xx}> 0\) (Definition 14).
LemLemma 6 (Solution of the normal equations)
Lemma 6 (Solution of the normal equations) If \(S_{xx}> 0\) (Definition 14), the normal equations of Example 6 have exactly one solution:
\[\beta_{x} = \frac{S_{xy}}{S_{xx}}, \qquad \beta_{0}= {\bar{y}}- \beta_{x} {\bar{x}}.\]
ProofProof
Proof. This is the solution to Exercise 10.
ExrExercise 11 (Second derivatives of RSS)
Exercise 11 (Second derivatives of RSS) Find the matrix of second derivatives of \(\text{RSS}(\beta_{0}, \beta_{x})\) (Example 3) with respect to \(\beta_{0}\) and \(\beta_{x}\).
ExrExercise 12 (Positive definiteness of the second-derivative matrix of RSS)
Exercise 12 (Positive definiteness of the second-derivative matrix of RSS) In the setting of Exercise 11, show that the matrix of second derivatives is positive definite when \(S_{xx}> 0\) (Definition 14).
LemLemma 7 (Second derivatives of RSS)
Lemma 7 (Second derivatives of RSS) The matrix of second derivatives of \(\text{RSS}(\beta_{0}, \beta_{x})\) (Example 3) with respect to \(\beta_{0}\) and \(\beta_{x}\) is positive definite at every \((\beta_{0}, \beta_{x})\) when \(S_{xx}> 0\) (Definition 14), and equals
\[\begin{pmatrix} 2n & 2 n {\bar{x}}\\ 2 n {\bar{x}}& 2 \sum_{i=1}^nx_i^2 \end{pmatrix}.\]
ProofProof
Proof. The matrix of second derivatives is the solution to Exercise 11. The positive definiteness is the solution to Exercise 12.
LemTheorem 5 (Closed-form OLS estimates)
Theorem 5 (Closed-form OLS estimates) Suppose \(S_{xx}> 0\) (Definition 14), that is, not all \(x_i\) are equal. Then the OLS estimates (Example 5) are unique, and
\[\hat{\beta}_{x} = \frac{S_{xy}}{S_{xx}}, \qquad \hat{\beta}_{0}= {\bar{y}}- \hat{\beta}_{x} {\bar{x}}.\]
ProofProof
Proof. \(\text{RSS}\) is differentiable, so any point that minimizes it solves the normal equations. By Lemma 6, the normal equations have exactly one solution, \(\beta_{x} = S_{xy}/ S_{xx}\) and \(\beta_{0}= {\bar{y}}- \beta_{x} {\bar{x}}\). By Lemma 7, the matrix of second derivatives of \(\text{RSS}\) is positive definite at every point, so \(\text{RSS}\) is strictly convex and its only stationary point is its unique global minimum. So the OLS estimates exist, are unique, and equal that solution.
The same estimates follow from a derivation in vector notation, which treats \((\beta_{0}, \beta_{x})\) as a single vector instead of differentiating with respect to each component separately.
DefDefinition 16 (Covariate vector)
Definition 16 (Covariate vector) In simple linear regression (Definition 8), the covariate vector \(\mathord{\smash[b]{\underset{\raise.3ex\hbox{$\scriptstyle\sim$}}{x}}\vphantom{x}}_i\) of observation \(i\) is its covariate value \(x_i\), preceded by a 1 for the intercept:
\[ \mathord{\smash[b]{\underset{\raise.3ex\hbox{$\scriptstyle\sim$}}{x}}\vphantom{x}}_i\stackrel{\text{def}}{=}\begin{pmatrix} 1 \\ x_i\end{pmatrix}. \]
ExrExercise 13 (The conditional mean and the covariate vector)
Exercise 13 (The conditional mean and the covariate vector) In simple linear regression (Definition 8), express the conditional mean \(\mu(x_i)\) as a dot product of the covariate vector \(\mathord{\smash[b]{\underset{\raise.3ex\hbox{$\scriptstyle\sim$}}{x}}\vphantom{x}}_i\) (Definition 16) and the coefficient vector \(\mathord{\smash[b]{\underset{\raise.3ex\hbox{$\scriptstyle\sim$}}{\beta}}\vphantom{\beta}}= {\mathopen{}\left(\beta_{0}, \beta_{x}\right)\mathclose{}}^{\top}\) (Example 6).
LemLemma 8 (The conditional mean is a dot product)
Lemma 8 (The conditional mean is a dot product) In simple linear regression (Definition 8), the conditional mean of observation \(i\) is the dot product of its covariate vector (Definition 16) and the coefficient vector \(\mathord{\smash[b]{\underset{\raise.3ex\hbox{$\scriptstyle\sim$}}{\beta}}\vphantom{\beta}}\) (Example 6):
\[\mu(x_i) = \mathord{\smash[b]{\underset{\raise.3ex\hbox{$\scriptstyle\sim$}}{x}}\vphantom{x}}_i \cdot \mathord{\smash[b]{\underset{\raise.3ex\hbox{$\scriptstyle\sim$}}{\beta}}\vphantom{\beta}}.\]
ProofProof
Proof. This is the solution to Exercise 13.
ExmExample 7 (Residual sum of squares in vector notation)
Example 7 (Residual sum of squares in vector notation) In simple linear regression, take \(\mathord{\smash[b]{\underset{\raise.3ex\hbox{$\scriptstyle\sim$}}{\theta}}\vphantom{\theta}}= \mathord{\smash[b]{\underset{\raise.3ex\hbox{$\scriptstyle\sim$}}{\beta}}\vphantom{\beta}}\) and substitute \(\mu(x_i) = \mathord{\smash[b]{\underset{\raise.3ex\hbox{$\scriptstyle\sim$}}{x}}\vphantom{x}}_i \cdot \mathord{\smash[b]{\underset{\raise.3ex\hbox{$\scriptstyle\sim$}}{\beta}}\vphantom{\beta}}\) (Lemma 8) into each residual of the residual sum of squares (Definition 11). The residual sum of squares is then a function of the coefficient vector \(\mathord{\smash[b]{\underset{\raise.3ex\hbox{$\scriptstyle\sim$}}{\beta}}\vphantom{\beta}}\), the same function as \(\text{RSS}(\beta_{0}, \beta_{x})\) in Example 3:
\[ \text{RSS}(\mathord{\smash[b]{\underset{\raise.3ex\hbox{$\scriptstyle\sim$}}{\beta}}\vphantom{\beta}}) = \sum_{i=1}^n\mathopen{}\left(y_i- \mathord{\smash[b]{\underset{\raise.3ex\hbox{$\scriptstyle\sim$}}{x}}\vphantom{x}}_i \cdot \mathord{\smash[b]{\underset{\raise.3ex\hbox{$\scriptstyle\sim$}}{\beta}}\vphantom{\beta}}\right)\mathclose{}^2. \]
ExrExercise 14 (Gradient of RSS in vector notation)
Exercise 14 (Gradient of RSS in vector notation) Find the gradient of the residual sum of squares in vector notation (Example 7), \(\frac{\partial}{\partial \mathord{\smash[b]{\underset{\raise.3ex\hbox{$\scriptstyle\sim$}}{\beta}}\vphantom{\beta}}} \text{RSS}(\mathord{\smash[b]{\underset{\raise.3ex\hbox{$\scriptstyle\sim$}}{\beta}}\vphantom{\beta}})\), by differentiating with respect to the vector \(\mathord{\smash[b]{\underset{\raise.3ex\hbox{$\scriptstyle\sim$}}{\beta}}\vphantom{\beta}}\) directly, rather than one component at a time.
LemLemma 9 (Gradient of RSS in vector notation)
Lemma 9 (Gradient of RSS in vector notation) The gradient of the residual sum of squares in vector notation (Example 7) is
\[\frac{\partial}{\partial \mathord{\smash[b]{\underset{\raise.3ex\hbox{$\scriptstyle\sim$}}{\beta}}\vphantom{\beta}}} \text{RSS}(\mathord{\smash[b]{\underset{\raise.3ex\hbox{$\scriptstyle\sim$}}{\beta}}\vphantom{\beta}}) = -2 \sum_{i=1}^n\mathord{\smash[b]{\underset{\raise.3ex\hbox{$\scriptstyle\sim$}}{x}}\vphantom{x}}_i\mathopen{}\left(y_i- \mathord{\smash[b]{\underset{\raise.3ex\hbox{$\scriptstyle\sim$}}{x}}\vphantom{x}}_i \cdot \mathord{\smash[b]{\underset{\raise.3ex\hbox{$\scriptstyle\sim$}}{\beta}}\vphantom{\beta}}\right)\mathclose{}.\]
ProofProof
Proof. This is the solution to Exercise 14.
ExrExercise 15 (Normal equations in vector notation)
Exercise 15 (Normal equations in vector notation) Define the matrix and vector
\[ A \stackrel{\text{def}}{=}\sum_{i=1}^n\mathord{\smash[b]{\underset{\raise.3ex\hbox{$\scriptstyle\sim$}}{x}}\vphantom{x}}_i {\mathord{\smash[b]{\underset{\raise.3ex\hbox{$\scriptstyle\sim$}}{x}}\vphantom{x}}_i}^{\top}, \qquad \mathord{\smash[b]{\underset{\raise.3ex\hbox{$\scriptstyle\sim$}}{c}}\vphantom{c}} \stackrel{\text{def}}{=}\sum_{i=1}^n\mathord{\smash[b]{\underset{\raise.3ex\hbox{$\scriptstyle\sim$}}{x}}\vphantom{x}}_iy_i. \]
Using Exercise 14, show that the normal equations can be written as \(A \mathord{\smash[b]{\underset{\raise.3ex\hbox{$\scriptstyle\sim$}}{\beta}}\vphantom{\beta}}= \mathord{\smash[b]{\underset{\raise.3ex\hbox{$\scriptstyle\sim$}}{c}}\vphantom{c}}\).
LemLemma 10 (Normal equations in vector notation)
Lemma 10 (Normal equations in vector notation) Let
\[ A \stackrel{\text{def}}{=}\sum_{i=1}^n\mathord{\smash[b]{\underset{\raise.3ex\hbox{$\scriptstyle\sim$}}{x}}\vphantom{x}}_i {\mathord{\smash[b]{\underset{\raise.3ex\hbox{$\scriptstyle\sim$}}{x}}\vphantom{x}}_i}^{\top}, \qquad \mathord{\smash[b]{\underset{\raise.3ex\hbox{$\scriptstyle\sim$}}{c}}\vphantom{c}} \stackrel{\text{def}}{=}\sum_{i=1}^n\mathord{\smash[b]{\underset{\raise.3ex\hbox{$\scriptstyle\sim$}}{x}}\vphantom{x}}_iy_i. \]
The normal equations of a simple linear regression are equivalent to
\[A \mathord{\smash[b]{\underset{\raise.3ex\hbox{$\scriptstyle\sim$}}{\beta}}\vphantom{\beta}}= \mathord{\smash[b]{\underset{\raise.3ex\hbox{$\scriptstyle\sim$}}{c}}\vphantom{c}}.\]
ProofProof
Proof. This is the solution to Exercise 15.
ExrExercise 16 (Solving the normal equations in vector notation)
Exercise 16 (Solving the normal equations in vector notation) Assuming \(S_{xx}> 0\) (Definition 14), show that \(A\) from Exercise 15 is invertible, solve \(A \mathord{\smash[b]{\underset{\raise.3ex\hbox{$\scriptstyle\sim$}}{\beta}}\vphantom{\beta}}= \mathord{\smash[b]{\underset{\raise.3ex\hbox{$\scriptstyle\sim$}}{c}}\vphantom{c}}\) for \(\mathord{\smash[b]{\underset{\raise.3ex\hbox{$\scriptstyle\sim$}}{\beta}}\vphantom{\beta}}\), and compare the result with Exercise 10.
LemLemma 11 (Solution of the normal equations in vector notation)
Lemma 11 (Solution of the normal equations in vector notation) If \(S_{xx}> 0\) (Definition 14), the matrix \(A = \sum_{i=1}^n\mathord{\smash[b]{\underset{\raise.3ex\hbox{$\scriptstyle\sim$}}{x}}\vphantom{x}}_i {\mathord{\smash[b]{\underset{\raise.3ex\hbox{$\scriptstyle\sim$}}{x}}\vphantom{x}}_i}^{\top}\) is invertible, and the normal equations \(A \mathord{\smash[b]{\underset{\raise.3ex\hbox{$\scriptstyle\sim$}}{\beta}}\vphantom{\beta}}= \mathord{\smash[b]{\underset{\raise.3ex\hbox{$\scriptstyle\sim$}}{c}}\vphantom{c}}\) with \(\mathord{\smash[b]{\underset{\raise.3ex\hbox{$\scriptstyle\sim$}}{c}}\vphantom{c}} = \sum_{i=1}^n\mathord{\smash[b]{\underset{\raise.3ex\hbox{$\scriptstyle\sim$}}{x}}\vphantom{x}}_iy_i\) (Lemma 10) have exactly one solution,
\[ \mathord{\smash[b]{\underset{\raise.3ex\hbox{$\scriptstyle\sim$}}{\beta}}\vphantom{\beta}}= A^{-1} \mathord{\smash[b]{\underset{\raise.3ex\hbox{$\scriptstyle\sim$}}{c}}\vphantom{c}} = \begin{pmatrix} {\bar{y}}- \beta_{x} {\bar{x}}\\ S_{xy}/ S_{xx}\end{pmatrix} \quad \text{with} \quad \beta_{x} = \frac{S_{xy}}{S_{xx}}, \]
the same solution as Lemma 6.
ProofProof
Proof. This is the solution to Exercise 16.
ExrExercise 17 (Hessian of RSS in vector notation)
Exercise 17 (Hessian of RSS in vector notation) Find the Hessian \(\frac{\partial}{\partial \mathord{\smash[b]{\underset{\raise.3ex\hbox{$\scriptstyle\sim$}}{\beta}}\vphantom{\beta}}} \frac{\partial}{\partial {\mathord{\smash[b]{\underset{\raise.3ex\hbox{$\scriptstyle\sim$}}{\beta}}\vphantom{\beta}}}^{\top}} \text{RSS}(\mathord{\smash[b]{\underset{\raise.3ex\hbox{$\scriptstyle\sim$}}{\beta}}\vphantom{\beta}})\).
ExrExercise 18 (Positive definiteness of the Hessian of RSS)
Exercise 18 (Positive definiteness of the Hessian of RSS) In the setting of Exercise 17, show that the Hessian is positive definite when \(S_{xx}> 0\) (Definition 14).
LemLemma 12 (Hessian of RSS in vector notation)
Lemma 12 (Hessian of RSS in vector notation) The Hessian of the residual sum of squares is
\[ \frac{\partial}{\partial \mathord{\smash[b]{\underset{\raise.3ex\hbox{$\scriptstyle\sim$}}{\beta}}\vphantom{\beta}}} \frac{\partial}{\partial {\mathord{\smash[b]{\underset{\raise.3ex\hbox{$\scriptstyle\sim$}}{\beta}}\vphantom{\beta}}}^{\top}} \text{RSS}(\mathord{\smash[b]{\underset{\raise.3ex\hbox{$\scriptstyle\sim$}}{\beta}}\vphantom{\beta}}) = 2 \sum_{i=1}^n\mathord{\smash[b]{\underset{\raise.3ex\hbox{$\scriptstyle\sim$}}{x}}\vphantom{x}}_i {\mathord{\smash[b]{\underset{\raise.3ex\hbox{$\scriptstyle\sim$}}{x}}\vphantom{x}}_i}^{\top}, \]
and it is positive definite at every \(\mathord{\smash[b]{\underset{\raise.3ex\hbox{$\scriptstyle\sim$}}{\beta}}\vphantom{\beta}}\) when \(S_{xx}> 0\) (Definition 14).
ProofProof
Proof. The Hessian is the solution to Exercise 17. The positive definiteness is the solution to Exercise 18.
LemTheorem 6 (OLS estimates in vector notation)
Theorem 6 (OLS estimates in vector notation) Suppose \(S_{xx}> 0\) (Definition 14). Then the matrix \(A = \sum_{i=1}^n\mathord{\smash[b]{\underset{\raise.3ex\hbox{$\scriptstyle\sim$}}{x}}\vphantom{x}}_i {\mathord{\smash[b]{\underset{\raise.3ex\hbox{$\scriptstyle\sim$}}{x}}\vphantom{x}}_i}^{\top}\) is invertible, and the vector of OLS estimates (Definition 12) is
\[ \hat{\mathord{\smash[b]{\underset{\raise.3ex\hbox{$\scriptstyle\sim$}}{\beta}}\vphantom{\beta}}}= A^{-1} \mathord{\smash[b]{\underset{\raise.3ex\hbox{$\scriptstyle\sim$}}{c}}\vphantom{c}}, \qquad \mathord{\smash[b]{\underset{\raise.3ex\hbox{$\scriptstyle\sim$}}{c}}\vphantom{c}} = \sum_{i=1}^n\mathord{\smash[b]{\underset{\raise.3ex\hbox{$\scriptstyle\sim$}}{x}}\vphantom{x}}_iy_i. \]
Its entries are the estimates of Theorem 5.
ProofProof
Proof. \(\text{RSS}\) is differentiable, so any point that minimizes it solves the normal equations. By Lemma 10, the normal equations are \(A \mathord{\smash[b]{\underset{\raise.3ex\hbox{$\scriptstyle\sim$}}{\beta}}\vphantom{\beta}}= \mathord{\smash[b]{\underset{\raise.3ex\hbox{$\scriptstyle\sim$}}{c}}\vphantom{c}}\). By Lemma 11, \(A\) is invertible, so their only solution is \(A^{-1} \mathord{\smash[b]{\underset{\raise.3ex\hbox{$\scriptstyle\sim$}}{c}}\vphantom{c}}\), whose entries are those of Theorem 5. By Lemma 12, the Hessian of \(\text{RSS}\) is positive definite at every \(\mathord{\smash[b]{\underset{\raise.3ex\hbox{$\scriptstyle\sim$}}{\beta}}\vphantom{\beta}}\), so \(\text{RSS}\) is strictly convex and \(A^{-1} \mathord{\smash[b]{\underset{\raise.3ex\hbox{$\scriptstyle\sim$}}{c}}\vphantom{c}}\) is its unique global minimum.
ExrExercise 19 (OLS slope and the correlation)
Exercise 19 (OLS slope and the correlation) Assuming \(S_{xx}> 0\) and \(S_{yy}> 0\) (Definition 14), write the OLS slope \(\hat{\beta}_{x}\) from Theorem 5 in terms of the Pearson correlation coefficient \(r\) and the sample standard deviations \(s_x\) and \(s_y\) of the \(x_i\) and the \(y_i\).
CorCorollary 2 (OLS slope in terms of the correlation)
Corollary 2 (OLS slope in terms of the correlation) If \(S_{xx}> 0\) and \(S_{yy}> 0\) (Definition 14), then
\[\hat{\beta}_{x} = r \, \frac{s_y}{s_x},\]
where \(r\) is the Pearson correlation coefficient and \(s_x\) and \(s_y\) are the sample standard deviations of the \(x_i\) and the \(y_i\).
ProofProof
Proof. This is the solution to Exercise 19.
TipVideo lecture
Hutchinson’s Linear Regression (pt1) (17 min) covers fitting a linear regression by least squares, framed as machine learning [11]. The login for the video site is posted on Canvas.
ReadingRead
- Hogg et al. [3, Sec. 6.5], pp. 277–284 covers a simple regression problem.
- Casella and Berger [12, Sec. 11.3], pp. 539–562 covers simple linear regression.
- Rice [4, Sec. 14.2.1], pp. 547–549 covers slope and intercept properties.
3.3 Fitting a simple linear regression in R
ExmExample 8 (Regression of fasting glucose on BMI in HERS)
Example 8 (Regression of fasting glucose on BMI in HERS) The OLS estimates from Theorem 5, and the slope from Corollary 2, for the participants with a BMI measurement:
hers_bmi <- hers |> dplyr::filter(!is.na(BMI))
x <- hers_bmi$BMI
y <- hers_bmi$glucose
b1 <- sum((x - mean(x)) * (y - mean(y))) / sum((x - mean(x))^2)
c(
  intercept = mean(y) - b1 * mean(x),
  slope = b1,
  slope_from_r = cor(x, y) * sd(y) / sd(x)
)
#>    intercept        slope slope_from_r
#>     60.07405      1.82218      1.82218
lm() gives the same estimates:
slr_fit <- lm(glucose ~ BMI, data = hers)
parameters::parameters(slr_fit) |>
parameters::print_md(digits = 3)| Parameter | Coefficient | SE | 95% CI | t(2756) | p |
|---|---|---|---|---|---|
| (Intercept) | 60.074 | 3.565 | (53.084, 67.064) | 16.852 | < .001 |
| BMI | 1.822 | 0.122 | (1.582, 2.062) | 14.878 | < .001 |
performance::model_performance(slr_fit) |>
insight::print_md(digits = 3)| AIC | AICc | BIC | R2 | R2 (adj.) | RMSE | Sigma |
|---|---|---|---|---|---|---|
| 27517.9 | 27517.9 | 27535.7 | 0.074 | 0.074 | 35.471 | 35.484 |
Figure 5 shows the data with the fitted line.
Show code
ggplot2::ggplot(hers_bmi, ggplot2::aes(x = BMI, y = glucose)) +
  ggplot2::geom_point(alpha = 0.2) +
  ggplot2::geom_abline(
    intercept = coef(slr_fit)[[1]],
    slope = coef(slr_fit)[["BMI"]],
    color = "firebrick"
  ) +
  ggplot2::labs(x = "BMI (kg/m^2)", y = "Fasting glucose (mg/dL)")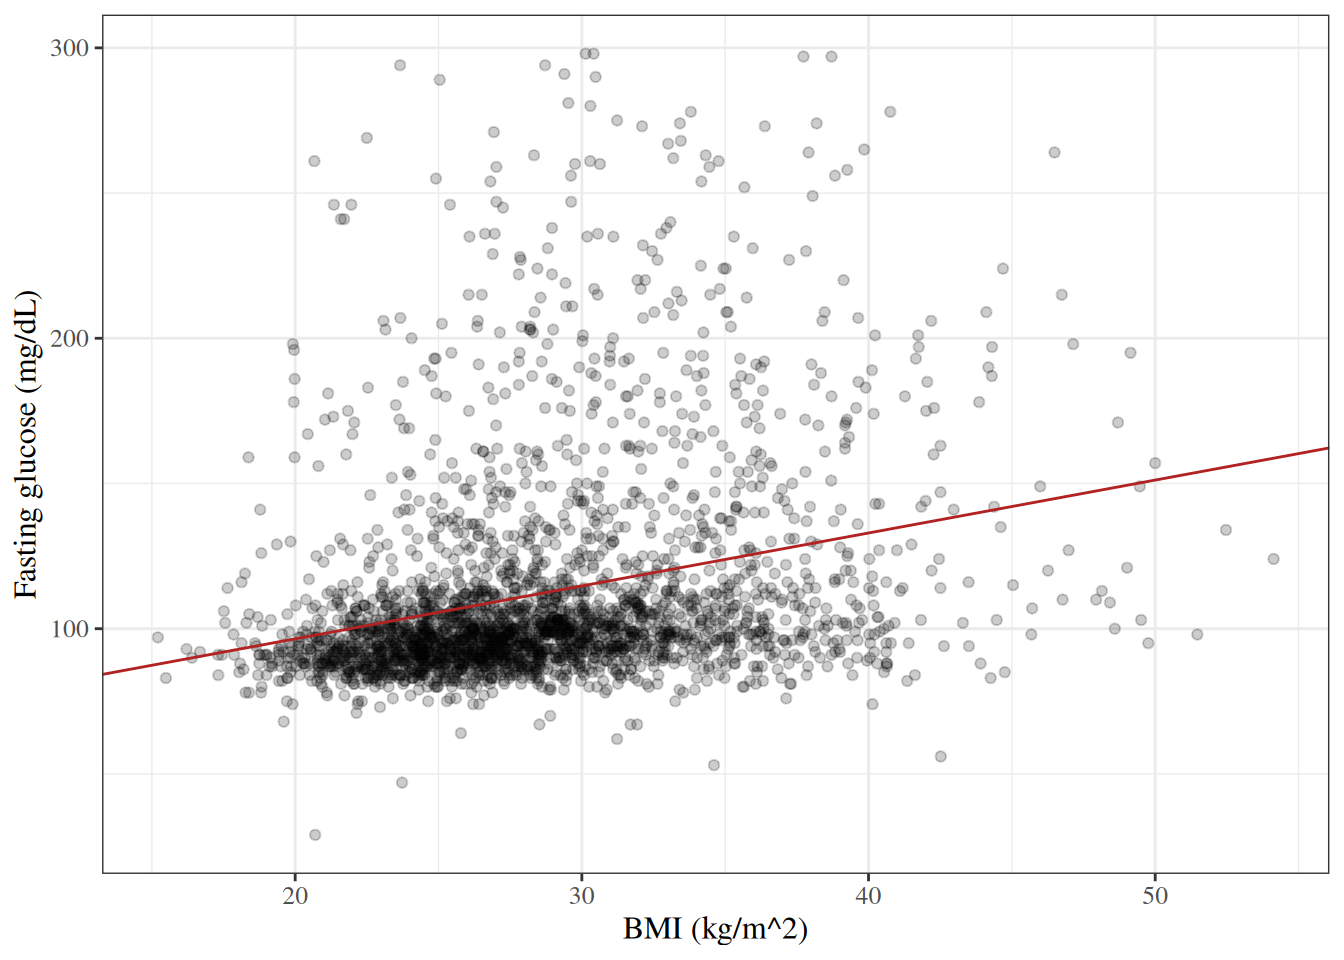
The estimated slope is \(\hat{\beta}_{\text{BMI}} = 1.82\) mg/dL per kg/m2: mean fasting glucose is about 1.8 mg/dL higher among participants whose BMI is 1 kg/m2 higher. The t statistic for the slope equals the correlation test statistic of Example 1.
3.4 The coefficient of determination
DefDefinition 17 (Total sum of squares)
Definition 17 (Total sum of squares) The total sum of squares of \(y_1, \ldots, y_n\) is
\[\text{TSS} \stackrel{\text{def}}{=}\sum_{i=1}^n(y_i- {\bar{y}})^2.\]
Source: Wikipedia contributors [13].
ExmExample 9 (Total sum of squares of three values)
Example 9 (Total sum of squares of three values) For \(y = 1, 2, 2\), \(\bar y = 5/3\), so
\[ \begin{aligned} \text{TSS} &= \mathopen{}\left(1 - \tfrac{5}{3}\right)\mathclose{}^2 + 2\mathopen{}\left(2 - \tfrac{5}{3}\right)\mathclose{}^2 && \text{(definition)}\\ &= \tfrac{4}{9} + \tfrac{2}{9} && \text{(square the deviations)}\\ &= \tfrac{2}{3} && \text{(arithmetic)} \end{aligned} \]
DefDefinition 18 (Coefficient of determination)
Definition 18 (Coefficient of determination) The coefficient of determination of a model fitted with parameter estimate \(\hat{\mathord{\smash[b]{\underset{\raise.3ex\hbox{$\scriptstyle\sim$}}{\theta}}\vphantom{\theta}}}\) is one minus the ratio of its residual sum of squares at \(\hat{\mathord{\smash[b]{\underset{\raise.3ex\hbox{$\scriptstyle\sim$}}{\theta}}\vphantom{\theta}}}\) to the total sum of squares of its outcomes:
\[R^2 \stackrel{\text{def}}{=}1 - \frac{\text{RSS}(\hat{\mathord{\smash[b]{\underset{\raise.3ex\hbox{$\scriptstyle\sim$}}{\theta}}\vphantom{\theta}}})}{\text{TSS}}.\]
Source: Wikipedia contributors [14].
RemarkRemark 6 (Interpreting the coefficient of determination)
Remark 6 (Interpreting the coefficient of determination). \(R^2\) is often described as the proportion of the variation in \(Y\) explained by the regression on \(X\).
ExrExercise 20 (Residual sum of squares of the OLS fit)
Exercise 20 (Residual sum of squares of the OLS fit) Assuming \(S_{xx}> 0\) (Definition 14), write the residual sum of squares at the OLS estimates (Theorem 5), \(\text{RSS}(\hat{\beta}_{0}, \hat{\beta}_{x}) = \sum_{i=1}^n\hat{\varepsilon}_i^2\), in terms of \(S_{xx}\), \(S_{yy}\) and \(S_{xy}\).
LemLemma 13 (Residual sum of squares of the OLS fit)
Lemma 13 (Residual sum of squares of the OLS fit) If \(S_{xx}> 0\) (Definition 14), the residual sum of squares at the OLS estimates (Theorem 5) is
\[\text{RSS}(\hat{\beta}_{0}, \hat{\beta}_{x}) = \sum_{i=1}^n\hat{\varepsilon}_i^2 = S_{yy}- \frac{S_{xy}^2}{S_{xx}}.\]
ProofProof
Proof. This is the solution to Exercise 20.
Exercise 21 (\(R^2\) and the correlation) Assuming \(S_{xx}> 0\) and \(S_{yy}> 0\) (Definition 14), use Exercise 20 to write the coefficient of determination \(R^2\) of the OLS fit in terms of the Pearson correlation coefficient \(r\), and show that \(0 \le R^2 \le 1\).
Theorem 7 (\(R^2\) of a simple linear regression) For the OLS fit of a simple linear regression, with \(S_{xx}> 0\) and \(S_{yy}> 0\) (Definition 14), \(R^2\) is the square of the Pearson correlation coefficient \(r\) of the \(x_i\) and \(y_i\), and so lies between 0 and 1:
\[ \begin{aligned} R^2 &= r^2, & 0 \le R^2 &\le 1. \end{aligned} \]
ProofProof
Proof. This is the solution to Exercise 21, which uses the residual sum of squares from Lemma 13.
Example 10 (\(R^2\) for the regression of glucose on BMI in HERS) For the fit in Example 8, \(R^2\) computed from Definition 18, the square of the Pearson correlation, and lm()’s value agree:
BMI accounts for only about 7% of the variation in baseline fasting glucose.
ReadingRead
- Hogg et al. [3, Sec. 7.6], pp. 344–352 covers more regression.
- Rice [4, Sec. 14.2.2], pp. 550–559 covers assessing the fit of a regression line.
3.5 Comparing nested regression models
DefDefinition 19 (Nested linear regression models)
Definition 19 (Nested linear regression models) Let a linear regression model have \(p\) features and an intercept. A second linear regression model is nested in it if it uses the same outcome and the same observations and is the special case in which \(q\) of the \(p\) coefficients equal \(0\). The first model is the larger model, and the second is the smaller model; the smaller model has \(p - q\) features.
Source: Vittinghoff et al. [1, Sec. 4.3].
ExmExample 11 (Nested models for fasting glucose in HERS)
Example 11 (Nested models for fasting glucose in HERS) In the HERS data, take the linear regression of glucose on BMI as the smaller model. The larger model adds age and exercise, so \(q = 2\):
\[ \begin{aligned} \text{smaller:}\quad \mu(\text{glucose}) &= \beta_{0}+ \beta_{\text{BMI}} \cdot \text{BMI}, \\ \text{larger:}\quad \mu(\text{glucose}) &= \beta_{0}+ \beta_{\text{BMI}} \cdot \text{BMI} + \beta_{\text{age}} \cdot \text{age} + \beta_{\text{exercise}} \cdot \text{exercise}. \end{aligned} \]
Both models must be fitted to the same HERS participants, so keep the participants with all four variables measured:
The smaller model sets \(\beta_{\text{age}} = \beta_{\text{exercise}} = 0\) in the larger one.
DefDefinition 20 (Partial F-test)
Definition 20 (Partial F-test) Let a smaller linear regression model be nested in a larger model with \(p\) features, so that they differ by \(q\) coefficients, and let both be fitted by ordinary least squares to \(n\) observations. Write \(\text{RSS}_0\) and \(\text{RSS}_1\) for the residual sums of squares of the smaller and the larger fit. The partial F-test of
\[ \begin{aligned} H_0: \text{the } q \text{ coefficients are all } 0 \end{aligned} \]
uses the statistic
\[ F \stackrel{\text{def}}{=}\frac{(\text{RSS}_0 - \text{RSS}_1) / q}{\text{RSS}_1 / (n - p - 1)}. \]
Its p-value is \(\Pr(F^* \ge F)\), where \(F^*\) has the \(F_{q,\, n-p-1}\) distribution (F-distribution).
Source: Vittinghoff et al. [1, Sec. 4.3] and Dobson and Barnett [15, Sec. 6.3].
LemTheorem 8 (Null distribution of the partial F statistic)
Theorem 8 (Null distribution of the partial F statistic) Let the errors of the larger model be independent and Gaussian with mean \(0\) and the same variance. If \(H_0\) of Definition 20 holds, then \(F\) has the \(F_{q,\, n-p-1}\) distribution for every number of observations \(n > p + 1\).
Source: Vittinghoff et al. [1, Sec. 4.3].
ProofProof
Proof. Under \(H_0\), \((\text{RSS}_0 - \text{RSS}_1) / \sigma^2\) has the \(\chi^2_q\) distribution and \(\text{RSS}_1 / \sigma^2\) has the \(\chi^2_{n-p-1}\) distribution, where \(\sigma^2\) is the error variance. The two are independent, because \(\text{RSS}_1\) is the squared length of the part of the outcome vector orthogonal to the larger model’s fitted values, while \(\text{RSS}_0 - \text{RSS}_1\) is the squared length of the part in the larger model but orthogonal to the smaller one. Dividing each by its degrees of freedom, \(\sigma^2\) cancels from the quotient, which is therefore \(F_{q,\, n-p-1}\) by the definition of the F-distribution.
ExmExample 12 (Partial F-test of age and exercise in HERS)
Example 12 (Partial F-test of age and exercise in HERS) For the models of Example 11, anova() gives the partial F-test:
anova(fit_smaller, fit_larger) |>
  parameters::parameters() |>
parameters::print_md(digits = 3, footer = "")| Parameter | RSS | Sum_Squares | df | df (error) | Mean_Square | F | p |
|---|---|---|---|---|---|---|---|
| Model 1: glucose ~ BMI | 3.470e+06 | 2756 | |||||
| Model 2: glucose ~ BMI + age + exercise | 3.461e+06 | 9188.413 | 2 | 2754 | 4594.207 | 3.656 | 0.026 |
The definition gives the same statistic:
rss0 <- sum(residuals(fit_smaller)^2)
rss1 <- sum(residuals(fit_larger)^2)
n <- nobs(fit_larger)
p <- length(coef(fit_larger)) - 1
q <- p - (length(coef(fit_smaller)) - 1)
f_stat <- ((rss0 - rss1) / q) / (rss1 / (n - p - 1))
c(
  f = f_stat,
  p_value = pf(f_stat, q, n - p - 1, lower.tail = FALSE)
)
#>         f   p_value
#> 3.6558211 0.0259658
With \(q = 2\) and \(n - p - 1 = 2754\), \(F = 3.66\), so the data reject \(H_0\) at the 5% level.
RemarkRemark 7 (The partial F-test and the likelihood ratio test)
Remark 7 (The partial F-test and the likelihood ratio test). Let the errors be Gaussian. The maximum likelihood estimate of the error variance of a model with residual sum of squares \(\text{RSS}\) is \(\text{RSS} / n\), so its maximized log-likelihood is \(-\tfrac{n}{2} \log(2\pi\, \text{RSS} / n) - \tfrac{n}{2}\). The likelihood ratio statistic of the null hypothesis \(H_0\) in the partial F-test is then
\[ \begin{aligned} \Lambda &= 2\mathopen{}\left(\ell(\hat\theta_{\text{ML}}) - \ell(\hat{\theta}_0)\right)\mathclose{} \\ &= n \log \frac{\text{RSS}_0}{\text{RSS}_1} \\ &= n \log\mathopen{}\left(1 + \frac{\text{RSS}_0 - \text{RSS}_1}{\text{RSS}_1}\right)\mathclose{}. \end{aligned} \]
For large \(n\) under \(H_0\), the quantity \((\text{RSS}_0 - \text{RSS}_1) / \text{RSS}_1\) is near \(0\), so \(\log(1 + u) \approx u\) gives \(\Lambda\approx n (\text{RSS}_0 - \text{RSS}_1) / \text{RSS}_1\). Also \(q F = (n - p - 1) (\text{RSS}_0 - \text{RSS}_1) / \text{RSS}_1\), which is close to the same value when \(n\) is much larger than \(p\). Under \(H_0\), \(\Lambda\) and \(q F\) therefore have approximately the \(\chi^2_q\) distribution, but the F-test is exact for Gaussian errors at every \(n\), while the likelihood ratio test holds only approximately.
3.6 Further reading
Linear Models Overview covers linear regression in depth, including inference for the coefficients and multiple predictors. Vittinghoff et al. [1] cover linear regression in Chapter 4.
Definitions on this page
- Definition 1 (Population correlation)
- Definition 2 (Test of zero correlation)
- Definition 3 (Spearman rank correlation)
- Definition 4 (Conditional Gaussian model)
- Definition 5 (Deviation from the conditional mean)
- Definition 6 (Homoskedastic model)
- Definition 7 (Linear regression model)
- Definition 8 (Simple linear regression model)
- Definition 9 (Intercept)
- Definition 10 (Slope)
- Definition 11 (Residual sum of squares)
- Definition 12 (Ordinary least squares)
- Definition 13 (Normal equations)
- Definition 14 (Centered sums of squares)
- Definition 15 (Centered sum of cross-products)
- Definition 16 (Covariate vector)
- Definition 17 (Total sum of squares)
- Definition 18 (Coefficient of determination)
- Definition 19 (Nested linear regression models)
- Definition 20 (Partial F-test)
References
[1]
E. Vittinghoff, D. V. Glidden, S. C. Shiboski, and C. E. McCulloch, Regression methods in biostatistics: Linear, logistic, survival, and repeated measures models, 2nd ed. Springer, 2012. doi: 10.1007/978-1-4614-1353-0.
[2]
Wikipedia contributors, “Pearson correlation coefficient — Wikipedia, the free encyclopedia.” 2026. Available: https://en.wikipedia.org/wiki/Pearson_correlation_coefficient
[3]
R. V. Hogg, E. A. Tanis, and D. L. Zimmerman, Probability and statistical inference, Tenth edition. Boston: Pearson, 2019.
[4]
J. A. Rice, Mathematical statistics and data analysis, 3rd ed. Belmont, CA: Cengage Learning, 2007.
[5]
Wikipedia contributors, “Spearman’s rank correlation coefficient — Wikipedia, the free encyclopedia.” 2026. Available: https://en.wikipedia.org/wiki/Spearman%27s_rank_correlation_coefficient
[6]
Wikipedia contributors, “Homoscedasticity and heteroscedasticity — Wikipedia, the free encyclopedia.” 2026. Available: https://en.wikipedia.org/wiki/Homoscedasticity_and_heteroscedasticity
[7]
Wikipedia contributors, “Linear regression — Wikipedia, the free encyclopedia.” 2026. Available: https://en.wikipedia.org/wiki/Linear_regression
[8]
Wikipedia contributors, “Simple linear regression — Wikipedia, the free encyclopedia.” 2026. Available: https://en.wikipedia.org/wiki/Simple_linear_regression
[9]
Wikipedia contributors, “Residual sum of squares — Wikipedia, the free encyclopedia.” 2026. Available: https://en.wikipedia.org/wiki/Residual_sum_of_squares
[10]
Wikipedia contributors, “Ordinary least squares — Wikipedia, the free encyclopedia.” 2026. Available: https://en.wikipedia.org/wiki/Ordinary_least_squares
[11]
B. Hutchinson, “DATA 471/571 (machine learning) and CSCI 481/581 (deep learning) video lectures.” Western Washington University. Accessed: Sep. 28, 2026. [Online]. Available: https://facultyweb.cs.wwu.edu/~hutchib2/video_lectures/data371/
[12]
G. Casella and R. Berger, Statistical inference, 2nd ed. Cengage Learning, 2002. Available: https://www.cengage.com/c/statistical-inference-2e-casella-berger/9780534243128/
[13]
Wikipedia contributors, “Total sum of squares — Wikipedia, the free encyclopedia.” 2026. Available: https://en.wikipedia.org/wiki/Total_sum_of_squares
[14]
Wikipedia contributors, “Coefficient of determination — Wikipedia, the free encyclopedia.” 2026. Available: https://en.wikipedia.org/wiki/Coefficient_of_determination
[15]
A. J. Dobson and A. G. Barnett, An introduction to generalized linear models, 4th ed. CRC press, 2018. doi: 10.1201/9781315182780.