chol_by_chd <- split(wcgs$chol, wcgs$chd69) |>
  lapply(function(x) x[!is.na(x)])
x1 <- chol_by_chd[["Yes"]]
x0 <- chol_by_chd[["No"]]
diff_means <- mean(x1) - mean(x0)
se_diff <- sqrt(var(x1) / length(x1) + var(x0) / length(x0))
z <- diff_means / se_diff
p_value <- 2 * pnorm(-abs(z))
c(difference = diff_means, se = se_diff, z = z, p_value = p_value)
#>  difference          se           z     p_value
#> 2.58087e+01 3.17988e+00 8.11626e+00 4.80780e-16Statistical Inference
Last modified: 2026-09-29 00:05:17 (PDT)
6 Interpretation of negative findings
If a confidence interval includes the null value, or a hypothesis test fails to reject the null hypothesis, that result does not necessarily mean that the null hypothesis is true. (When the interval and the test are built from the same statistic, with coverage \(1 - \alpha\) and significance level \(\alpha\), the two results coincide.) So we should not interpret such results as “the odds (or risks, hazards, or means) are not significantly different”. Instead, we should write something like “the data do not provide statistically significant evidence that the odds (or risks, hazards, or means) differ”. Statistical significance is a property of evidence, not of the estimands.
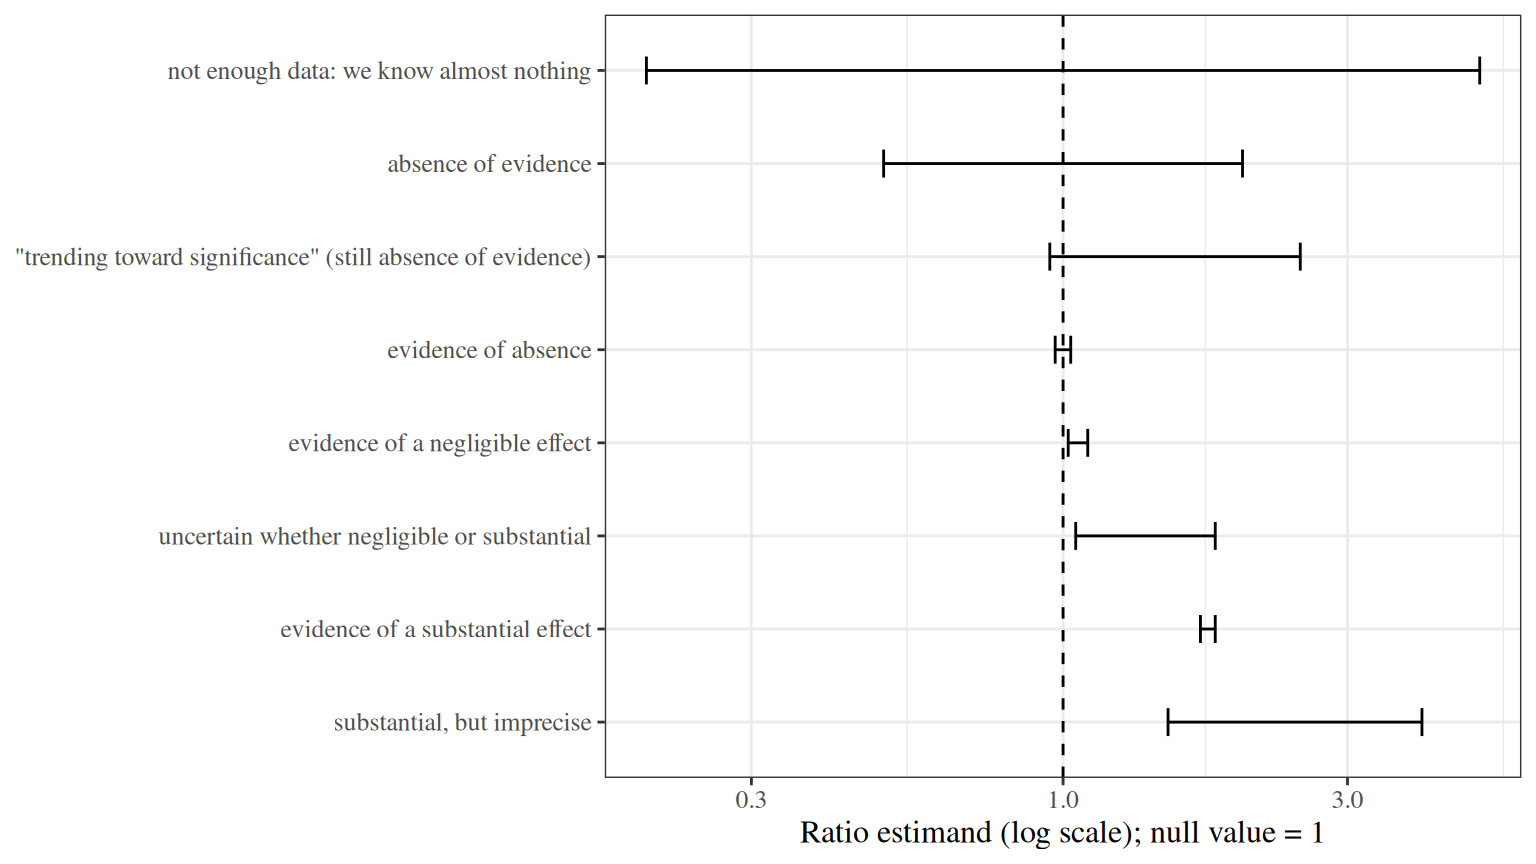
P-values do not distinguish between absence of evidence and evidence of absence. Confidence intervals do:
- a narrow confidence interval that includes the null value is evidence of absence (of any effect large enough to matter);
- a confidence interval that includes the null value but also includes substantially non-null values represents absence of evidence.
Conversely, even statistically significant evidence of a non-null value does not mean the value is large enough to matter; that depends on what the estimand is. For example, we might have statistically significant evidence that an exercise program prolongs human lifespans by 20 seconds, but an effect that small would be negligible in practical terms.
Figure 1 sketches these scenarios.
[R code]
ci_scenarios <- tibble::tribble(
  ~scenario, ~lower, ~upper,
  "not enough data: we know almost nothing", 0.2, 5,
  "absence of evidence", 0.5, 2,
  "\"trending toward significance\" (still absence of evidence)", 0.95, 2.5,
  "evidence of absence", 0.97, 1.03,
  "evidence of a negligible effect", 1.02, 1.1,
  "uncertain whether negligible or substantial", 1.05, 1.8,
  "evidence of a substantial effect", 1.7, 1.8,
  "substantial, but imprecise", 1.5, 4
) |>
  dplyr::mutate(scenario = factor(scenario, levels = rev(scenario)))

ci_scenarios |>
  ggplot2::ggplot() +
  ggplot2::aes(y = scenario, xmin = lower, xmax = upper) +
  ggplot2::geom_errorbarh(height = 0.3) +
  ggplot2::geom_vline(xintercept = 1, linetype = "dashed") +
  ggplot2::scale_x_log10() +
  ggplot2::labs(x = "Ratio estimand (log scale); null value = 1", y = NULL)