Code
library("qnp")
ggplot2::ggplot(mtcars, ggplot2::aes(wt, mpg, colour = factor(cyl))) +
ggplot2::geom_point() +
scale_colour_morrison()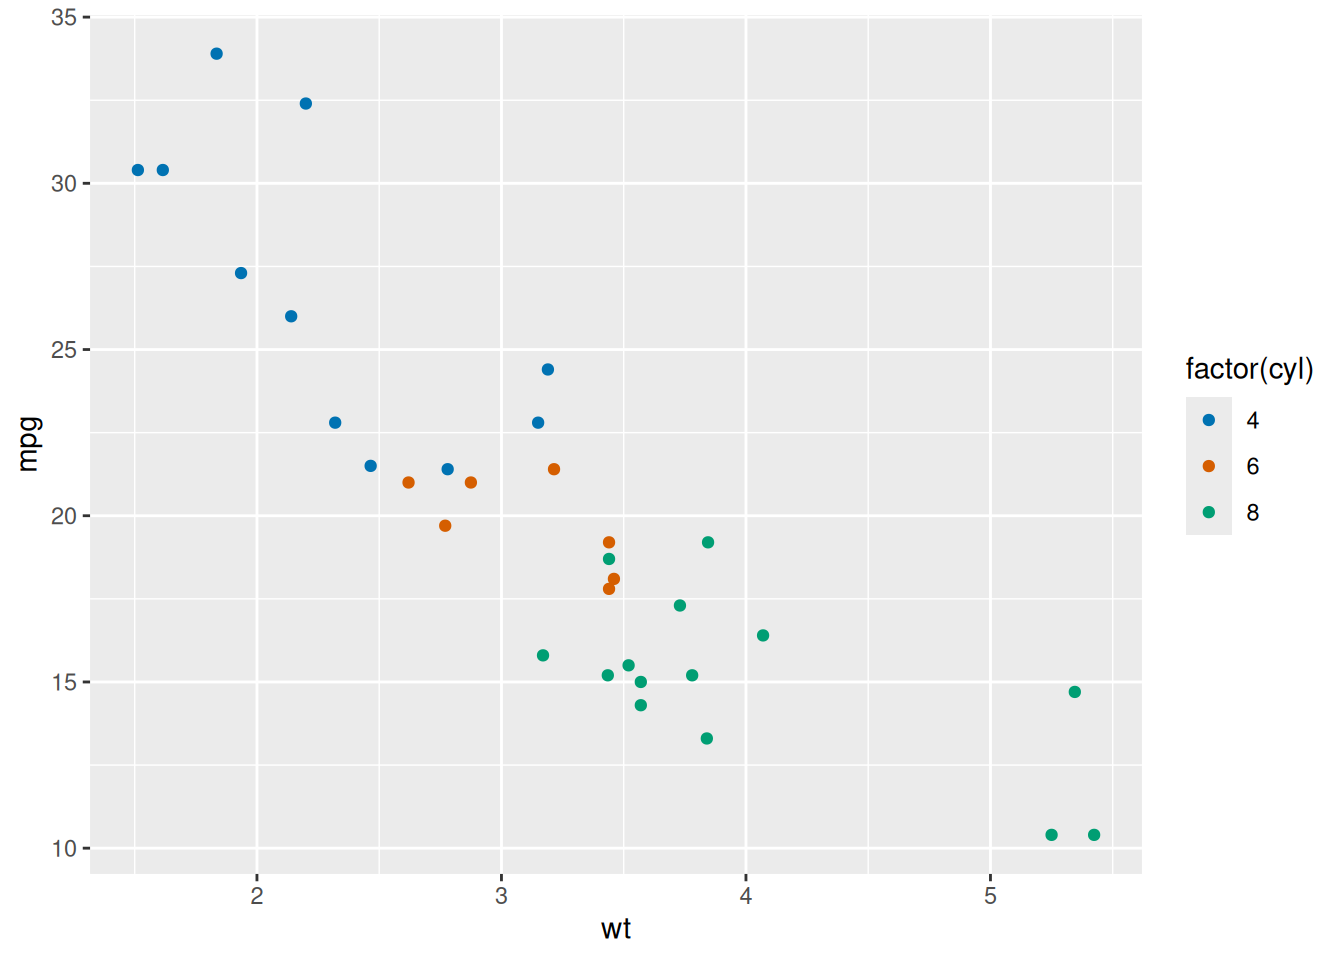
Discrete ggplot2 colour and fill scales that stay distinguishable under the common kinds of colour blindness. For up to 7 groups they use the Okabe-Ito palette (ggokabeito::palette_okabe_ito()) in the order blue, vermillion, bluish green, reddish purple, sky blue, orange, yellow. Blue and vermillion lead because lds uses them for two-group figures. The palette leaves out black and grey, which look like text and missing values.
scale_colour_morrison(...)

scale_color_morrison(...)

scale_fill_morrison(...)
…
|
Passed to ggplot2::discrete_scale(), such as name, limits or labels. The palette and the aesthetic are fixed.
|
For 8 to 11 groups the scales switch to the “Safe” palette of the rcartocolor package, without its grey, and warn, because no tested palette keeps every pair of that many colours easy to tell apart. All colours change at that point, including those of the first 7 groups. Also vary shape or line type for that many groups. More than 11 groups is an error. The reasons for these choices are in the decision record.
A discrete ggplot2::Scale object.
library("qnp")


ggplot2::ggplot(mtcars, ggplot2::aes(wt, mpg, colour = factor(cyl))) +
  ggplot2::geom_point() +
  scale_colour_morrison()