Code
library("qnp")


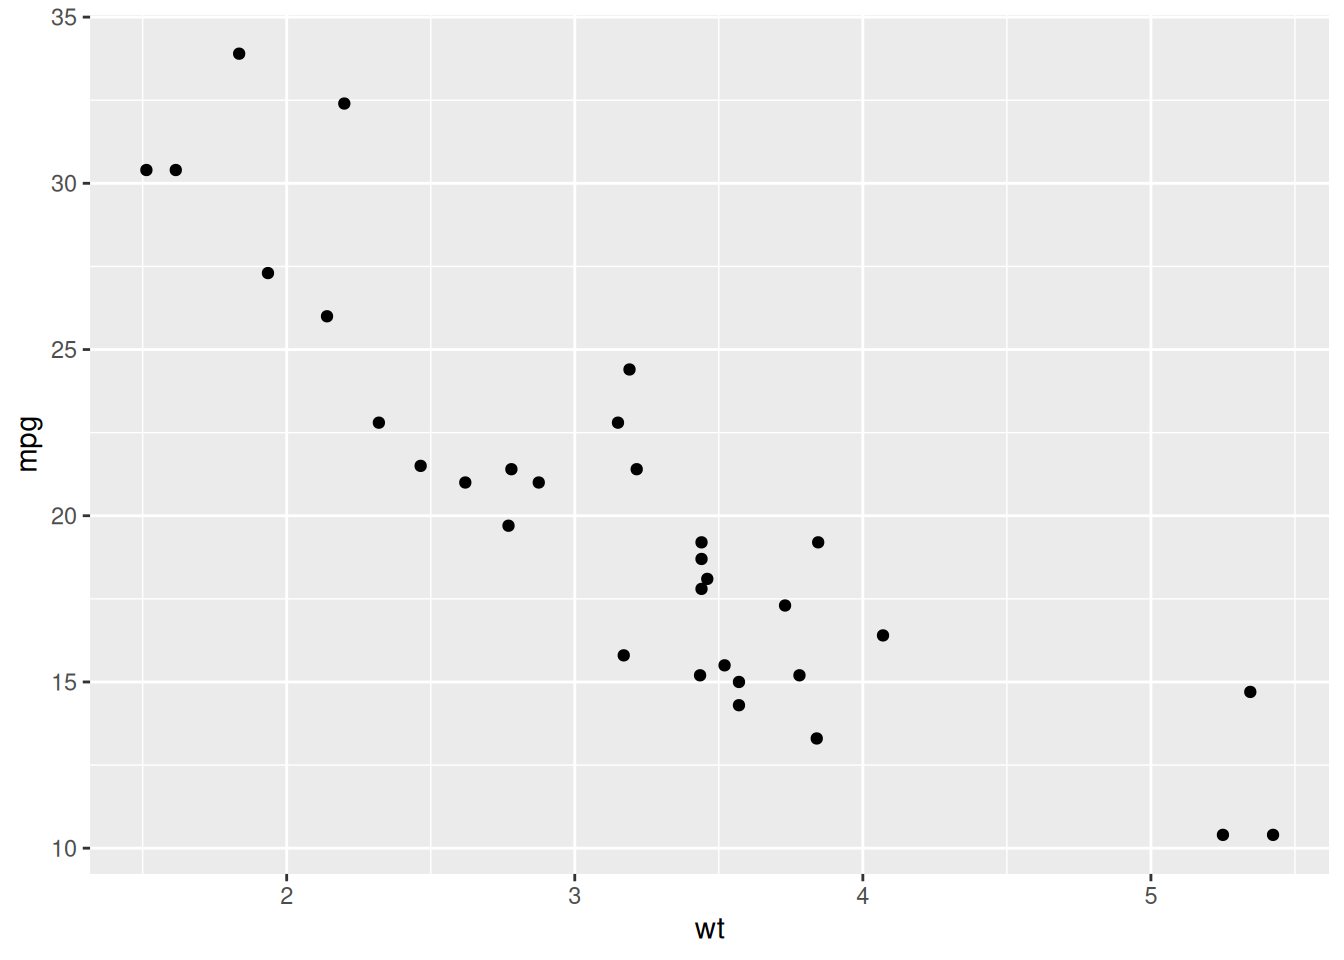
p <- ggplot2::ggplot(mtcars, ggplot2::aes(wt, mpg)) +
  ggplot2::geom_point()

# non-HTML output: the ggplot is returned unchanged
interactive_plot(
  plot = p,
  alt = "Scatterplot of fuel economy versus car weight",
  is_html = FALSE
)
Code
# HTML output: an interactive widget wrapped in an accessible `div`
interactive_plot(
  plot = p,
  alt = "Scatterplot of fuel economy versus car weight",
  is_html = TRUE
)