Bayesian Inference

Last modified: 2026-11-07 21:34:29 (PST)

This page introduces the Bayesian approach to statistical inference: it contrasts the frequentist and Bayesian paradigms, states Bayes’ theorem as a rule for updating beliefs about parameters, discusses how to choose a prior, and outlines hierarchical models [1, Ch. 12]. For a video introduction, see Richard McElreath’s lecture Introduction to Bayesian Workflow (Statistical Rethinking 2026, Lecture A01).

1 Frequentist and Bayesian paradigms

The estimation and inference pages take the frequentist view of parameters.

Definition 1 (Frequentist paradigm) In the frequentist paradigm of statistical inference, an unknown parameter \(\theta\) is a fixed constant, probability describes long-run frequencies over repetitions of the data-generating process, and uncertainty about \(\theta\) is quantified by the sampling distribution of an estimator \(\hat{\theta}\).

Source: Wikipedia contributors [2].

Definition 2 (Bayesian paradigm) In the Bayesian paradigm of statistical inference, an unknown parameter \(\theta\) is a random variable with its own probability distribution, and probability measures degree of belief [1, Ch. 12], p. 272.

Source: Wikipedia contributors [3].

Example 1 (Two views of a success probability) Suppose 55 of 91 independent trials succeed. A frequentist treats the success probability \(\pi\) as a fixed number, estimates it by \(\hat{\pi}= 55/91 \approx 0.60\), and describes uncertainty by how much \(\hat{\pi}\) would vary over repeated sets of 91 trials, for example with a confidence interval. A Bayesian gives \(\pi\) a probability distribution before seeing the trials, such as the uniform distribution on \((0, 1)\), and describes uncertainty by the distribution of \(\pi\) given the 55 successes.

Definition 3 (Prior distribution) The prior distribution of a parameter \(\theta\), with density or probability mass function \(\mathbb{p}(\theta)\), is the probability distribution that describes what is believed about \(\theta\) before the data are observed.

Source: Wikipedia contributors [4].

Example 2 (A uniform prior for a probability) Let \(\pi\) be the probability that a randomly chosen adult in some population smokes. Before collecting any data, an analyst who considers every value of \(\pi\) in \((0, 1)\) equally plausible could use the uniform prior

\[\mathbb{p}(\pi) = 1, \quad \pi\in (0, 1).\]

Under this prior, the prior probability that fewer than 10% of adults smoke is

\[ \begin{aligned} \Pr(\pi< 0.1) &= \int_0^{0.1} 1 \, d\pi\\ &= 0.1. \end{aligned} \]

Remark 1 (Two paradigms, two questions). The two paradigms answer different questions. A frequentist asks, “for which parameter values would these data be unsurprising?”; a Bayesian asks, “given these data, what should I now believe about the parameter?”. Neither question is wrong, and they call for different machinery.

2 Bayes’ theorem for parameters

Definition 4 (Posterior distribution) The posterior distribution of a parameter \(\theta\), given observed data \(\mathord{\smash[b]{\underset{\raise.3ex\hbox{$\scriptstyle\sim$}}{Y}}\vphantom{Y}}= \mathord{\smash[b]{\underset{\raise.3ex\hbox{$\scriptstyle\sim$}}{y}}\vphantom{y}}\), is the conditional distribution of \(\theta\) given \(\mathord{\smash[b]{\underset{\raise.3ex\hbox{$\scriptstyle\sim$}}{Y}}\vphantom{Y}}= \mathord{\smash[b]{\underset{\raise.3ex\hbox{$\scriptstyle\sim$}}{y}}\vphantom{y}}\). Its density or probability mass function is written \(\mathbb{p}(\theta\mid \mathord{\smash[b]{\underset{\raise.3ex\hbox{$\scriptstyle\sim$}}{y}}\vphantom{y}})\).

Source: Wikipedia contributors [5].

Example 3 (Posterior probability that a coin is biased) A coin is either fair (\(\theta= 0.5\)) or biased toward heads (\(\theta= 0.8\)), where \(\theta\) is its probability of heads, with prior probabilities \(\mathbb{p}(0.5) = 0.9\) and \(\mathbb{p}(0.8) = 0.1\). After three tosses that all land heads, the posterior distribution of \(\theta\) is its conditional distribution given those tosses. Its probabilities are computed in Example 4.

Definition 5 (Marginal likelihood (evidence)) Given a prior \(\mathbb{p}(\theta)\) and a model \(\mathbb{p}(\mathord{\smash[b]{\underset{\raise.3ex\hbox{$\scriptstyle\sim$}}{y}}\vphantom{y}}\mid \theta)\) for the data given \(\theta\), the marginal likelihood (also called the evidence) of observed data \(\mathord{\smash[b]{\underset{\raise.3ex\hbox{$\scriptstyle\sim$}}{y}}\vphantom{y}}\) is

\[ \mathbb{p}(\mathord{\smash[b]{\underset{\raise.3ex\hbox{$\scriptstyle\sim$}}{y}}\vphantom{y}}) \stackrel{\text{def}}{=}\int \mathbb{p}(\mathord{\smash[b]{\underset{\raise.3ex\hbox{$\scriptstyle\sim$}}{y}}\vphantom{y}}\mid \theta)\, \mathbb{p}(\theta)\, d\theta, \]

with the integral replaced by a sum over the possible values of \(\theta\) when \(\theta\) is discrete.

Source: Wikipedia contributors [6].

Theorem 1 (Bayes’ theorem for parameters) If \(\mathbb{p}(\mathord{\smash[b]{\underset{\raise.3ex\hbox{$\scriptstyle\sim$}}{y}}\vphantom{y}}) > 0\), then

\[ \mathbb{p}(\theta\mid \mathord{\smash[b]{\underset{\raise.3ex\hbox{$\scriptstyle\sim$}}{y}}\vphantom{y}}) = \frac{\mathbb{p}(\mathord{\smash[b]{\underset{\raise.3ex\hbox{$\scriptstyle\sim$}}{y}}\vphantom{y}}\mid \theta)\, \mathbb{p}(\theta)}{\mathbb{p}(\mathord{\smash[b]{\underset{\raise.3ex\hbox{$\scriptstyle\sim$}}{y}}\vphantom{y}})}. \tag{1}\]

Proof. By the definition of a conditional density, \(\mathbb{p}(\theta\mid \mathord{\smash[b]{\underset{\raise.3ex\hbox{$\scriptstyle\sim$}}{y}}\vphantom{y}}) = \mathbb{p}(\theta, \mathord{\smash[b]{\underset{\raise.3ex\hbox{$\scriptstyle\sim$}}{y}}\vphantom{y}}) / \mathbb{p}(\mathord{\smash[b]{\underset{\raise.3ex\hbox{$\scriptstyle\sim$}}{y}}\vphantom{y}})\) and \(\mathbb{p}(\theta, \mathord{\smash[b]{\underset{\raise.3ex\hbox{$\scriptstyle\sim$}}{y}}\vphantom{y}}) = \mathbb{p}(\mathord{\smash[b]{\underset{\raise.3ex\hbox{$\scriptstyle\sim$}}{y}}\vphantom{y}}\mid \theta)\, \mathbb{p}(\theta)\), where \(\mathbb{p}(\mathord{\smash[b]{\underset{\raise.3ex\hbox{$\scriptstyle\sim$}}{y}}\vphantom{y}})\) is the marginal density of \(\mathord{\smash[b]{\underset{\raise.3ex\hbox{$\scriptstyle\sim$}}{Y}}\vphantom{Y}}\) at \(\mathord{\smash[b]{\underset{\raise.3ex\hbox{$\scriptstyle\sim$}}{y}}\vphantom{y}}\). That marginal density is

\[ \begin{aligned} \mathbb{p}(\mathord{\smash[b]{\underset{\raise.3ex\hbox{$\scriptstyle\sim$}}{y}}\vphantom{y}}) &= \int \mathbb{p}(\theta, \mathord{\smash[b]{\underset{\raise.3ex\hbox{$\scriptstyle\sim$}}{y}}\vphantom{y}})\, d\theta && \text{(marginalizing over $\theta$)}\\ &= \int \mathbb{p}(\mathord{\smash[b]{\underset{\raise.3ex\hbox{$\scriptstyle\sim$}}{y}}\vphantom{y}}\mid \theta)\, \mathbb{p}(\theta)\, d\theta && \text{(substituting the factorization of $\mathbb{p}(\theta, \mathord{\smash[b]{\underset{\raise.3ex\hbox{$\scriptstyle\sim$}}{y}}\vphantom{y}})$)}, \end{aligned} \]

which is the marginal likelihood. Substituting the factorization into the numerator of \(\mathbb{p}(\theta, \mathord{\smash[b]{\underset{\raise.3ex\hbox{$\scriptstyle\sim$}}{y}}\vphantom{y}}) / \mathbb{p}(\mathord{\smash[b]{\underset{\raise.3ex\hbox{$\scriptstyle\sim$}}{y}}\vphantom{y}})\) gives Equation 1.

Example 4 (Posterior probability that a coin is biased, computed) Continuing Example 3, let \(\mathord{\smash[b]{\underset{\raise.3ex\hbox{$\scriptstyle\sim$}}{y}}\vphantom{y}}\) be the three heads, so \(\mathbb{p}(\mathord{\smash[b]{\underset{\raise.3ex\hbox{$\scriptstyle\sim$}}{y}}\vphantom{y}}\mid \theta) = \theta^3\). The marginal likelihood sums over the two possible values of \(\theta\):

\[ \begin{aligned} \mathbb{p}(\mathord{\smash[b]{\underset{\raise.3ex\hbox{$\scriptstyle\sim$}}{y}}\vphantom{y}}) &= \mathbb{p}(\mathord{\smash[b]{\underset{\raise.3ex\hbox{$\scriptstyle\sim$}}{y}}\vphantom{y}}\mid 0.5)\, \mathbb{p}(0.5) + \mathbb{p}(\mathord{\smash[b]{\underset{\raise.3ex\hbox{$\scriptstyle\sim$}}{y}}\vphantom{y}}\mid 0.8)\, \mathbb{p}(0.8)\\ &= 0.5^3 \cdot 0.9 + 0.8^3 \cdot 0.1\\ &= 0.1125 + 0.0512\\ &= 0.1637. \end{aligned} \]

By Theorem 1,

\[ \begin{aligned} \mathbb{p}(0.8 \mid \mathord{\smash[b]{\underset{\raise.3ex\hbox{$\scriptstyle\sim$}}{y}}\vphantom{y}}) &= \frac{\mathbb{p}(\mathord{\smash[b]{\underset{\raise.3ex\hbox{$\scriptstyle\sim$}}{y}}\vphantom{y}}\mid 0.8)\, \mathbb{p}(0.8)}{\mathbb{p}(\mathord{\smash[b]{\underset{\raise.3ex\hbox{$\scriptstyle\sim$}}{y}}\vphantom{y}})}\\ &= \frac{0.0512}{0.1637}\\ &\approx 0.313, \end{aligned} \]

and \(\mathbb{p}(0.5 \mid \mathord{\smash[b]{\underset{\raise.3ex\hbox{$\scriptstyle\sim$}}{y}}\vphantom{y}}) = 0.1125 / 0.1637 \approx 0.687\). Three heads in a row raise the probability that the coin is biased from \(0.1\) to about \(0.31\).

Example 5 (Posterior for a coin’s probability of heads under a uniform prior) As in Example 3, let \(\theta\) be a coin’s probability of heads, now allowed to take any value in \((0, 1)\), with the uniform prior density \(\mathbb{p}(\theta) = 1\) for \(\theta\in (0, 1)\). One toss lands heads; call that observation \(y = 1\), so

\[ \mathbb{p}(y = 1 \mid \theta) = \theta. \]

The marginal likelihood is an integral over \(\theta\):

\[ \begin{aligned} \mathbb{p}(y = 1) &= \int_0^1 \mathbb{p}(y = 1 \mid \theta)\, \mathbb{p}(\theta)\, d\theta && \text{(definition of the marginal likelihood)}\\ &= \int_0^1 \theta\cdot 1\, d\theta && \text{(substituting the likelihood and the prior)}\\ &= \int_0^1 \theta\, d\theta && \text{($\theta\cdot 1 = \theta$)}\\ &= \mathopen{}\left[\frac{\theta^2}{2}\right]\mathclose{}_0^1 && \text{(antiderivative of $\theta$)}\\ &= \frac{1^2}{2} - \frac{0^2}{2} && \text{(evaluating at the limits)}\\ &= \frac{1}{2} && \text{(arithmetic)}. \end{aligned} \tag{2}\]

By Theorem 1, for \(\theta\in (0, 1)\):

\[ \begin{aligned} \mathbb{p}(\theta\mid y = 1) &= \frac{\mathbb{p}(y = 1 \mid \theta)\, \mathbb{p}(\theta)}{\mathbb{p}(y = 1)} && \text{(Bayes' theorem for parameters)}\\ &= \frac{\theta\cdot 1}{1/2} && \text{(substituting the likelihood, prior, and marginal likelihood)}\\ &= \frac{\theta}{1/2} && \text{($\theta\cdot 1 = \theta$)}\\ &= 2\theta && \text{(dividing by $1/2$ is multiplying by 2)}. \end{aligned} \tag{3}\]

One head moves the posterior density toward large values of \(\theta\). The posterior mean is

\[ \begin{aligned} {\mathbb{E}\mathopen{}\left[\theta\mid y = 1\right]\mathclose{}} &= \int_0^1 \theta\cdot \mathbb{p}(\theta\mid y = 1)\, d\theta && \text{(expectation under the posterior density)}\\ &= \int_0^1 \theta\cdot 2\theta\, d\theta && \text{(substituting the posterior density)}\\ &= \int_0^1 2\theta^2\, d\theta && \text{($\theta\cdot \theta= \theta^2$)}\\ &= \mathopen{}\left[\frac{2\theta^3}{3}\right]\mathclose{}_0^1 && \text{(antiderivative of $2\theta^2$)}\\ &= \frac{2 \cdot 1^3}{3} - \frac{2 \cdot 0^3}{3} && \text{(evaluating at the limits)}\\ &= \frac{2}{3} && \text{(arithmetic)}, \end{aligned} \tag{4}\]

up from the prior mean of \(1/2\).

Corollary 1 (The posterior is proportional to likelihood times prior) As a function of \(\theta\), with the data \(\mathord{\smash[b]{\underset{\raise.3ex\hbox{$\scriptstyle\sim$}}{y}}\vphantom{y}}\) held fixed,

\[ \underbrace{\mathbb{p}(\theta\mid \mathord{\smash[b]{\underset{\raise.3ex\hbox{$\scriptstyle\sim$}}{y}}\vphantom{y}})}_{\text{posterior}} \;\propto\; \underbrace{\mathbb{p}(\mathord{\smash[b]{\underset{\raise.3ex\hbox{$\scriptstyle\sim$}}{y}}\vphantom{y}}\mid \theta)}_{\text{likelihood}} \cdot \underbrace{\mathbb{p}(\theta)}_{\text{prior}}. \tag{5}\]

Proof. In Equation 1, the denominator \(\mathbb{p}(\mathord{\smash[b]{\underset{\raise.3ex\hbox{$\scriptstyle\sim$}}{y}}\vphantom{y}})\) does not depend on \(\theta\).

Theorem 1 is Bayes’ theorem for events, restated for densities [7]. Here \(\mathbb{p}(\mathord{\smash[b]{\underset{\raise.3ex\hbox{$\scriptstyle\sim$}}{y}}\vphantom{y}}\mid \theta)\), viewed as a function of \(\theta\), is the likelihood \(\mathcal{L}(\theta)\). Corollary 1 is the workhorse of applied Bayesian analysis: it identifies the posterior from the shape of likelihood times prior, without computing the integral \(\mathbb{p}(\mathord{\smash[b]{\underset{\raise.3ex\hbox{$\scriptstyle\sim$}}{y}}\vphantom{y}})\), and it is what makes the simulation methods of Markov chain Monte Carlo possible [1, Ch. 12], p. 272.

2.1 A Gaussian mean with a Gaussian prior

Example 6 (Posterior for a Gaussian mean) Suppose that, given the mean \(\mu\), \(X_1, \ldots, X_n \ \sim_{\operatorname{iid}}\ {\operatorname{N}\mathopen{}\left(\mu, 1\right)\mathclose{}}\), so the variance is known, and that the prior for \(\mu\) is \({\operatorname{N}\mathopen{}\left(0, 1\right)\mathclose{}}\). Let \(\mathord{\smash[b]{\underset{\raise.3ex\hbox{$\scriptstyle\sim$}}{x}}\vphantom{x}}= (x_1, \ldots, x_n)\) be the observed data, with sample mean \(\bar x\).

The likelihood is

\[ \begin{aligned} \mathbb{p}(\mathord{\smash[b]{\underset{\raise.3ex\hbox{$\scriptstyle\sim$}}{x}}\vphantom{x}}\mid \mu) &= \prod_{i=1}^n(2\pi)^{-1/2} {\operatorname{exp}\mathopen{}\left\{-\frac{1}{2}(x_i- \mu)^2\right\}\mathclose{}} && \text{(independent Gaussian observations)}\\ &= (2\pi)^{-n/2} {\operatorname{exp}\mathopen{}\left\{-\frac{1}{2}\sum_{i=1}^n(x_i- \mu)^2\right\}\mathclose{}} && \text{(combining the exponents)}\\ &= (2\pi)^{-n/2} {\operatorname{exp}\mathopen{}\left\{-\frac{1}{2}\sum_{i=1}^n\mathopen{}\left(x_i^2 - 2 \mu x_i+ \mu^2\right)\mathclose{}\right\}\mathclose{}} && \text{(expanding each square)}\\ &= (2\pi)^{-n/2} {\operatorname{exp}\mathopen{}\left\{-\frac{1}{2}\mathopen{}\left(\sum_{i=1}^nx_i^2 - \sum_{i=1}^n2 \mu x_i+ \sum_{i=1}^n\mu^2\right)\mathclose{}\right\}\mathclose{}} && \text{(splitting the sum)}\\ &= (2\pi)^{-n/2} {\operatorname{exp}\mathopen{}\left\{-\frac{1}{2}\mathopen{}\left(\sum_{i=1}^nx_i^2 - 2 \mu\sum_{i=1}^nx_i+ \sum_{i=1}^n\mu^2\right)\mathclose{}\right\}\mathclose{}} && \text{(factoring the constant $2 \mu$ out of the middle sum)}\\ &= (2\pi)^{-n/2} {\operatorname{exp}\mathopen{}\left\{-\frac{1}{2}\mathopen{}\left(\sum_{i=1}^nx_i^2 - 2 \mu\sum_{i=1}^nx_i+ n \mu^2\right)\mathclose{}\right\}\mathclose{}} && \text{(summing the constant $\mu^2$ over $n$ terms)}\\ &= (2\pi)^{-n/2} {\operatorname{exp}\mathopen{}\left\{-\frac{1}{2}\mathopen{}\left(\sum_{i=1}^nx_i^2 - 2 \mu n \bar x + n \mu^2\right)\mathclose{}\right\}\mathclose{}} && \text{(substituting $\sum_{i=1}^nx_i= n \bar x$)}\\ &= (2\pi)^{-n/2} {\operatorname{exp}\mathopen{}\left\{-\frac{1}{2}\mathopen{}\left(\sum_{i=1}^nx_i^2 + \mathopen{}\left(n \mu^2 - 2 \mu n \bar x\right)\mathclose{}\right)\mathclose{}\right\}\mathclose{}} && \text{(reordering and grouping the terms that involve $\mu$)}\\ &= (2\pi)^{-n/2} {\operatorname{exp}\mathopen{}\left\{-\frac{1}{2}\sum_{i=1}^nx_i^2 - \frac{1}{2}\mathopen{}\left(n \mu^2 - 2 \mu n \bar x\right)\mathclose{}\right\}\mathclose{}} && \text{(distributing $-\tfrac{1}{2}$)}\\ &= (2\pi)^{-n/2} {\operatorname{exp}\mathopen{}\left\{-\frac{1}{2}\sum_{i=1}^nx_i^2\right\}\mathclose{}} \cdot {\operatorname{exp}\mathopen{}\left\{-\frac{1}{2}\mathopen{}\left(n \mu^2 - 2 \mu n \bar x\right)\mathclose{}\right\}\mathclose{}} && \text{(writing the exponential of a sum as a product of exponentials)}\\ &\propto {\operatorname{exp}\mathopen{}\left\{-\frac{1}{2}\mathopen{}\left(n \mu^2 - 2 \mu n \bar x\right)\mathclose{}\right\}\mathclose{}} && \text{(dropping factors that do not involve $\mu$)}, \end{aligned} \tag{6}\]

and the prior density is \(\mathbb{p}(\mu) \propto {\operatorname{exp}\mathopen{}\left\{-\frac{1}{2}\mu^2\right\}\mathclose{}}\). Let \(m \stackrel{\text{def}}{=}\frac{n}{n+1} \bar x\). By Corollary 1,

\[ \begin{aligned} \mathbb{p}(\mu\mid \mathord{\smash[b]{\underset{\raise.3ex\hbox{$\scriptstyle\sim$}}{x}}\vphantom{x}}) &\propto \mathbb{p}(\mathord{\smash[b]{\underset{\raise.3ex\hbox{$\scriptstyle\sim$}}{x}}\vphantom{x}}\mid \mu)\, \mathbb{p}(\mu) && \text{(posterior is proportional to likelihood times prior)}\\ &\propto {\operatorname{exp}\mathopen{}\left\{-\frac{1}{2}\mathopen{}\left(n \mu^2 - 2 \mu n \bar x\right)\mathclose{}\right\}\mathclose{}} \cdot {\operatorname{exp}\mathopen{}\left\{-\frac{1}{2}\mu^2\right\}\mathclose{}} && \text{(substituting likelihood and prior)}\\ &= {\operatorname{exp}\mathopen{}\left\{-\frac{1}{2}\mathopen{}\left(n \mu^2 - 2 \mu n \bar x\right)\mathclose{} - \frac{1}{2}\mu^2\right\}\mathclose{}} && \text{(writing a product of exponentials as the exponential of a sum)}\\ &= {\operatorname{exp}\mathopen{}\left\{-\frac{1}{2}\mathopen{}\left(n \mu^2 - 2 \mu n \bar x + \mu^2\right)\mathclose{}\right\}\mathclose{}} && \text{(factoring out $-\tfrac{1}{2}$)}\\ &= {\operatorname{exp}\mathopen{}\left\{-\frac{1}{2}\mathopen{}\left(n \mu^2 + \mu^2 - 2 \mu n \bar x\right)\mathclose{}\right\}\mathclose{}} && \text{(reordering the terms)}\\ &= {\operatorname{exp}\mathopen{}\left\{-\frac{1}{2}\mathopen{}\left((n+1)\mu^2 - 2 \mu n \bar x\right)\mathclose{}\right\}\mathclose{}} && \text{(collecting the $\mu^2$ terms)}\\ &= {\operatorname{exp}\mathopen{}\left\{-\frac{1}{2}(n+1)\mathopen{}\left(\mu^2 - 2 \mu\frac{n}{n+1} \bar x\right)\mathclose{}\right\}\mathclose{}} && \text{(factoring out $n+1$)}\\ &= {\operatorname{exp}\mathopen{}\left\{-\frac{1}{2}(n+1)\mathopen{}\left(\mu^2 - 2 \mu m\right)\mathclose{}\right\}\mathclose{}} && \text{(definition of $m$)}\\ &= {\operatorname{exp}\mathopen{}\left\{-\frac{1}{2}(n+1)\mathopen{}\left((\mu- m)^2 - m^2\right)\mathclose{}\right\}\mathclose{}} && \text{(completing the square)}\\ &\propto {\operatorname{exp}\mathopen{}\left\{-\frac{1}{2}(n+1)(\mu- m)^2\right\}\mathclose{}} && \text{(dropping the factor ${\operatorname{exp}\mathopen{}\left\{\tfrac{1}{2}(n+1)m^2\right\}\mathclose{}}$)}. \end{aligned} \tag{7}\]

The last line is, up to a constant, the density of a Gaussian distribution with mean \(m\) and variance \(1/(n+1)\), so the posterior is

\[ \mu\mid \mathord{\smash[b]{\underset{\raise.3ex\hbox{$\scriptstyle\sim$}}{x}}\vphantom{x}}\;\sim\; {\operatorname{N}\mathopen{}\left(\frac{n}{n+1}{\bar{x}},\; \frac{1}{n+1}\right)\mathclose{}}. \tag{8}\]

The posterior mean \(\frac{n}{n+1}{\bar{x}}\) is the sample mean shrunk toward the prior mean \(0\), and the shrinkage factor \(\frac{n}{n+1}\) approaches \(1\) as \(n \to \infty\).

2.2 The posterior mode

Definition 6 (Maximum a posteriori estimate) The maximum a posteriori (MAP) estimate of a parameter \(\theta\), given observed data \(\mathord{\smash[b]{\underset{\raise.3ex\hbox{$\scriptstyle\sim$}}{Y}}\vphantom{Y}}= \mathord{\smash[b]{\underset{\raise.3ex\hbox{$\scriptstyle\sim$}}{y}}\vphantom{y}}\), written \(\hat{\theta}_{\text{MAP}}\), is the value of \(\theta\) that maximizes the posterior density:

\[\hat{\theta}_{\text{MAP}} \stackrel{\text{def}}{=}\arg \max_\theta\mathbb{p}(\theta\mid \mathord{\smash[b]{\underset{\raise.3ex\hbox{$\scriptstyle\sim$}}{y}}\vphantom{y}}) \tag{9}\]

Source: Wikipedia contributors [8].

Example 7 (The MAP estimate of a proportion) In the Beta-Bernoulli example, the posterior of \(\pi\) after \(r\) successes in \(n\) trials is \(\operatorname{Beta}(a + r,\; b + n - r)\). Write \(\alpha= a + r\) and \(\beta= b + n - r\) for its two parameters. For \(\alpha, \beta> 1\), the log of the posterior density, up to a constant, is \((\alpha- 1)\log \pi+ (\beta- 1)\log(1 - \pi)\). Setting its derivative with respect to \(\pi\) to zero gives

\[ \begin{aligned} 0 &= \frac{\alpha- 1}{\pi} - \frac{\beta- 1}{1 - \pi} && \text{(derivative of the log density)}\\ 0 &= (\alpha- 1)(1 - \pi) - (\beta- 1)\pi && \text{(multiplying by $\pi(1-\pi)$)}\\ (\alpha- 1)(1 - \pi) &= (\beta- 1)\pi && \text{(adding $(\beta- 1)\pi$ to both sides)}\\ (\alpha- 1) - (\alpha- 1)\pi &= (\beta- 1)\pi && \text{(expanding the product on the left)}\\ \alpha- 1 &= (\alpha- 1)\pi+ (\beta- 1)\pi && \text{(adding $(\alpha- 1)\pi$ to both sides)}\\ \alpha- 1 &= (\alpha+ \beta- 2)\pi && \text{(collecting the terms in $\pi$)}, \end{aligned} \]

so \(\hat{\theta}_{\text{MAP}} = \frac{\alpha- 1}{\alpha+ \beta- 2}\). With the uniform prior \(\operatorname{Beta}(1, 1)\), \(r = 55\) successes and \(n = 91\) trials, the posterior is \(\operatorname{Beta}(56, 37)\). Its mode and its mean are:

a_post <- 1 + 55
b_post <- 1 + 91 - 55
c(
  mode = (a_post - 1) / (a_post + b_post - 2),
  mean = a_post / (a_post + b_post)
) |>
  round(3)
#>  mode  mean 
#> 0.604 0.602

The mode equals the sample proportion \(r / n\), because the uniform prior adds no pseudo-counts that pull it away. The mean is a little closer to \(\frac{1}{2}\).

Remark 2 (The MAP estimate is the posterior mode). The MAP estimate is the mode of the posterior distribution.

Corollary 2 (The MAP estimate minimizes the negative log-likelihood plus a penalty) The MAP estimate satisfies

\[ \hat{\theta}_{\text{MAP}} = \arg \min_\theta\mathopen{}\left(-{\operatorname{log}\mathopen{}\left\{\mathbb{p}(\mathord{\smash[b]{\underset{\raise.3ex\hbox{$\scriptstyle\sim$}}{y}}\vphantom{y}}\mid \theta)\right\}\mathclose{}} - {\operatorname{log}\mathopen{}\left\{\mathbb{p}(\theta)\right\}\mathclose{}}\right)\mathclose{}. \tag{10}\]

The first term is the negative log-likelihood. The second term, \(-{\operatorname{log}\mathopen{}\left\{\mathbb{p}(\theta)\right\}\mathclose{}}\), is the penalty that the prior adds.

Proof. By Corollary 1, \(\mathbb{p}(\theta\mid \mathord{\smash[b]{\underset{\raise.3ex\hbox{$\scriptstyle\sim$}}{y}}\vphantom{y}}) \propto \mathbb{p}(\mathord{\smash[b]{\underset{\raise.3ex\hbox{$\scriptstyle\sim$}}{y}}\vphantom{y}}\mid \theta)\, \mathbb{p}(\theta)\), and a positive constant does not change where a function is maximized. The logarithm is an increasing function, so it does not change where a positive function is maximized either. Therefore

\[ \arg \max_\theta\mathbb{p}(\theta\mid \mathord{\smash[b]{\underset{\raise.3ex\hbox{$\scriptstyle\sim$}}{y}}\vphantom{y}}) = \arg \max_\theta\mathopen{}\left({\operatorname{log}\mathopen{}\left\{\mathbb{p}(\mathord{\smash[b]{\underset{\raise.3ex\hbox{$\scriptstyle\sim$}}{y}}\vphantom{y}}\mid \theta)\right\}\mathclose{}} + {\operatorname{log}\mathopen{}\left\{\mathbb{p}(\theta)\right\}\mathclose{}}\right)\mathclose{}. \]

Maximizing a function is the same as minimizing its negative.

Example 8 (The MAP estimate of a Gaussian mean) In Example 6, the posterior is \({\operatorname{N}\mathopen{}\left(\frac{n}{n+1}{\bar{x}}, \frac{1}{n+1}\right)\mathclose{}}\). A Gaussian density is largest at its mean, so

\[\hat{\theta}_{\text{MAP}} = \frac{n}{n+1}{\bar{x}}.\]

Corollary 2 gives the same answer from the penalized form. Up to terms that do not involve \(\mu\), the negative log-likelihood is \(\frac{1}{2}\sum_{i=1}^n(x_i- \mu)^2\) and the penalty is \(\frac{1}{2}\mu^2\). Setting the derivative of their sum to zero gives

\[ \begin{aligned} 0 &= -\sum_{i=1}^n(x_i- \mu) + \mu && \text{(derivative of the sum with respect to $\mu$)}\\ &= -n{\bar{x}}+ n\mu+ \mu && \text{($\sum_i x_i= n{\bar{x}}$)}\\ &= (n+1)\mu- n{\bar{x}}, && \text{(collecting the terms in $\mu$)} \end{aligned} \]

so \(\mu= \frac{n}{n+1}{\bar{x}}\). The penalty \(\frac{1}{2}\mu^2\) pulls the estimate toward the prior mean \(0\), and its pull weakens relative to the data as \(n\) grows.

Figure 1 shows the penalized form for simulated data (\(n = 20\), true mean \(2\)). The penalty is a parabola centered at the prior mean \(0\). Adding it to the negative log-likelihood moves the minimizer from the sample mean toward \(0\).

[Code]
set.seed(1)
n <- 20
x <- rnorm(n = n, mean = 2, sd = 1)
xbar <- mean(x)
map_est <- n / (n + 1) * xbar
mu_grid <- seq(-1, 4, length.out = 501)
nll <- vapply(mu_grid, function(m) sum((x - m)^2) / 2, numeric(1))
curves <- tibble::tibble(
  mu = rep(mu_grid, times = 3),
  curve = rep(
    c("negative log-likelihood", "penalty", "sum"),
    each = length(mu_grid)
  ),
  value = c(nll, mu_grid^2 / 2, nll + mu_grid^2 / 2)
)
ggplot2::ggplot(curves) +
  ggplot2::aes(x = mu, y = value, colour = curve) +
  ggplot2::geom_line() +
  ggplot2::geom_vline(xintercept = c(xbar, map_est), linetype = "dashed") +
  ggplot2::labs(x = expression("Mean, " * mu), y = NULL, colour = NULL)
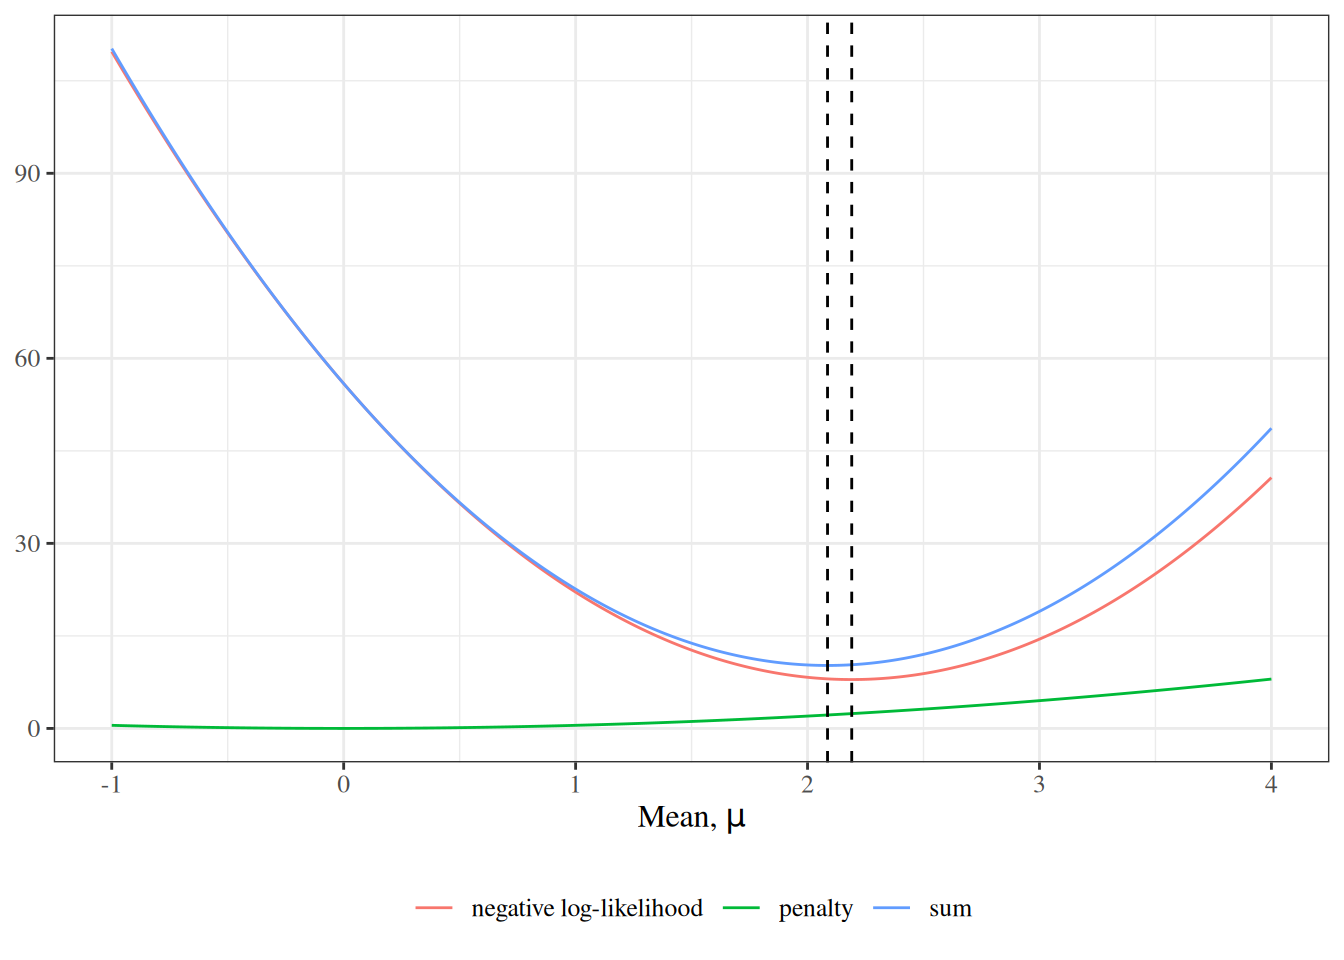
Figure 1: Negative log-likelihood, penalty, and their sum, up to constants. The dashed lines mark the sample mean (right) and the MAP estimate (left).

Three curves over the mean mu. The negative log-likelihood is a parabola with its minimum at the sample mean, near 2.2. The penalty is a parabola with its minimum at 0. Their sum is a parabola with its minimum between the two, slightly left of the sample mean. Vertical lines mark the sample mean and the MAP estimate.

2.3 Two readings of an interval estimate

The two paradigms differ most visibly in how they interpret an interval estimate [1, Ch. 12], p. 272. A frequentist 95% confidence interval is a random interval whose coverage probability, over repeated samples with \(\theta\) held fixed, is 0.95. Any one realized interval either contains \(\theta\) or does not; the 0.95 describes the procedure, not that interval. A Bayesian interval estimate instead makes a probability statement about \(\theta\) itself, given the data actually observed.

Definition 7 (Credible interval) A \(100(1-\alpha)\%\) credible interval for a parameter \(\theta\), given observed data \(\mathord{\smash[b]{\underset{\raise.3ex\hbox{$\scriptstyle\sim$}}{y}}\vphantom{y}}\), is an interval \(\mathopen{}\left[l(\mathord{\smash[b]{\underset{\raise.3ex\hbox{$\scriptstyle\sim$}}{y}}\vphantom{y}}),\, r(\mathord{\smash[b]{\underset{\raise.3ex\hbox{$\scriptstyle\sim$}}{y}}\vphantom{y}})\right]\mathclose{}\) whose posterior probability is \(1 - \alpha\):

\[ {\Pr\mathopen{}\left(l(\mathord{\smash[b]{\underset{\raise.3ex\hbox{$\scriptstyle\sim$}}{y}}\vphantom{y}}) \le \theta\le r(\mathord{\smash[b]{\underset{\raise.3ex\hbox{$\scriptstyle\sim$}}{y}}\vphantom{y}}) \mid \mathord{\smash[b]{\underset{\raise.3ex\hbox{$\scriptstyle\sim$}}{Y}}\vphantom{Y}}= \mathord{\smash[b]{\underset{\raise.3ex\hbox{$\scriptstyle\sim$}}{y}}\vphantom{y}}\right)\mathclose{}} = 1 - \alpha. \]

Source: Wikipedia contributors [9].

In a credible interval, the data are fixed at their observed values and \(\theta\) is random, so the probability statement is about \(\theta\) directly. Many intervals have posterior probability \(1 - \alpha\); the usual choice, and the one used on this page, is the equal-tailed interval.

Definition 8 (Equal-tailed credible interval) The \(100(1-\alpha)\%\) equal-tailed credible interval for \(\theta\) runs from the \(\alpha/2\) quantile to the \(1 - \alpha/2\) quantile of the posterior distribution of \(\theta\).

Example 9 (Equal-tailed interval for a Gaussian posterior) In Example 6, the posterior of \(\mu\) is Gaussian with mean \(\frac{n}{n+1}\bar x\) and standard deviation \(1/\sqrt{n+1}\), so the 95% equal-tailed credible interval is \(\frac{n}{n+1}\bar x \pm 1.96/\sqrt{n+1}\). With \(n = 20\), the interval’s half-width is \(1.96/\sqrt{21} \approx 0.43\).

Example 10 (Credible and confidence intervals for a Gaussian mean) We simulate \(n = 20\) observations from the model of Example 6, with true mean \(\mu= 2\), and compute both a 95% confidence interval, \(\bar x \pm 1.96 / \sqrt{n}\) (the variance is known to be 1), and the equal-tailed 95% credible interval from the \({\operatorname{N}\mathopen{}\left(\frac{n}{n+1}{\bar{x}},\, \frac{1}{n+1}\right)\mathclose{}}\) posterior:

set.seed(1)
mu_true <- 2
n <- 20
x <- rnorm(n = n, mean = mu_true, sd = 1)
xbar <- mean(x)
ci_freq <- xbar + stats::qnorm(c(0.025, 0.975)) / sqrt(n)
post_mean <- n / (n + 1) * xbar
post_sd <- sqrt(1 / (n + 1))
ci_bayes <- stats::qnorm(c(0.025, 0.975), mean = post_mean, sd = post_sd)
rbind(confidence = ci_freq, credible = ci_bayes) |>
  round(3) |>
  `colnames<-`(c("lower", "upper"))
#>            lower upper
#> confidence 1.752 2.629
#> credible   1.659 2.514

The sample mean is \(\bar x = 2.191\). The credible interval is slightly narrower than the confidence interval, because the prior adds information, and shifted toward the prior mean \(0\).

Figure 2 shows how the posterior combines prior and data. Completing the square in the likelihood of Example 6 as a function of \(\mu\) alone shows that the likelihood is proportional to a \({\operatorname{N}\mathopen{}\left(\bar x, 1/n\right)\mathclose{}}\) density, which is the curve drawn for it.

[Code]
mu_grid <- seq(-3, 5, length.out = 801)
curves <- tibble::tibble(
  mu = rep(mu_grid, times = 3),
  curve = rep(c("prior", "likelihood", "posterior"), each = length(mu_grid)),
  density = c(
    stats::dnorm(mu_grid, mean = 0, sd = 1),
    stats::dnorm(mu_grid, mean = xbar, sd = 1 / sqrt(n)),
    stats::dnorm(mu_grid, mean = post_mean, sd = post_sd)
  )
)
ggplot2::ggplot(curves) +
  ggplot2::aes(x = mu, y = density, colour = curve) +
  ggplot2::geom_line() +
  ggplot2::labs(x = expression("Mean, " * mu), y = "density", colour = NULL)
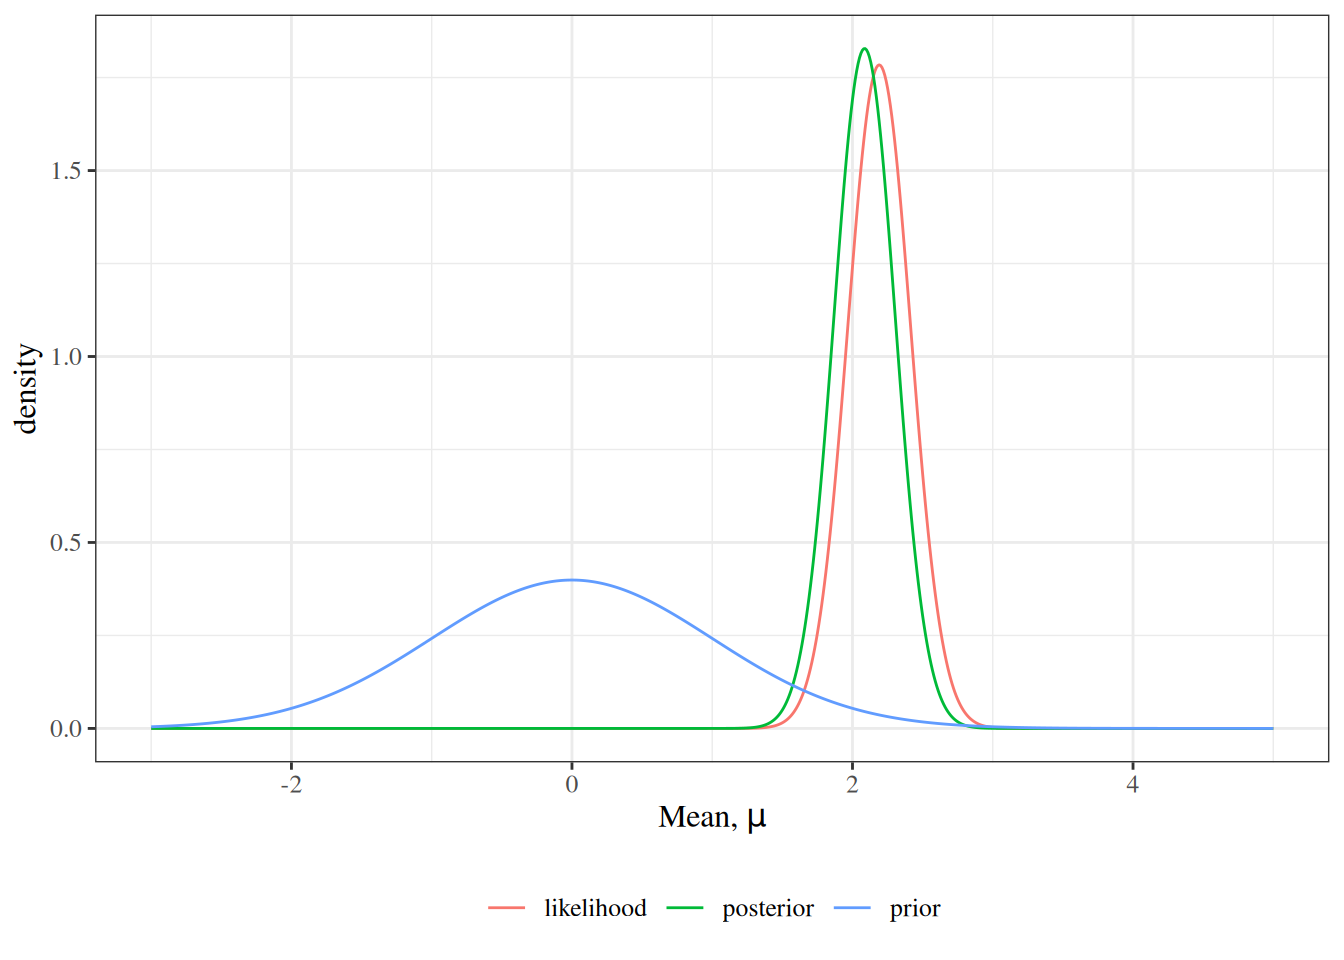
Figure 2: The \({\operatorname{N}\mathopen{}\left(0, 1\right)\mathclose{}}\) prior, the likelihood (scaled to integrate to 1), and the posterior for the mean \(\mu\), for the data of Example 10.

Three bell-shaped curves over the mean mu: a wide prior centered at 0, a narrow likelihood centered near 2.2, and a posterior just as narrow, centered slightly closer to 0 than the likelihood.

Because \(\mu\) has a distribution, the Bayesian can also compute the posterior probability that \(\mu\) lies in the realized confidence interval:

pr_in_ci <- stats::pnorm(ci_freq, mean = post_mean, sd = post_sd) |> diff()
round(pr_in_ci, 3)
#> [1] 0.931

That probability is 0.931, not 0.95: under this prior, the confidence interval sits slightly too far from \(0\). A frequentist cannot assign any probability to the event that \(\mu\) lies in one realized interval, since both are fixed.

Example 11 (A discrete prior on a grid: 8 successes in 10 trials) Suppose \(\pi\) can take only the eleven values \(0, 0.1, 0.2, \ldots, 1\), and we give them equal prior probability, \(\mathbb{p}(\pi) = 1/11\). We observe \(x = 8\) successes in \(n = 10\) independent trials, so that given \(\pi\) the count is \(\operatorname{Binomial}(10, \pi)\):

\[ \mathbb{p}(x \mid \pi) = \binom{10}{x}\pi^{x}(1-\pi)^{10-x}. \]

Because \(\pi\) is discrete, the marginal likelihood is a sum over the grid rather than an integral, and Theorem 1 gives

\[ \mathbb{p}(\pi\mid x = 8) = \frac{\mathbb{p}(x = 8 \mid \pi)\, \mathbb{p}(\pi)} {\sum_{\pi'} \mathbb{p}(x = 8 \mid \pi')\, \mathbb{p}(\pi')}, \]

where the sum runs over the eleven grid values \(\pi'\). The table builds the posterior one column at a time: the prior, the likelihood of the observed count, their product, and the product divided by its sum.

n_trials <- 10
x_obs <- 8

discrete_post <- data.frame(prob = seq(0, 1, by = 0.1))
discrete_post$prior <- 1 / nrow(discrete_post)
discrete_post$likelihood <- stats::dbinom(
  x_obs,
  size = n_trials,
  prob = discrete_post$prob
)
discrete_post$product <- discrete_post$prior * discrete_post$likelihood
marginal_likelihood <- sum(discrete_post$product)
discrete_post$posterior <- discrete_post$product / marginal_likelihood

knitr::kable(discrete_post, digits = 4)
prob prior likelihood product posterior
0.0 0.0909 0.0000 0.0000 0.0000
0.1 0.0909 0.0000 0.0000 0.0000
0.2 0.0909 0.0001 0.0000 0.0001
0.3 0.0909 0.0014 0.0001 0.0016
0.4 0.0909 0.0106 0.0010 0.0117
0.5 0.0909 0.0439 0.0040 0.0485
0.6 0.0909 0.1209 0.0110 0.1335
0.7 0.0909 0.2335 0.0212 0.2576
0.8 0.0909 0.3020 0.0275 0.3333
0.9 0.0909 0.1937 0.0176 0.2138
1.0 0.0909 0.0000 0.0000 0.0000

The marginal likelihood is 0.0824 (with a uniform prior over eleven values, the average of the likelihood column), and the posterior probabilities sum to 1. Figure 3 compares the prior with the posterior.

[Code]
discrete_long <- rbind(
  data.frame(
    prob = discrete_post$prob,
    distribution = "prior",
    probability = discrete_post$prior
  ),
  data.frame(
    prob = discrete_post$prob,
    distribution = "posterior",
    probability = discrete_post$posterior
  )
)
discrete_long$distribution <- factor(
  discrete_long$distribution,
  levels = c("prior", "posterior")
)

ggplot2::ggplot(discrete_long, ggplot2::aes(prob, probability)) +
  ggplot2::geom_col(width = 0.06) +
  ggplot2::facet_wrap(~distribution) +
  ggplot2::scale_x_continuous(breaks = seq(0, 1, by = 0.2)) +
  ggplot2::labs(x = "success probability", y = "probability")
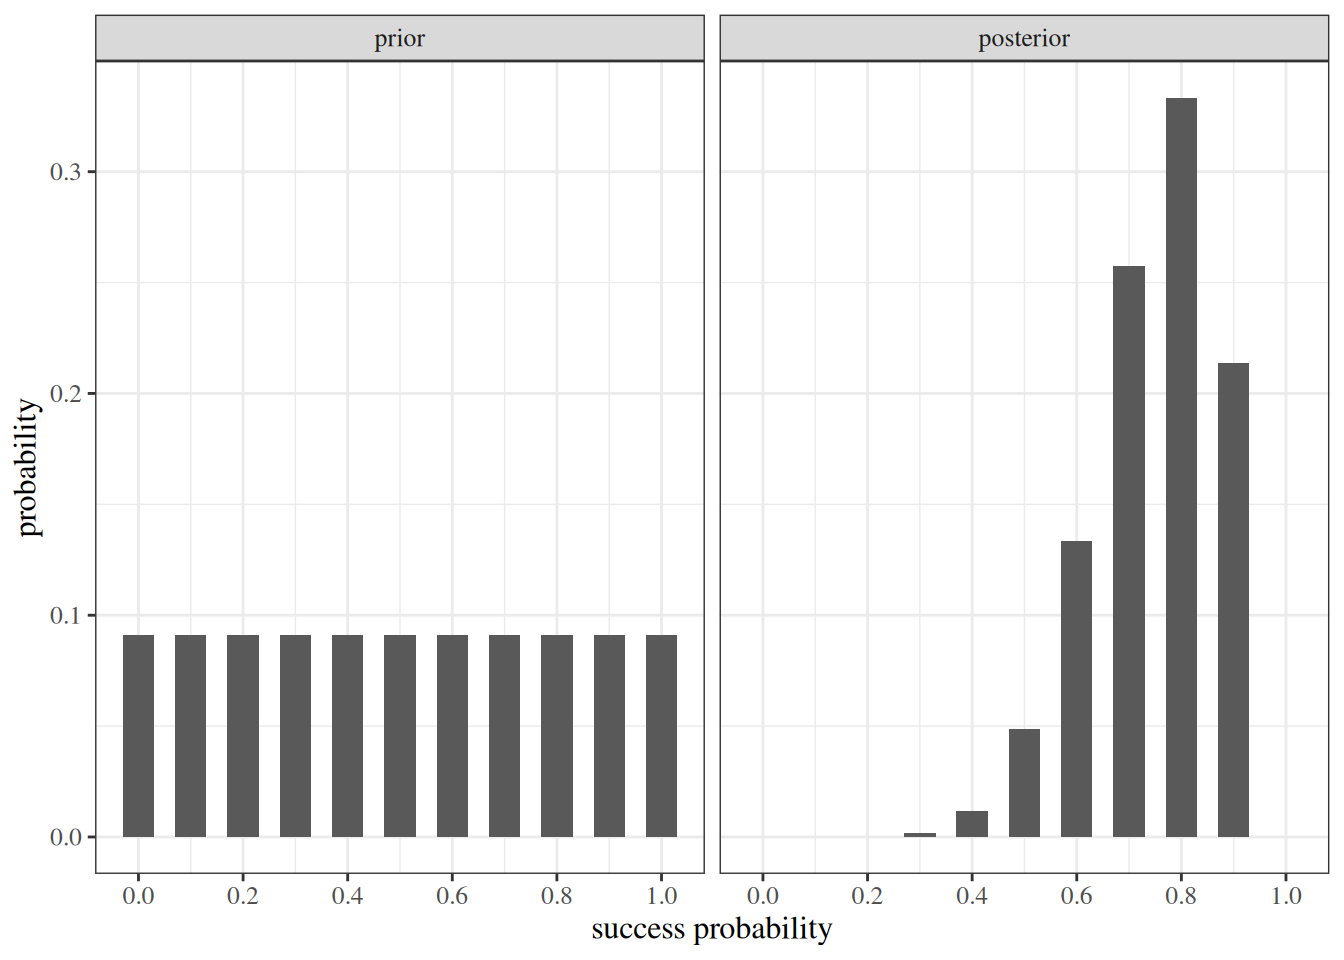
Figure 3: Prior and posterior probabilities on the grid of values of the success probability, after 8 successes in 10 trials.
Two bar charts side by side, each with the grid values 0 to 1 on the horizontal axis and probability on the vertical axis. The prior panel has eleven bars of equal height, 0.091. The posterior panel is hump-shaped, it is tallest at 0.8 with probability 0.333, and the bars at 0 and 1 are zero or nearly zero.

To get an interval, accumulate the posterior probabilities from the bottom of the grid. For each grid value \(\pi_j\), the upper-tail probability \(\Pr(\pi> \pi_j \mid x = 8)\) is one minus the cumulative probability up to and including \(\pi_j\).

discrete_post$cum_posterior <- cumsum(discrete_post$posterior)
discrete_post$upper_tail <- 1 - discrete_post$cum_posterior

lower_bound <- max(discrete_post$prob[discrete_post$upper_tail >= 0.95])
tail_at_bound <- discrete_post$upper_tail[discrete_post$prob == lower_bound]

knitr::kable(
  discrete_post[, c("prob", "posterior", "cum_posterior", "upper_tail")],
  digits = 4
)
prob posterior cum_posterior upper_tail
0.0 0.0000 0.0000 1.0000
0.1 0.0000 0.0000 1.0000
0.2 0.0001 0.0001 0.9999
0.3 0.0016 0.0017 0.9983
0.4 0.0117 0.0134 0.9866
0.5 0.0485 0.0619 0.9381
0.6 0.1335 0.1953 0.8047
0.7 0.2576 0.4530 0.5470
0.8 0.3333 0.7862 0.2138
0.9 0.2138 1.0000 0.0000
1.0 0.0000 1.0000 0.0000

The largest grid value whose upper-tail probability is still at least 0.95 is \(\pi=\) 0.4. So \(\Pr(\pi> 0.4 \mid x = 8) =\) 0.9866, and the one-sided 95% credible interval for \(\pi\) is \((0.4, 1]\): given 8 successes in 10 trials and this prior, the probability that \(\pi\) exceeds 0.4 is at least 0.95.

Unlike a continuous posterior, a discrete posterior can rarely reach a probability of exactly 0.95, because its probability comes in lumps. Definition 7 asks for probability exactly \(1 - \alpha\); on a grid we ask for probability at least \(1 - \alpha\), and take the largest lower endpoint that achieves it. That makes the interval conservative: here its posterior probability is 0.9866, not 0.95.

Casella and Berger [10, Sec. 9.2.4], pp. 435–439 covers Bayesian intervals.

2.4 The parameter space

Definition 9 (Parameter space) The parameter space \(\Theta\) of a model is the set of values that its parameter \(\theta\) can take.

Because the Bayesian treats \(\theta\) as random, the prior and posterior are distributions over the parameter space [1, Ch. 12], p. 273, and the prior has to respect it.

Example 12 (Parameter spaces and priors that respect them)  

  • A probability \(\pi\) has parameter space \((0, 1)\), so its prior should be a distribution on the unit interval, such as the uniform prior of Example 2.
  • A variance \(\sigma^2\) has parameter space \((0, \infty)\), so its prior should be a distribution on the positive half-line.
  • A vector of \(p\) regression coefficients has parameter space \(\mathbb{R}^p\), so its prior should be a distribution on \(\mathbb{R}^p\).

Corollary 3 (The posterior cannot put probability where the prior puts none) If \(\mathbb{p}(\theta) = 0\) for every \(\theta\) in a set \(A \subset \Theta\), then \(\mathbb{p}(\theta\mid \mathord{\smash[b]{\underset{\raise.3ex\hbox{$\scriptstyle\sim$}}{y}}\vphantom{y}}) = 0\) for every \(\theta\in A\), whatever the data \(\mathord{\smash[b]{\underset{\raise.3ex\hbox{$\scriptstyle\sim$}}{y}}\vphantom{y}}\).

Proof. For \(\theta\in A\), the numerator of Equation 1 is \(\mathbb{p}(\mathord{\smash[b]{\underset{\raise.3ex\hbox{$\scriptstyle\sim$}}{y}}\vphantom{y}}\mid \theta) \cdot 0 = 0\).

Example 13 (A prior that rules out the truth) An analyst sure that fewer than half of adults smoke might put a uniform prior on \((0, 0.5)\) for the smoking probability \(\pi\). By Corollary 3, the posterior then gives probability 0 to \(\pi> 0.5\), even if 90 of 100 sampled adults smoke. The support of the prior is itself a modeling assumption, and one that no amount of data can correct.

  • Hogg et al. [11, Sec. 6.8], pp. 298–305 covers Bayesian estimation.
  • Casella and Berger [10, Sec. 7.2.3], pp. 324–325 covers Bayes estimators.
  • Rice [12, Sec. 8.6], pp. 285–297 covers the Bayesian approach to parameter estimation.

3 Priors

The prior encodes what is known about \(\theta\) before the current data are seen. Choosing it is the step that most distinguishes Bayesian practice from frequentist practice, and it is where most of the controversy and most of the craft lie [1, Ch. 12], p. 276.

3.1 Conjugate priors

Definition 10 (Conjugate prior) A family of prior distributions is conjugate to a likelihood if, for every prior in the family and every possible data set, the posterior is also in the family.

Source: Wikipedia contributors [13].

A conjugate prior gives the posterior in closed form: updating the prior only changes the family’s parameters. In Example 6, a Gaussian prior for a Gaussian mean gave a Gaussian posterior. For a related video lecture, see Richard McElreath’s Garden of Forking Data (Statistical Rethinking 2026, Lecture A02).

Example 14 (Beta-Bernoulli updating) Let \(Y_1, \ldots, Y_n \ \sim_{\operatorname{iid}}\ \operatorname{Bernoulli}(\pi)\) given \(\pi\), with \(r = \sum_{i=1}^ny_i\) successes, and let the prior for \(\pi\) be a \(\operatorname{Beta}(a, b)\) distribution, whose density is proportional to \(\pi^{a-1}(1-\pi)^{b-1}\) on \((0, 1)\). The likelihood is

\[ \begin{aligned} \mathbb{p}(\mathord{\smash[b]{\underset{\raise.3ex\hbox{$\scriptstyle\sim$}}{y}}\vphantom{y}}\mid \pi) &= \prod_{i=1}^n\pi^{y_i}(1-\pi)^{1-y_i} && \text{(independent Bernoulli observations)}\\ &= \pi^{\sum_i y_i}(1-\pi)^{n - \sum_i y_i} && \text{(adding exponents)}\\ &= \pi^{r}(1-\pi)^{n-r} && \text{(definition of $r$)}. \end{aligned} \]

By Corollary 1,

\[ \begin{aligned} \mathbb{p}(\pi\mid \mathord{\smash[b]{\underset{\raise.3ex\hbox{$\scriptstyle\sim$}}{y}}\vphantom{y}}) &\propto \pi^{r}(1-\pi)^{n-r} \cdot \pi^{a-1}(1-\pi)^{b-1} && \text{(likelihood times prior)}\\ &= \pi^{a + r - 1}(1-\pi)^{b + n - r - 1} && \text{(adding exponents)}, \end{aligned} \]

which is proportional to the \(\operatorname{Beta}(a + r,\; b + n - r)\) density. So the Beta family is conjugate to the Bernoulli likelihood. The prior parameters \(a\) and \(b\) act as pseudo-counts of prior successes and failures: the posterior adds the \(r\) observed successes and \(n - r\) observed failures to them.

The uniform prior of Example 2 is \(\operatorname{Beta}(1, 1)\). With that prior and \(r = 55\) successes in \(n = 91\) trials, the posterior is \(\operatorname{Beta}(56, 37)\), with this mean and equal-tailed 95% credible interval:

a_post <- 1 + 55
b_post <- 1 + 91 - 55
post_summary <- c(
  mean = a_post / (a_post + b_post),
  lower = stats::qbeta(0.025, a_post, b_post),
  upper = stats::qbeta(0.975, a_post, b_post)
) |>
  round(3)
post_summary
#>  mean lower upper 
#> 0.602 0.501 0.699

The mean uses the \(\operatorname{Beta}(a, b)\) mean \(a / (a + b)\) [10, Sec. 3.3], p. 107. By Definition 7, the interval is read as a probability statement about \(\pi\) itself: given these 91 trials, the posterior probability that \(\pi\) lies between 0.501 and 0.699 is 0.95 (approximately, since those endpoints are rounded to three decimals). A 95% confidence interval computed from the same data supports no such statement, as Section 2.3 explains: its 0.95 describes the procedure over repeated samples, and the realized interval either contains \(\pi\) or does not.

Example 15 (Prior and posterior, with and without a known truth) Plotting the prior and posterior densities together shows how much the data moved our beliefs. We use the Beta-Bernoulli model of Example 14 with the uniform \({\operatorname{Beta}\mathopen{}\left(1, 1\right)\mathclose{}}\) prior of Example 2 on two data sets:

  • Simulated data. We choose the true value of \(\pi\) ourselves, draw Bernoulli observations with that probability, and then check where the posterior puts the truth.
  • Real data. We use the birthwt data on 189 births at Baystate Medical Center in Springfield, Massachusetts, in 1986 [14], [15, Sec. 7.2]. Here \(\pi\) is the probability that a mother in this population smoked during pregnancy, and its true value is unknown. The data ship with R’s MASS package as MASS::birthwt; the Python code reads data/birthwt.csv, a copy of the same table on this site, which is also posted as a CSV file by the Rdatasets project.
prior_a <- 1
prior_b <- 1

set.seed(1)
sim_truth <- 0.3
sim_y <- stats::rbinom(50, size = 1, prob = sim_truth)
smoke_y <- MASS::birthwt$smoke

beta_posterior <- function(y, a = prior_a, b = prior_b) {
  c(a = a + sum(y), b = b + length(y) - sum(y))
}

post_params <- rbind(
  simulated = beta_posterior(sim_y),
  `real (birthwt)` = beta_posterior(smoke_y)
)
post_summary <- data.frame(
  n = c(length(sim_y), length(smoke_y)),
  successes = c(sum(sim_y), sum(smoke_y)),
  post_a = post_params[, "a"],
  post_b = post_params[, "b"],
  mean = post_params[, "a"] / rowSums(post_params),
  lower = stats::qbeta(0.025, post_params[, "a"], post_params[, "b"]),
  upper = stats::qbeta(0.975, post_params[, "a"], post_params[, "b"])
)
post_summary
import numpy as np
import pandas as pd
from scipy import stats

prior_a, prior_b = 1, 1

rng = np.random.default_rng(1)
sim_truth = 0.3
sim_y = rng.binomial(1, sim_truth, size=50)
smoke_y = pd.read_csv("data/birthwt.csv")["smoke"].to_numpy()


def beta_posterior(y, a=prior_a, b=prior_b):
    return a + y.sum(), b + len(y) - y.sum()


rows = []
for name, y in {"simulated": sim_y, "real (birthwt)": smoke_y}.items():
    post_a, post_b = beta_posterior(y)
    rows.append({
        "data": name,
        "n": len(y),
        "successes": y.sum(),
        "post_a": post_a,
        "post_b": post_b,
        "mean": post_a / (post_a + post_b),
        "lower": stats.beta.ppf(0.025, post_a, post_b),
        "upper": stats.beta.ppf(0.975, post_a, post_b),
    })
pd.DataFrame(rows).set_index("data")
#>                   n  successes  post_a  post_b      mean     lower     upper
#> data                                                                        
#> simulated        50         16      17      35  0.326923  0.207583  0.458873
#> real (birthwt)  189         74      75     116  0.392670  0.324742  0.462727

R and Python use different random-number generators, so their simulated draws differ, and their summaries can differ too; the numbers in the text below come from the R code.


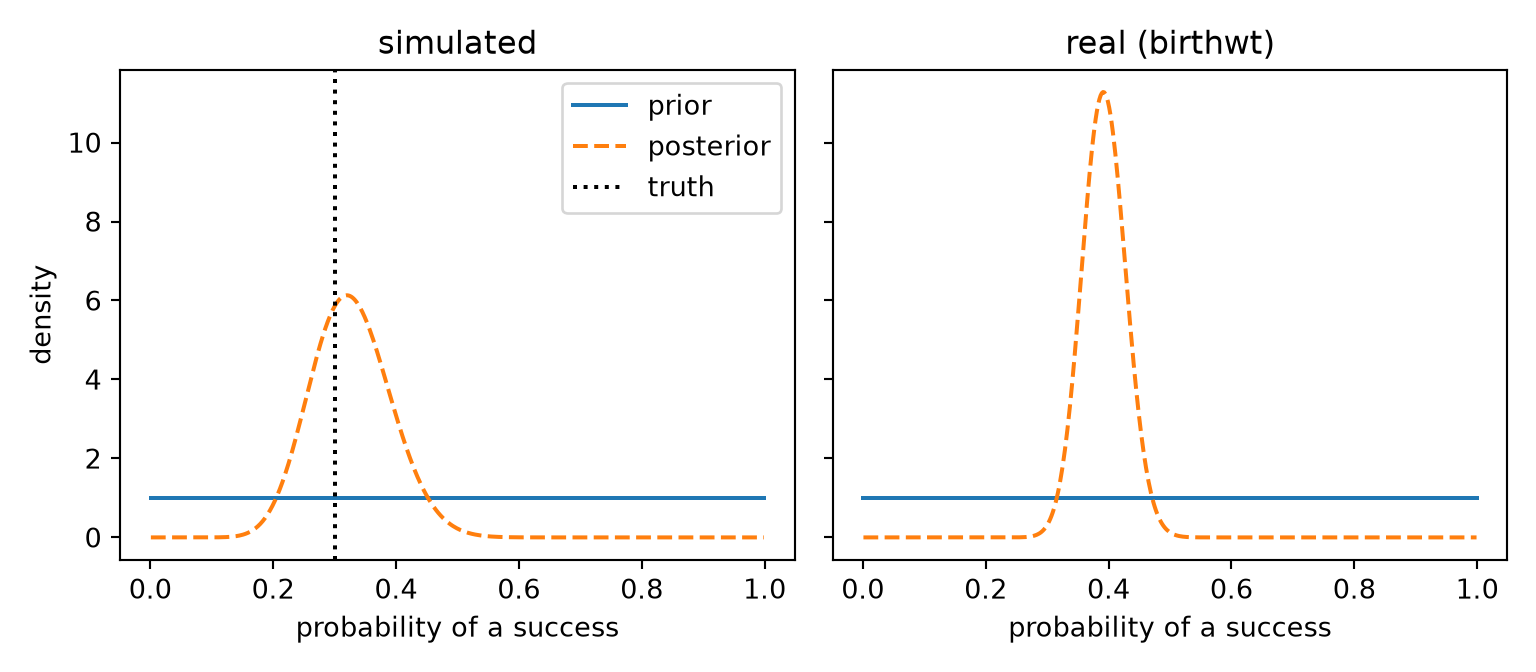
Figure 4 plots each prior and posterior density.

[Code]
prob_grid <- seq(0.001, 0.999, length.out = 500)
density_curves <- dplyr::bind_rows(
  lapply(rownames(post_params), \(data_set) {
    dplyr::bind_rows(
      tibble::tibble(
        data_set = data_set,
        prob = prob_grid,
        distribution = "prior",
        density = stats::dbeta(prob_grid, prior_a, prior_b)
      ),
      tibble::tibble(
        data_set = data_set,
        prob = prob_grid,
        distribution = "posterior",
        density = stats::dbeta(
          prob_grid,
          post_params[data_set, "a"],
          post_params[data_set, "b"]
        )
      )
    )
  })
)
density_curves$data_set <- factor(
  density_curves$data_set,
  levels = rownames(post_params)
)
density_curves$distribution <- factor(
  density_curves$distribution,
  levels = c("prior", "posterior")
)

ggplot2::ggplot(
  density_curves,
  ggplot2::aes(prob, density, colour = distribution, linetype = distribution)
) +
  ggplot2::geom_line(linewidth = 0.8) +
  ggplot2::geom_vline(
    data = tibble::tibble(
      data_set = factor("simulated", levels = rownames(post_params)),
      truth = sim_truth
    ),
    ggplot2::aes(xintercept = truth),
    linetype = "dashed"
  ) +
  ggplot2::facet_wrap(~data_set) +
  ggplot2::labs(
    x = "probability of a success",
    y = "density",
    colour = NULL,
    linetype = NULL
  )
Show Python code
import matplotlib.pyplot as plt
import numpy as np
from scipy import stats

prob_grid = np.linspace(0.001, 0.999, 500)
data_sets = {"simulated": sim_y, "real (birthwt)": smoke_y}
fig, axes = plt.subplots(1, 2, figsize=(8, 3.5), sharey=True)
for ax, (name, y) in zip(axes, data_sets.items()):
    post_a, post_b = beta_posterior(y)
    ax.plot(prob_grid, stats.beta.pdf(prob_grid, prior_a, prior_b),
            label="prior")
    ax.plot(prob_grid, stats.beta.pdf(prob_grid, post_a, post_b),
            linestyle="--", label="posterior")
    if name == "simulated":
        ax.axvline(sim_truth, color="black", linestyle=":", label="truth")
    ax.set_title(name)
    ax.set_xlabel("probability of a success")
axes[0].set_ylabel("density")
axes[0].legend()
plt.tight_layout()
plt.show()
Figure 4: Prior and posterior densities of \(\pi\) under a uniform \({\operatorname{Beta}\mathopen{}\left(1, 1\right)\mathclose{}}\) prior. Left: 50 simulated Bernoulli observations, drawn with true \(\pi= 0.3\) (vertical line). Right: whether each of the 189 mothers in the birthwt data smoked during pregnancy; the true \(\pi\) is unknown.
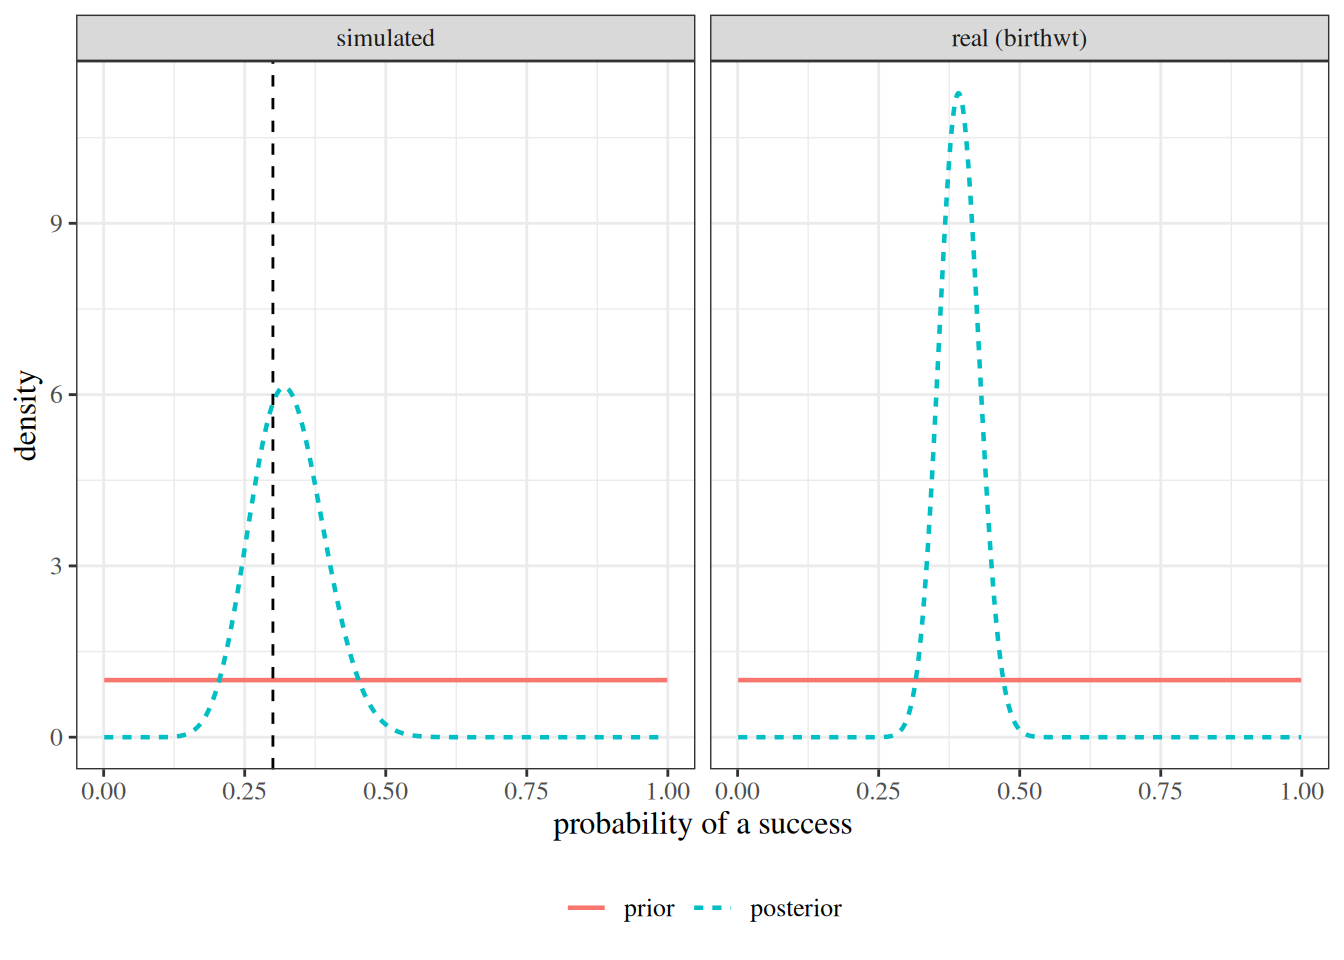
In the simulated panel, 16 of the 50 draws were successes, so the posterior is \({\operatorname{Beta}\mathopen{}\left(17, 35\right)\mathclose{}}\). Its mean is 0.327, and its equal-tailed 95% credible interval runs from 0.208 to 0.459, which contains the true value 0.3. Because we chose the truth, we can check the posterior against it.

In the real panel, 74 of the 189 mothers smoked, so the posterior is \({\operatorname{Beta}\mathopen{}\left(75, 116\right)\mathclose{}}\), with mean 0.393 and 95% credible interval from 0.325 to 0.463. No true value is available to check it against: the posterior is all we have to describe what the data say about \(\pi\).

In both panels, the posterior is much narrower than the flat prior, and the real-data posterior, based on more observations, is the narrower of the two.

3.2 Informative, weakly informative, and flat priors

Priors range along a spectrum of how strongly they constrain \(\theta\) [1, Ch. 12], p. 276.

Definition 11 (Informative prior) An informative prior is a prior that concentrates its probability in a region of the parameter space singled out by knowledge from outside the current data, such as previous studies, biological limits, or expert judgment.

Remark 3 (An informative prior pulls the posterior). An informative prior pulls the posterior toward its region, most strongly when the data are sparse.

Definition 12 (Weakly informative prior) A weakly informative prior is a prior that gives little probability to implausible values of \(\theta\), while spreading its probability nearly evenly across the range of scientifically plausible values.

Definition 13 (Flat prior (uniform prior)) A flat prior, also called a uniform prior, is a prior whose density is constant on the parameter space: \(\mathbb{p}(\theta) \propto 1\) for \(\theta\in \Theta\).

Definition 14 (Improper prior) An improper prior is a nonnegative function \(\mathbb{p}(\theta)\), used in place of a prior density, whose integral over the parameter space is infinite, so that it is not a probability density.

Example 16 (Three priors for a log odds ratio) Let \(\beta\) be the log odds ratio of disease for exposed versus unexposed people, so the odds ratio is \(e^\beta\), and \(\beta\) can be any real number.

  • Informative: a previous study estimated the odds ratio as 1.5, with a standard error of 0.2 for its logarithm, so an analyst adopts the prior \(\beta\sim {\operatorname{N}\mathopen{}\left(\log 1.5,\; 0.2^2\right)\mathclose{}}\).
  • Weakly informative: an analyst with no previous study, who nonetheless regards odds ratios above 100 as implausible, adopts \(\beta\sim {\operatorname{N}\mathopen{}\left(0,\; 2.5^2\right)\mathclose{}}\).
  • Flat: \(\mathbb{p}(\beta) \propto 1\) on the whole real line. This prior is improper, since \(\int_{-\infty}^{\infty} 1 \, d\beta= \infty\); it gives an odds ratio of \(10^6\) the same density as an odds ratio of \(1\).

The two proper priors’ probabilities for large odds ratios:

or_cutoffs <- c(10, 100, 1e6)
rbind(
  informative = stats::pnorm(log(or_cutoffs), log(1.5), 0.2,
    lower.tail = FALSE
  ),
  weakly_informative = stats::pnorm(log(or_cutoffs), 0, 2.5,
    lower.tail = FALSE
  )
) |>
  signif(2) |>
  `colnames<-`(c("Pr(OR > 10)", "Pr(OR > 100)", "Pr(OR > 1e6)"))
#>                    Pr(OR > 10) Pr(OR > 100) Pr(OR > 1e6)
#> informative            1.2e-21      3.4e-98      0.0e+00
#> weakly_informative     1.8e-01      3.3e-02      1.6e-08

The informative prior all but rules out an odds ratio of 10; the weakly informative prior leaves a few percent of its probability above 100, and effectively none above \(10^6\).

Example 17 (A flat prior on a probability is not flat on its log-odds) A flat prior is flat only on the scale on which it is stated. Let \(\pi\) have the uniform prior of Example 2, and let \(\eta\stackrel{\text{def}}{=}\operatorname{logit}(\pi)\) be its log-odds, so that

\[ \begin{aligned} \pi&= \operatorname{expit}(\eta) \\ &= 1 / (1 + e^{-\eta}). \end{aligned} \]

The derivative of \(\operatorname{expit}\) is

\[ \begin{aligned} \frac{d}{d\eta} \operatorname{expit}(\eta) &= \frac{d}{d\eta} (1 + e^{-\eta})^{-1}\\ &= -(1 + e^{-\eta})^{-2} \cdot (-e^{-\eta}) && \text{(chain rule)}\\ &= \frac{1}{1 + e^{-\eta}} \cdot \frac{e^{-\eta}}{1 + e^{-\eta}} && \text{(splitting the fraction)}\\ &= \operatorname{expit}(\eta)\, \mathopen{}\left(1 - \operatorname{expit}(\eta)\right)\mathclose{} && \text{($\tfrac{e^{-\eta}}{1 + e^{-\eta}} = 1 - \tfrac{1}{1 + e^{-\eta}}$)}. \end{aligned} \]

By the change-of-variables formula for densities [10], Theorem 2.1.5, the prior density of \(\eta\) is

\[ \begin{aligned} \mathbb{p}_\eta(\eta) &= \mathbb{p}_\pi\mathopen{}\left(\operatorname{expit}(\eta)\right)\mathclose{} \cdot \mathopen{}\left|\frac{d}{d\eta} \operatorname{expit}(\eta)\right|\mathclose{} && \text{(change of variables)}\\ &= 1 \cdot \operatorname{expit}(\eta)\, \mathopen{}\left(1 - \operatorname{expit}(\eta)\right)\mathclose{} && \text{(uniform density of $\pi$; derivative of $\operatorname{expit}$)}, \end{aligned} \]

the standard logistic density, which peaks at \(\eta= 0\) and decays in both directions. Under this prior, \(\Pr(-1 < \eta< 1) = \operatorname{expit}(1) - \operatorname{expit}(-1) \approx 0.46\), whereas a flat prior on \(\eta\) would make every interval of length 2 equally likely. “Noninformative” therefore depends on the parameterization.

Corollary 4 (Under a flat prior, the posterior is proportional to the likelihood) If the prior is flat on a parameter space \(\Theta\) of finite length (or volume), then, as a function of \(\theta\in \Theta\),

\[ \mathbb{p}(\theta\mid \mathord{\smash[b]{\underset{\raise.3ex\hbox{$\scriptstyle\sim$}}{y}}\vphantom{y}}) \propto \mathcal{L}(\theta), \]

where \(\mathcal{L}\) is the likelihood, and any value of \(\theta\) that maximizes the posterior density is a maximum likelihood estimate.

Proof. By Corollary 1, \(\mathbb{p}(\theta\mid \mathord{\smash[b]{\underset{\raise.3ex\hbox{$\scriptstyle\sim$}}{y}}\vphantom{y}}) \propto \mathcal{L}(\theta)\, \mathbb{p}(\theta)\), and \(\mathbb{p}(\theta)\) is the same constant for every \(\theta\in \Theta\). Multiplying a function by a positive constant does not change where it is maximized.

Remark 4 (Flat priors can be improper). A flat prior on an unbounded parameter space, such as \(\mathbb{R}\), is improper, so it does not define a joint distribution of \(\theta\) and \(\mathord{\smash[b]{\underset{\raise.3ex\hbox{$\scriptstyle\sim$}}{Y}}\vphantom{Y}}\), and Definition 4 does not apply directly. In practice the posterior is then defined as likelihood times prior, normalized to integrate to 1, which is possible only when that product has a finite integral; the posterior is again proportional to the likelihood.

Example 18 (Posterior mode and maximum likelihood estimate for a probability) In Example 14 the prior is uniform on \((0, 1)\), so by Corollary 4 the posterior density, proportional to \(\pi^{55}(1-\pi)^{36}\), is maximized at the maximum likelihood estimate. Setting the derivative of the log-likelihood \(r \log \pi+ (n - r)\log(1 - \pi)\), which is \(r/\pi- (n - r)/(1 - \pi)\), to zero gives

\[ \begin{aligned} \hat{\pi}&= r/n \\ &= 55/91 \\ &\approx 0.604. \end{aligned} \]

The posterior mean, \(56/93 \approx 0.602\), is not the maximum likelihood estimate: Corollary 4 concerns the posterior’s shape, and so its mode, but a mean depends on the whole distribution.

3.3 A skeptical prior

Definition 15 (Skeptical prior) A skeptical prior is an informative prior centered on the parameter value that represents no effect, and concentrated near that value [1, Ch. 12], p. 277.

Remark 5 (What a skeptical prior asks). A skeptical prior asks how strong the data must be to overturn a default of no effect.

Example 19 (A skeptical prior for a Gaussian mean) In the model of Example 6, replace the \({\operatorname{N}\mathopen{}\left(0, 1\right)\mathclose{}}\) prior by the skeptical prior \(\mu\sim {\operatorname{N}\mathopen{}\left(0, \tau^2\right)\mathclose{}}\), whose standard deviation \(\tau\) sets how skeptical it is. Its density is proportional to \({\operatorname{exp}\mathopen{}\left\{-\frac{1}{2}\mu^2/\tau^2\right\}\mathclose{}}\). Let \(m_\tau\stackrel{\text{def}}{=}\frac{n \bar x}{n + 1/\tau^2}\). Reusing the likelihood from Example 6:

\[ \begin{aligned} \mathbb{p}(\mu\mid \mathord{\smash[b]{\underset{\raise.3ex\hbox{$\scriptstyle\sim$}}{x}}\vphantom{x}}) &\propto {\operatorname{exp}\mathopen{}\left\{-\frac{1}{2}\mathopen{}\left(n \mu^2 - 2 \mu n \bar x\right)\mathclose{}\right\}\mathclose{}} \cdot {\operatorname{exp}\mathopen{}\left\{-\frac{1}{2}\frac{\mu^2}{\tau^2}\right\}\mathclose{}} && \text{(likelihood times prior)}\\ &= {\operatorname{exp}\mathopen{}\left\{-\frac{1}{2}\mathopen{}\left(\mathopen{}\left(n + \frac{1}{\tau^2}\right)\mathclose{}\mu^2 - 2 \mu n \bar x\right)\mathclose{}\right\}\mathclose{}} && \text{(adding exponents)}\\ &= {\operatorname{exp}\mathopen{}\left\{-\frac{1}{2}\mathopen{}\left(n + \frac{1}{\tau^2}\right)\mathclose{}\mathopen{}\left(\mu^2 - 2 \mu m_\tau\right)\mathclose{}\right\}\mathclose{}} && \text{(factoring; definition of $m_\tau$)}\\ &= {\operatorname{exp}\mathopen{}\left\{-\frac{1}{2}\mathopen{}\left(n + \frac{1}{\tau^2}\right)\mathclose{}\mathopen{}\left((\mu- m_\tau)^2 - m_\tau^2\right)\mathclose{}\right\}\mathclose{}} && \text{(completing the square)}\\ &\propto {\operatorname{exp}\mathopen{}\left\{-\frac{1}{2}\mathopen{}\left(n + \frac{1}{\tau^2}\right)\mathclose{}(\mu- m_\tau)^2\right\}\mathclose{}} && \text{(dropping a factor that does not involve $\mu$)}. \end{aligned} \]

So \(\mu\mid \mathord{\smash[b]{\underset{\raise.3ex\hbox{$\scriptstyle\sim$}}{x}}\vphantom{x}}\sim {\operatorname{N}\mathopen{}\left(m_\tau,\; 1 / (n + 1/\tau^2)\right)\mathclose{}}\), and \(\tau= 1\) recovers Example 6. The posterior mean

\[ m_\tau= \frac{n \cdot \bar x + \frac{1}{\tau^2} \cdot 0}{n + \frac{1}{\tau^2}} \]

is a weighted average of the sample mean and the prior mean \(0\), weighted by the precision \(n\) of the data and the precision \(1/\tau^2\) of the prior (a precision is a reciprocal variance). The more skeptical the prior (the smaller \(\tau\)), the more the posterior mean shrinks toward \(0\). With \(\bar x = 2\) and \(n = 20\) held fixed:

xbar <- 2
n <- 20
tau <- c(0.1, 0.25, 0.5, 1, 2, 10)
data.frame(prior_sd = tau, posterior_mean = n * xbar / (n + 1 / tau^2)) |>
  round(3)

The most skeptical prior (\(\tau= 0.1\)) pulls the posterior mean down to one sixth of the sample mean, while the most diffuse (\(\tau= 10\)) leaves it essentially at \(\bar x\).

4 Predictive checks

A Bayesian model makes predictions about data, both before and after the data are seen. Comparing those predictions with the data we actually have is a way to check the model. A check made before the data are used tests the prior; a check made after the data are used tests the whole model [16, Sec. 6.3], p. 143, [17, Sec. 4.3.2], pp. 82-83. For a related video lecture, see Richard McElreath’s Geocentric Models (Statistical Rethinking 2026, Lecture A03).

Definition 16 (Prior predictive distribution) The prior predictive distribution of the data \(\mathord{\smash[b]{\underset{\raise.3ex\hbox{$\scriptstyle\sim$}}{Y}}\vphantom{Y}}\) is the distribution of \(\mathord{\smash[b]{\underset{\raise.3ex\hbox{$\scriptstyle\sim$}}{Y}}\vphantom{Y}}\) implied by the prior \(\mathbb{p}(\theta)\) and the model \(\mathbb{p}(\mathord{\smash[b]{\underset{\raise.3ex\hbox{$\scriptstyle\sim$}}{y}}\vphantom{y}}\mid \theta)\), before any data are observed [16, Sec. 1.3], p. 7, eq. 1.3:

\[ \mathbb{p}(\mathord{\smash[b]{\underset{\raise.3ex\hbox{$\scriptstyle\sim$}}{y}}\vphantom{y}}) = \int \mathbb{p}(\mathord{\smash[b]{\underset{\raise.3ex\hbox{$\scriptstyle\sim$}}{y}}\vphantom{y}}\mid \theta)\, \mathbb{p}(\theta)\, d\theta. \]

Example 20 (Prior predictive distribution of a count) In the Beta-Bernoulli model of Example 14, the number of successes \(R = \sum_{i=1}^nY_i\) given \(\pi\) is \(\operatorname{Binomial}(n, \pi)\). Under the uniform \({\operatorname{Beta}\mathopen{}\left(1, 1\right)\mathclose{}}\) prior, its prior predictive probabilities are

\[ \begin{aligned} {\Pr\mathopen{}\left(R = r\right)\mathclose{}} &= \int_0^1 \binom{n}{r} \pi^{r} (1 - \pi)^{n - r} \cdot 1 \, d\pi && \text{(definition of the prior predictive distribution)}\\ &= \binom{n}{r} \frac{r!\,(n - r)!}{(n + 1)!} && \text{(the Beta integral)}\\ &= \frac{n!}{r!\,(n - r)!} \cdot \frac{r!\,(n - r)!}{(n + 1)!} && \text{(definition of the binomial coefficient)}\\ &= \frac{n!}{(n + 1)!} && \text{(the factor $r!\,(n - r)!$ appears above and below)}\\ &= \frac{1}{n + 1} && \text{($(n + 1)! = (n + 1) \cdot n!$)}, \end{aligned} \]

for \(r = 0, 1, \ldots, n\). So the uniform prior says that, before seeing the data, every count of successes is equally likely [16, Sec. 2.4], p. 34. For the 189 mothers in the birthwt data, the code below computes these probabilities from the Beta-binomial probability mass function:

n_mothers <- nrow(MASS::birthwt)
counts <- 0:n_mothers
prior_pred <- choose(n_mothers, counts) *
  beta(counts + 1, n_mothers - counts + 1) / beta(1, 1)
c(
  smallest = min(prior_pred),
  largest = max(prior_pred),
  one_over_n_plus_1 = 1 / (n_mothers + 1)
)
#>          smallest           largest one_over_n_plus_1 
#>        0.00526316        0.00526316        0.00526316
import numpy as np
import pandas as pd
from scipy import stats

n_mothers = len(pd.read_csv("data/birthwt.csv"))
counts = np.arange(n_mothers + 1)
prior_pred = stats.betabinom.pmf(counts, n_mothers, 1, 1)
{
    "smallest": prior_pred.min(),
    "largest": prior_pred.max(),
    "one_over_n_plus_1": 1 / (n_mothers + 1),
}
#> {'smallest': np.float64(0.005263157894736842), 'largest': np.float64(0.005263157894736846), 'one_over_n_plus_1': 0.005263157894736842}

Remark 6 (The prior predictive distribution and the marginal likelihood). The prior predictive distribution (Definition 16) is the marginal likelihood, read as a distribution over possible data sets [16, Sec. 1.3], p. 7, eq. 1.3.

Definition 17 (Posterior predictive distribution) The posterior predictive distribution of a new observation \(Y^{\mathrm{new}}\), given observed data \(\mathord{\smash[b]{\underset{\raise.3ex\hbox{$\scriptstyle\sim$}}{Y}}\vphantom{Y}}= \mathord{\smash[b]{\underset{\raise.3ex\hbox{$\scriptstyle\sim$}}{y}}\vphantom{y}}\), is the distribution of \(Y^{\mathrm{new}}\) implied by the posterior \(\mathbb{p}(\theta\mid \mathord{\smash[b]{\underset{\raise.3ex\hbox{$\scriptstyle\sim$}}{y}}\vphantom{y}})\) and the model \(\mathbb{p}(y^{\mathrm{new}} \mid \theta)\):

\[ \mathbb{p}(y^{\mathrm{new}} \mid \mathord{\smash[b]{\underset{\raise.3ex\hbox{$\scriptstyle\sim$}}{y}}\vphantom{y}}) = \int \mathbb{p}(y^{\mathrm{new}} \mid \theta)\, \mathbb{p}(\theta\mid \mathord{\smash[b]{\underset{\raise.3ex\hbox{$\scriptstyle\sim$}}{y}}\vphantom{y}})\, d\theta, \]

where \(Y^{\mathrm{new}}\) and \(\mathord{\smash[b]{\underset{\raise.3ex\hbox{$\scriptstyle\sim$}}{Y}}\vphantom{Y}}\) are independent given \(\theta\) [16, Sec. 1.3], p. 7, eq. 1.4. The same formula, with \(y^{\mathrm{new}}\) replaced by a whole replicated data set \(\mathord{\smash[b]{\underset{\raise.3ex\hbox{$\scriptstyle\sim$}}{y}}\vphantom{y}}^{\mathrm{rep}}\) of the same size as \(\mathord{\smash[b]{\underset{\raise.3ex\hbox{$\scriptstyle\sim$}}{y}}\vphantom{y}}\), gives the posterior predictive distribution of replicated data.

Source: Wikipedia contributors [18].

Example 21 (Will the next mother smoke?) Let \(Y^{\mathrm{new}} = 1\) if one more mother from the birthwt population smoked during pregnancy, and \(Y^{\mathrm{new}} = 0\) if she did not. Given \(\pi\),

\[ {\Pr\mathopen{}\left(Y^{\mathrm{new}} = 1 \mid \pi\right)\mathclose{}} = \pi. \]

With the posterior \(\mathbb{p}(\pi\mid \mathord{\smash[b]{\underset{\raise.3ex\hbox{$\scriptstyle\sim$}}{y}}\vphantom{y}})\) of Example 15,

\[ \begin{aligned} {\Pr\mathopen{}\left(Y^{\mathrm{new}} = 1 \mid \mathord{\smash[b]{\underset{\raise.3ex\hbox{$\scriptstyle\sim$}}{y}}\vphantom{y}}\right)\mathclose{}} &= \int_0^1 {\Pr\mathopen{}\left(Y^{\mathrm{new}} = 1 \mid \pi\right)\mathclose{}}\, \mathbb{p}(\pi\mid \mathord{\smash[b]{\underset{\raise.3ex\hbox{$\scriptstyle\sim$}}{y}}\vphantom{y}})\, d\pi && \text{(definition of the posterior predictive distribution)}\\ &= \int_0^1 \pi\, \mathbb{p}(\pi\mid \mathord{\smash[b]{\underset{\raise.3ex\hbox{$\scriptstyle\sim$}}{y}}\vphantom{y}})\, d\pi && \text{(Bernoulli model)}\\ &= {\mathbb{E}\mathopen{}\left[\pi\mid \mathord{\smash[b]{\underset{\raise.3ex\hbox{$\scriptstyle\sim$}}{y}}\vphantom{y}}\right]\mathclose{}} && \text{(definition of the posterior mean)}. \end{aligned} \]

So the posterior predictive probability that the next mother smoked is the posterior mean of \(\pi\), 0.393. The code below checks this by simulation: draw \(\pi\) from its posterior, then draw \(Y^{\mathrm{new}}\) given that \(\pi\).

set.seed(2)
prob_draws <- stats::rbeta(
  10000,
  post_params["real (birthwt)", "a"],
  post_params["real (birthwt)", "b"]
)
y_new <- stats::rbinom(10000, size = 1, prob = prob_draws)
c(
  simulated = mean(y_new),
  exact = post_summary["real (birthwt)", "mean"]
)
#> simulated     exact 
#>   0.38850   0.39267
import numpy as np
import pandas as pd

smoke_y = pd.read_csv("data/birthwt.csv")["smoke"].to_numpy()
post_a = 1 + smoke_y.sum()
post_b = 1 + len(smoke_y) - smoke_y.sum()

rng = np.random.default_rng(2)
prob_draws = rng.beta(post_a, post_b, size=10000)
y_new = rng.binomial(1, prob_draws)
{"simulated": y_new.mean(), "exact": post_a / (post_a + post_b)}
#> {'simulated': np.float64(0.3929), 'exact': np.float64(0.39267015706806285)}

Definition 18 (Test quantity) A test quantity \(T(\mathord{\smash[b]{\underset{\raise.3ex\hbox{$\scriptstyle\sim$}}{y}}\vphantom{y}})\) is a number computed from a data set that summarizes an aspect of the data we want the model to reproduce [16, Sec. 6.3], p. 145.

Example 22 (Two test quantities for the smoking data) The birthwt data also record each mother’s race, coded as white, Black, or other. The Beta-Bernoulli model gives every mother the same probability \(\pi\) of smoking, whatever her race. Two test quantities for these data are:

  • the number of mothers who smoked, \(T_1(\mathord{\smash[b]{\underset{\raise.3ex\hbox{$\scriptstyle\sim$}}{y}}\vphantom{y}}) = \sum_{i=1}^ny_i\);
  • the spread of the smoking proportions across the three race groups, \(T_2(\mathord{\smash[b]{\underset{\raise.3ex\hbox{$\scriptstyle\sim$}}{y}}\vphantom{y}}) = \max_g {\bar{y}}_g - \min_g {\bar{y}}_g\), where \({\bar{y}}_g\) is the proportion of mothers in group \(g\) who smoked.

The model can match \(T_1\) by choosing \(\pi\), but it predicts that \(T_2\) is small, because it gives every group the same \(\pi\). Their observed values are:

race <- factor(
  MASS::birthwt$race,
  levels = 1:3,
  labels = c("white", "Black", "other")
)
t_count <- function(y) sum(y)
t_spread <- function(y) diff(range(tapply(y, race, mean)))

tapply(smoke_y, race, mean)
#>    white    Black    other 
#> 0.541667 0.384615 0.179104
c(T1 = t_count(smoke_y), T2 = t_spread(smoke_y))
#>        T1        T2 
#> 74.000000  0.362562
import pandas as pd

birthwt = pd.read_csv("data/birthwt.csv")
race = birthwt["race"].map({1: "white", 2: "Black", 3: "other"}).to_numpy()
smoke_y = birthwt["smoke"].to_numpy()


def t_count(y):
    return y.sum()


def t_spread(y):
    group_means = pd.Series(y).groupby(race).mean()
    return group_means.max() - group_means.min()


print(pd.Series(smoke_y).groupby(race).mean())
#> Black    0.384615
#> other    0.179104
#> white    0.541667
#> dtype: float64
{"T1": t_count(smoke_y), "T2": t_spread(smoke_y)}
#> {'T1': np.int64(74), 'T2': np.float64(0.36256218905472637)}

Definition 19 (Prior predictive check) A prior predictive check compares a test quantity \(T(\mathord{\smash[b]{\underset{\raise.3ex\hbox{$\scriptstyle\sim$}}{y}}\vphantom{y}})\) of the observed data with the distribution of \(T(\mathord{\smash[b]{\underset{\raise.3ex\hbox{$\scriptstyle\sim$}}{Y}}\vphantom{Y}})\) under the prior predictive distribution. If the observed value would be very unlikely under that distribution, the prior and the data disagree [17, Sec. 4.3.2], pp. 82-83.

Example 23 (Checking two priors for the smoking probability) We compare two priors for \(\pi\) in the birthwt data:

  • the uniform \({\operatorname{Beta}\mathopen{}\left(1, 1\right)\mathclose{}}\) prior of Example 2;
  • a \({\operatorname{Beta}\mathopen{}\left(1, 19\right)\mathclose{}}\) prior, with prior mean \(1 / (1 + 19) = 0.05\), which an analyst might choose if they believed that smoking during pregnancy was rare.

For each prior, we draw \(\pi\) from the prior, then draw a count of smokers \(T_1(\mathord{\smash[b]{\underset{\raise.3ex\hbox{$\scriptstyle\sim$}}{Y}}\vphantom{Y}})\) among 189 mothers given that \(\pi\).

check_priors <- list(
  `uniform Beta(1, 1)` = c(a = 1, b = 1),
  `Beta(1, 19)` = c(a = 1, b = 19)
)
set.seed(3)
prior_pred_counts <- dplyr::bind_rows(
  lapply(names(check_priors), \(prior_name) {
    ab <- check_priors[[prior_name]]
    prob_draws <- stats::rbeta(4000, ab[["a"]], ab[["b"]])
    tibble::tibble(
      prior = prior_name,
      count = stats::rbinom(4000, size = n_mothers, prob = prob_draws)
    )
  })
)
prior_pred_counts$prior <- factor(
  prior_pred_counts$prior,
  levels = names(check_priors)
)
prior_tail <- tapply(
  prior_pred_counts$count >= t_count(smoke_y),
  prior_pred_counts$prior,
  mean
)
prior_tail
#> uniform Beta(1, 1)        Beta(1, 19) 
#>             0.6110             0.0005
import numpy as np
import pandas as pd

smoke_y = pd.read_csv("data/birthwt.csv")["smoke"].to_numpy()
n_mothers = len(smoke_y)
check_priors = {"uniform Beta(1, 1)": (1, 1), "Beta(1, 19)": (1, 19)}

rng = np.random.default_rng(3)
prior_pred_counts = {}
for name, (a, b) in check_priors.items():
    prob_draws = rng.beta(a, b, size=4000)
    prior_pred_counts[name] = rng.binomial(n_mothers, prob_draws)

{name: (counts >= smoke_y.sum()).mean()
 for name, counts in prior_pred_counts.items()}
#> {'uniform Beta(1, 1)': np.float64(0.6095), 'Beta(1, 19)': np.float64(0.0)}

The output is the proportion of simulated counts at least as large as the observed count, 74.


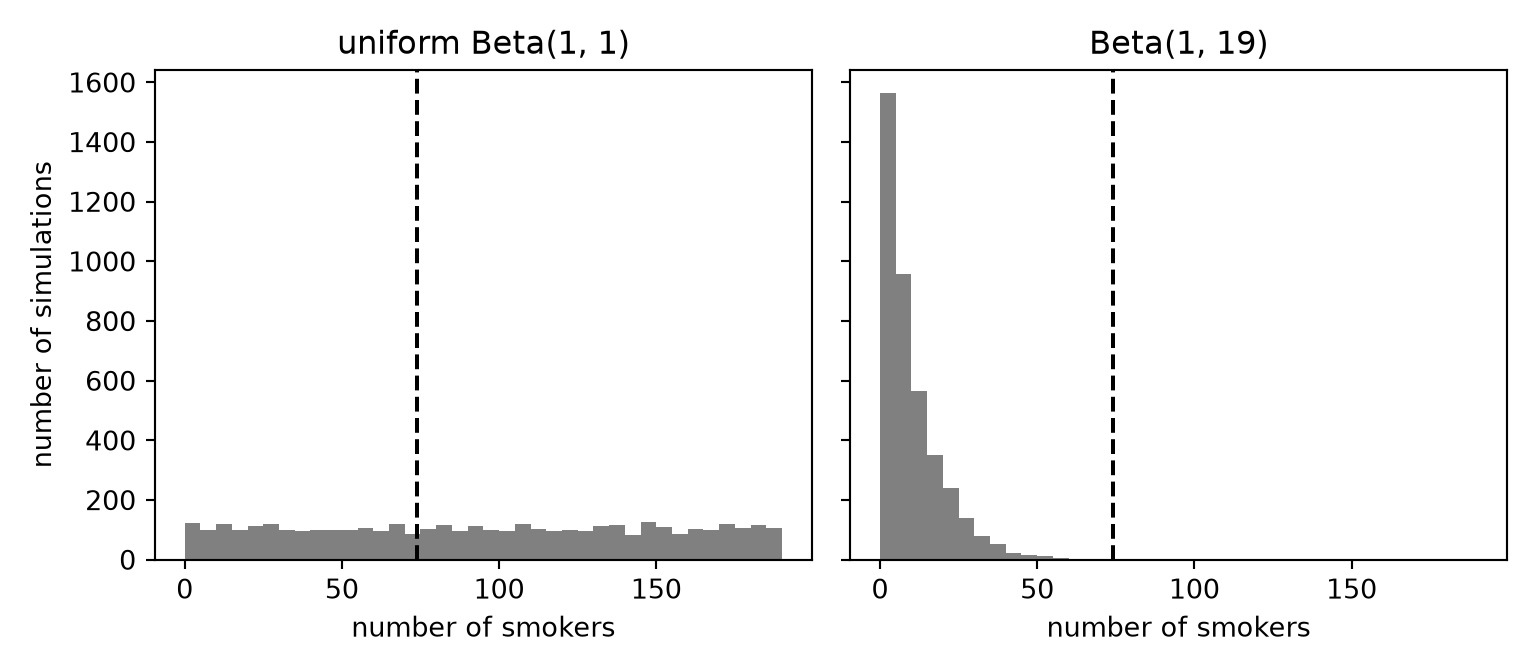
Figure 5 plots the simulated counts.

[Code]
ggplot2::ggplot(prior_pred_counts, ggplot2::aes(count)) +
  ggplot2::geom_histogram(binwidth = 5, boundary = 0) +
  ggplot2::geom_vline(xintercept = t_count(smoke_y), linetype = "dashed") +
  ggplot2::facet_wrap(~prior) +
  ggplot2::labs(x = "number of smokers", y = "number of simulations")
Show Python code
import matplotlib.pyplot as plt
import numpy as np

fig, axes = plt.subplots(1, 2, figsize=(8, 3.5), sharey=True)
for ax, (name, counts) in zip(axes, prior_pred_counts.items()):
    ax.hist(counts, bins=np.arange(0, n_mothers + 6, 5), color="grey")
    ax.axvline(smoke_y.sum(), color="black", linestyle="--")
    ax.set_title(name)
    ax.set_xlabel("number of smokers")
axes[0].set_ylabel("number of simulations")
plt.tight_layout()
plt.show()
Figure 5: Prior predictive distributions of the number of smokers among the 189 mothers in the birthwt data, from 4000 simulations under each prior. The dashed line is the observed count, 74.
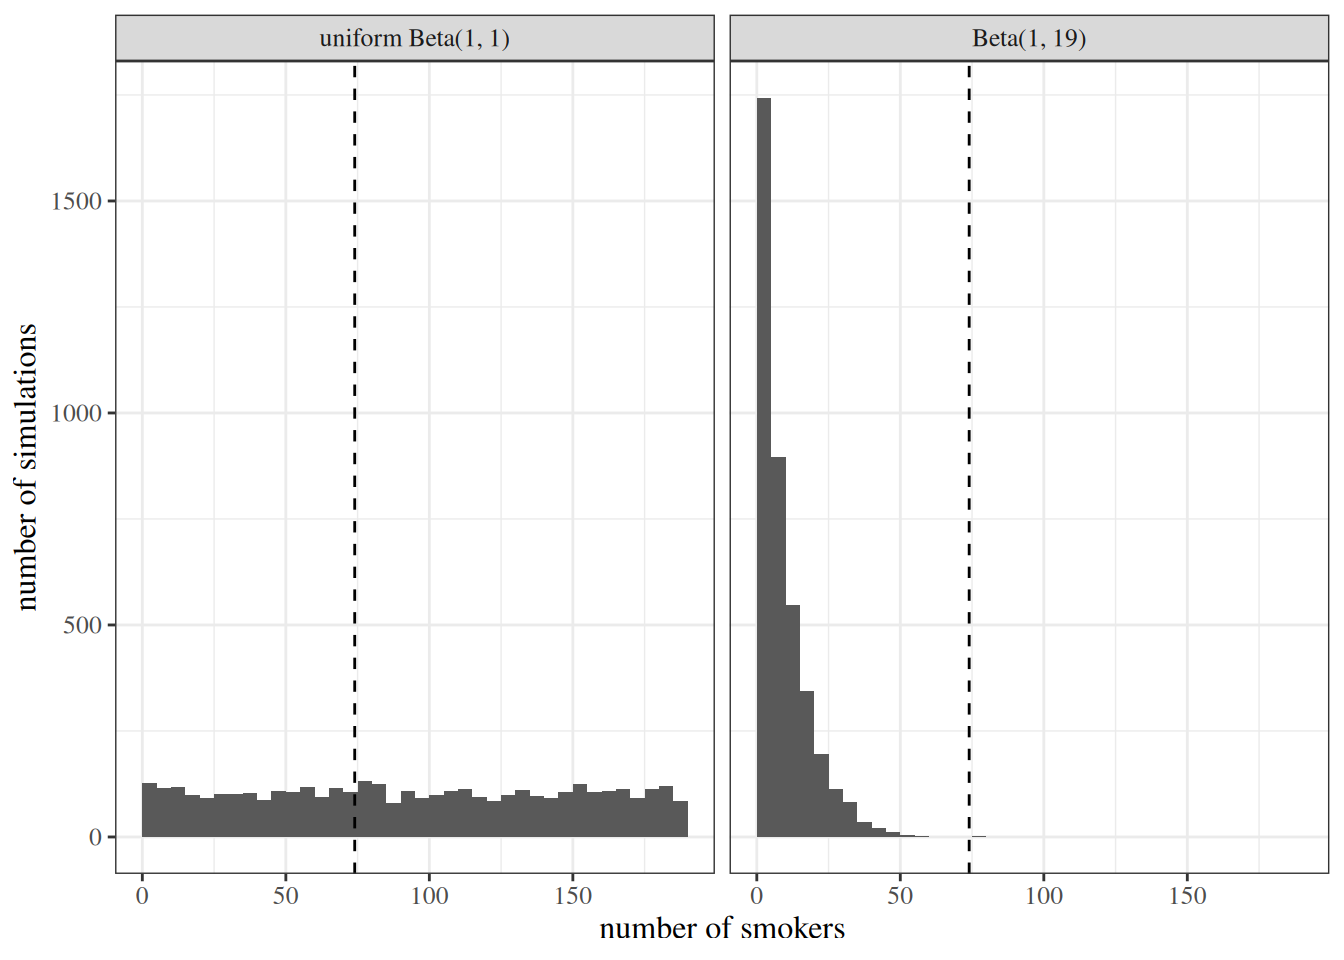
Under the uniform prior, 0.611 of the simulated counts are at least as large as the observed count, so the data are unsurprising under that prior. Under the \({\operatorname{Beta}\mathopen{}\left(1, 19\right)\mathclose{}}\) prior, 2 of the 4000 simulated counts are: that prior and the data disagree, and the analyst should rethink the prior before trusting a posterior built on it.

Definition 20 (Posterior predictive check) A posterior predictive check compares a test quantity \(T(\mathord{\smash[b]{\underset{\raise.3ex\hbox{$\scriptstyle\sim$}}{y}}\vphantom{y}})\) of the observed data with the distribution of \(T(\mathord{\smash[b]{\underset{\raise.3ex\hbox{$\scriptstyle\sim$}}{Y}}\vphantom{Y}}^{\mathrm{rep}})\), where \(\mathord{\smash[b]{\underset{\raise.3ex\hbox{$\scriptstyle\sim$}}{Y}}\vphantom{Y}}^{\mathrm{rep}}\) is a replicated data set drawn from the posterior predictive distribution. If the model fits, replicated data should look like the observed data, so a systematic difference points to a way the model fails [16, Sec. 6.3], pp. 143-145.

Example 24 (Does one smoking probability fit every group?) We check the Beta-Bernoulli model with the race-spread test quantity \(T_2\) of Example 22, on two data sets:

  • Simulated data. We draw 189 Bernoulli observations with the same true \(\pi= 0.3\) for every mother, and attach the race labels of the birthwt mothers. The model is true for these data.
  • Real data. The smoking indicators of the birthwt mothers.

For each data set, we draw \(\pi\) from its posterior under the uniform prior, draw a replicated data set \(\mathord{\smash[b]{\underset{\raise.3ex\hbox{$\scriptstyle\sim$}}{Y}}\vphantom{Y}}^{\mathrm{rep}}\) of the same size given that \(\pi\), and compute \(T_2(\mathord{\smash[b]{\underset{\raise.3ex\hbox{$\scriptstyle\sim$}}{Y}}\vphantom{Y}}^{\mathrm{rep}})\), 4000 times.

set.seed(4)
check_data <- list(
  simulated = stats::rbinom(n_mothers, size = 1, prob = sim_truth),
  `real (birthwt)` = smoke_y
)
ppc_draws <- do.call(
  rbind,
  lapply(names(check_data), \(data_name) {
    y <- check_data[[data_name]]
    ab <- beta_posterior(y)
    prob_draws <- stats::rbeta(4000, ab[["a"]], ab[["b"]])
    data.frame(
      data_set = data_name,
      t_rep = vapply(
        prob_draws,
        \(p) t_spread(stats::rbinom(n_mothers, size = 1, prob = p)),
        numeric(1)
      ),
      t_obs = t_spread(y)
    )
  })
)
ppc_draws$data_set <- factor(ppc_draws$data_set, levels = names(check_data))
ppc_obs <- unique(ppc_draws[c("data_set", "t_obs")])
ppc_obs
import numpy as np
import pandas as pd

birthwt = pd.read_csv("data/birthwt.csv")
race = birthwt["race"].to_numpy()
smoke_y = birthwt["smoke"].to_numpy()
n_mothers = len(smoke_y)
sim_truth = 0.3


def t_spread(y):
    group_means = pd.Series(y).groupby(race).mean()
    return group_means.max() - group_means.min()


rng = np.random.default_rng(4)
check_data = {
    "simulated": rng.binomial(1, sim_truth, size=n_mothers),
    "real (birthwt)": smoke_y,
}
ppc_draws = {}
for name, y in check_data.items():
    post_a = 1 + y.sum()
    post_b = 1 + len(y) - y.sum()
    prob_draws = rng.beta(post_a, post_b, size=4000)
    t_rep = np.array([t_spread(rng.binomial(1, p, size=n_mothers))
                      for p in prob_draws])
    ppc_draws[name] = (t_rep, t_spread(y))

{name: t_obs for name, (t_rep, t_obs) in ppc_draws.items()}
#> {'simulated': np.float64(0.13168532338308458), 'real (birthwt)': np.float64(0.36256218905472637)}

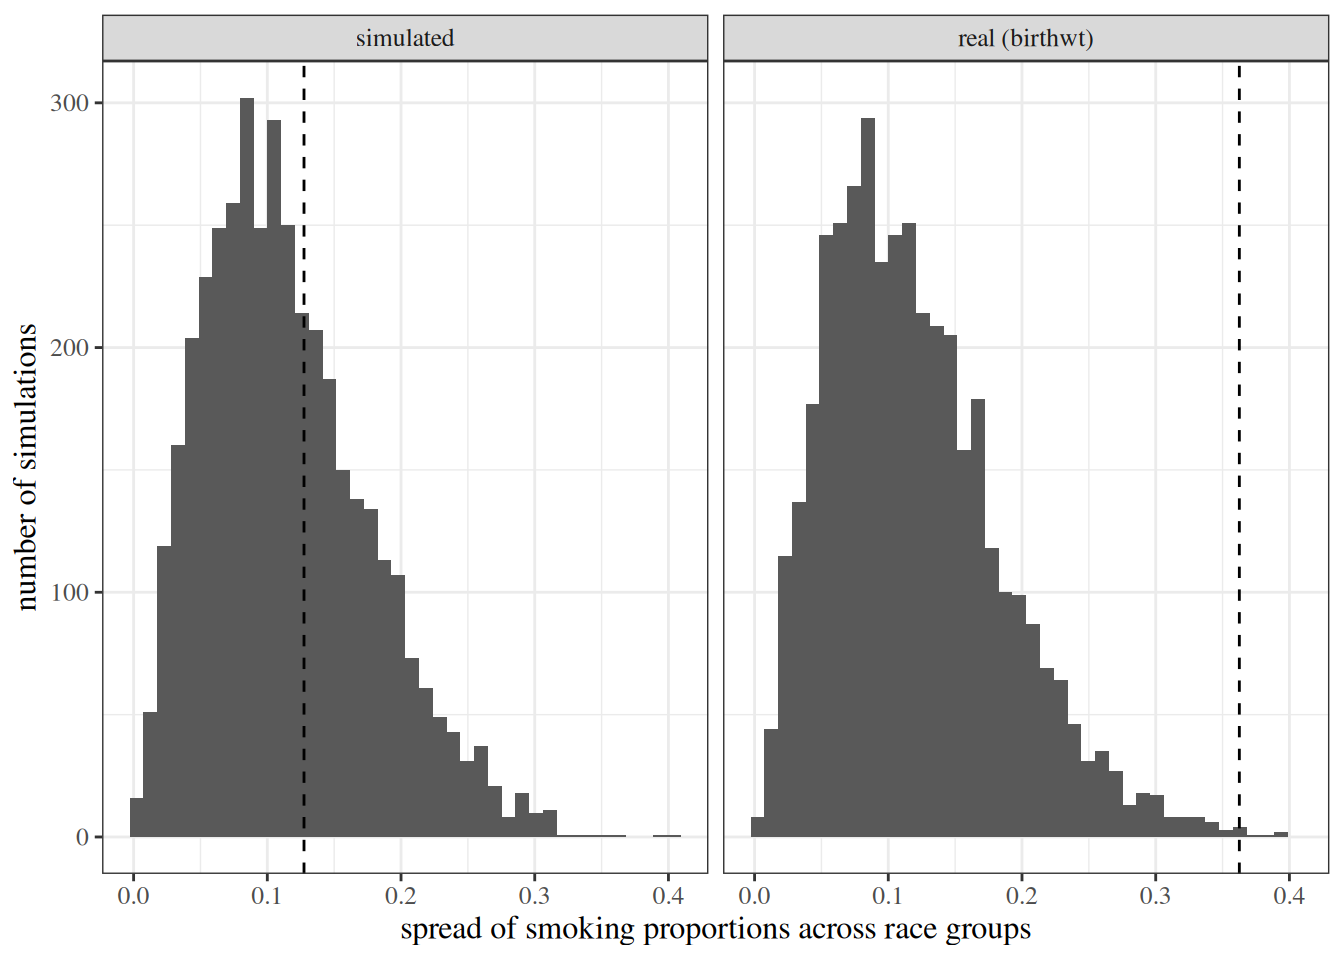
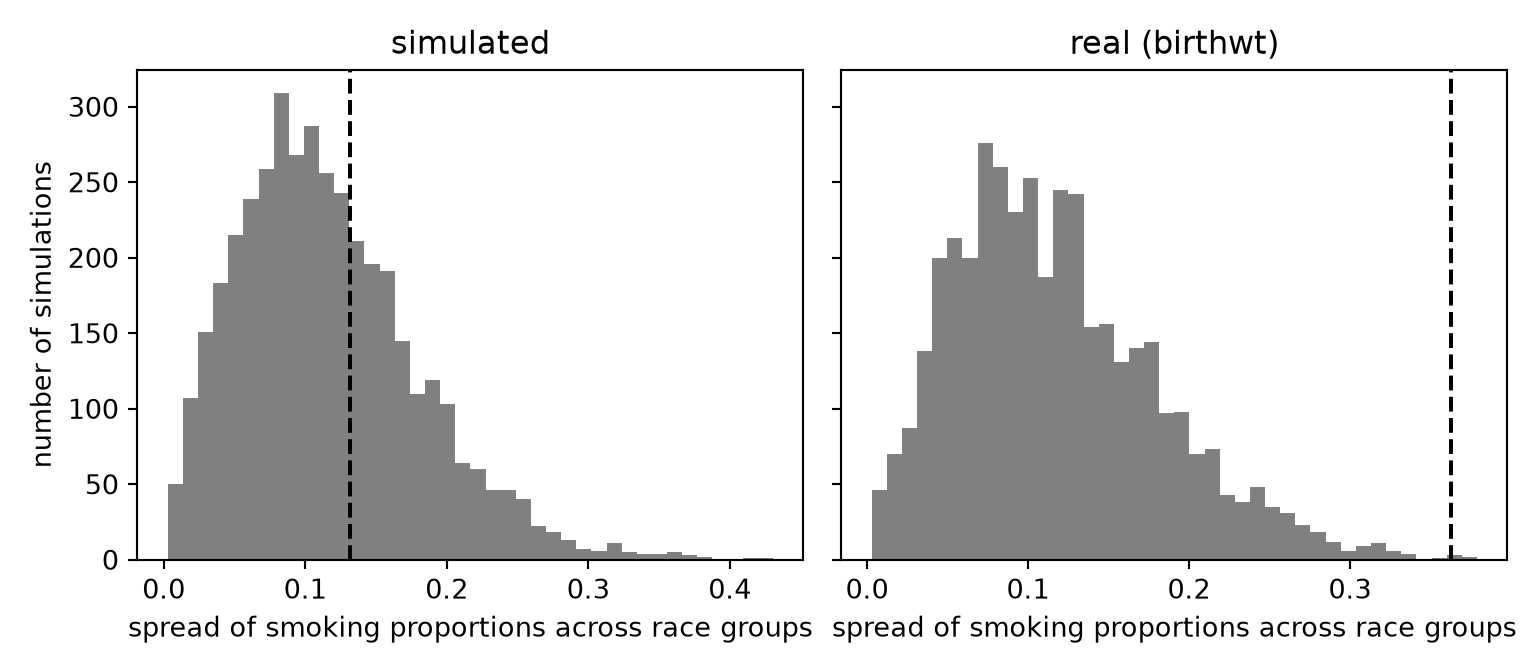
Figure 6 compares the replicated and observed values of \(T_2\).

[Code]
ggplot2::ggplot(ppc_draws, ggplot2::aes(t_rep)) +
  ggplot2::geom_histogram(bins = 40) +
  ggplot2::geom_vline(
    data = ppc_obs,
    ggplot2::aes(xintercept = t_obs),
    linetype = "dashed"
  ) +
  ggplot2::facet_wrap(~data_set) +
  ggplot2::labs(
    x = "spread of smoking proportions across race groups",
    y = "number of simulations"
  )
Show Python code
import matplotlib.pyplot as plt

fig, axes = plt.subplots(1, 2, figsize=(8, 3.5), sharey=True)
for ax, (name, (t_rep, t_obs)) in zip(axes, ppc_draws.items()):
    ax.hist(t_rep, bins=40, color="grey")
    ax.axvline(t_obs, color="black", linestyle="--")
    ax.set_title(name)
    ax.set_xlabel("spread of smoking proportions across race groups")
axes[0].set_ylabel("number of simulations")
plt.tight_layout()
plt.show()
Figure 6: Posterior predictive distributions of \(T_2\), the spread of the smoking proportions across the three race groups, from 4000 replicated data sets under the Beta-Bernoulli model with a uniform prior. The dashed lines are the observed values. Left: 189 simulated observations with the same true \(\pi= 0.3\) for every mother. Right: the birthwt data.

For the simulated data, the observed spread looks like the replicated spreads, as it should, because the model generated those data. For the real data, the observed spread is larger than almost every replicated spread: the smoking proportion really does differ by race in these data, and a model with one \(\pi\) for everyone cannot reproduce that.

Definition 21 (Posterior predictive p-value) The posterior predictive p-value of a test quantity \(T\) is the posterior probability that a replicated data set gives a value of \(T\) at least as large as the observed data do:

\[ p_B = {\Pr\mathopen{}\left(T(\mathord{\smash[b]{\underset{\raise.3ex\hbox{$\scriptstyle\sim$}}{Y}}\vphantom{Y}}^{\mathrm{rep}}) \ge T(\mathord{\smash[b]{\underset{\raise.3ex\hbox{$\scriptstyle\sim$}}{y}}\vphantom{y}}) \mid \mathord{\smash[b]{\underset{\raise.3ex\hbox{$\scriptstyle\sim$}}{y}}\vphantom{y}}\right)\mathclose{}}, \]

where the probability is over \(\theta\) drawn from its posterior and \(\mathord{\smash[b]{\underset{\raise.3ex\hbox{$\scriptstyle\sim$}}{Y}}\vphantom{Y}}^{\mathrm{rep}}\) drawn from the model given \(\theta\) [16, Sec. 6.3], p. 146.

Example 25 (Posterior predictive p-values for the race spread) From the simulations of Example 24:

ppp_values <- tapply(
  ppc_draws$t_rep >= ppc_draws$t_obs,
  ppc_draws$data_set,
  mean
)
ppp_values
#>      simulated real (birthwt) 
#>        0.36725        0.00150
{name: (t_rep >= t_obs).mean() for name, (t_rep, t_obs) in ppc_draws.items()}
#> {'simulated': np.float64(0.3545), 'real (birthwt)': np.float64(0.00125)}

R and Python draw different random numbers, so their p-values differ a little; the text uses the R results. For the simulated data, \(p_B\) is 0.367, so the model passes this check. For the real data, \(p_B\) is 0.002, so the model fails it. The next step would be a model that lets the smoking probability depend on race, such as the Bayesian logistic regression fitted on the companion page.

Remark 7 (Estimating and interpreting the posterior predictive p-value). With simulations from a posterior predictive check, \(p_B\) is estimated by the proportion of replicated values at least as large as the observed value. A value near 0 or 1 means the observed data are unusual under the model.

5 Distributions and hierarchies

Definition 22 (Hierarchical model (multilevel model)) A hierarchical model, also called a multilevel model, is a model in which the data depend on group-level parameters, and the group-level parameters are themselves random, with a distribution that depends on further unknown parameters [1, Ch. 12], p. 281.

Source: Wikipedia contributors [19].

Remark 8 (A hierarchical model is a model structure). A hierarchical model is a model structure, not an inference method: it can be fit by maximum likelihood or by Bayesian inference. Bayesian inference also gives the further unknown parameters a prior (a hyperprior).

Definition 23 (Hyperparameter) In a hierarchical model, a hyperparameter is a parameter of the distribution of the group-level parameters.

Source: Wikipedia contributors [20].

Definition 24 (Hyperprior) In Bayesian inference for a hierarchical model, the hyperprior is the prior distribution of the hyperparameters.

Example 26 (A two-level Gaussian model) Observations \(Y_{ij}\) come from groups \(j = 1, \ldots, J\), and each group has its own mean \(\theta_j\). A two-level model specifies

\[ \begin{aligned} Y_{ij} \mid \theta_j &\sim {\operatorname{N}\mathopen{}\left(\theta_j,\, \sigma^2\right)\mathclose{}} && \text{(data given group means)}\\ \theta_j \mid \mu, \tau&\sim {\operatorname{N}\mathopen{}\left(\mu,\, \tau^2\right)\mathclose{}} && \text{(group means given hyperparameters)}. \end{aligned} \]

The group means \(\theta_j\) are the group-level parameters, and \(\mu\) and \(\tau\) are the hyperparameters. To fit this model by Bayesian inference, we add a hyperprior for \((\mu, \tau)\) and a prior for the within-group standard deviation \(\sigma\).

The middle level lets the groups borrow strength from one another: the posterior for each \(\theta_j\) is pulled toward the overall mean \(\mu\), by an amount that depends on the between-group standard deviation \(\tau\), which the data themselves inform [1, Ch. 12], p. 281. This random-effects model structure is the one fit by maximum likelihood in [1, Ch. 11] and in an introduction to multilevel models. The Bayesian inference method differs only in placing a hyperprior on \(\mu\) and \(\tau\) and returning a full posterior for them, rather than point estimates of the variance components. For a video introduction, see Richard McElreath’s lecture Multilevel Models (Statistical Rethinking 2026, Lecture B01).

6 Further reading

The following resources cover Bayesian inference in more depth.

6.0.1 UC Davis courses

  • STA 015C: “Introduction to Statistical Data Science III”
  • STA 035C: “Statistical Data Science III”
  • STA 145: “Bayesian Statistical Inference”
  • ECL 234: “Bayesian Models - A Statistical Primer”
  • PLS 207: “Applied Statistical Modeling for the Environmental Sciences”
  • PSC 205H: “Applied Bayesian Statistics for Social Scientists”
  • POL 280: “Bayesian Methods: for Social & Behavioral Sciences”
  • BAX 442: “Advanced Statistics”

6.0.2 Books

  • Ross [21], a free online textbook
  • Aragon [22], on population health thinking with Bayesian networks
  • McElreath [17], which ECL 234 uses; its author was formerly a UC Davis professor, and has published video lectures, most recently the 2026 course, and course materials; the Data Science Learning Community’s book club recorded its discussion of the first twelve chapters
  • Korner-Nievergelt and Korner-Nievergelt [23]
  • Cowles [24]
  • Kéry et al. [25]
  • Hobbs and Hooten [26], which has been used in PLS 207

References

[1]
A. J. Dobson and A. G. Barnett, An introduction to generalized linear models, 4th ed. CRC press, 2018. doi: 10.1201/9781315182780.
[2]
Wikipedia contributors, “Frequentist inference — Wikipedia, the free encyclopedia.” 2026. Available: https://en.wikipedia.org/wiki/Frequentist_inference
[3]
Wikipedia contributors, “Bayesian statistics — Wikipedia, the free encyclopedia.” 2026. Available: https://en.wikipedia.org/wiki/Bayesian_statistics
[4]
Wikipedia contributors, “Prior probability — Wikipedia, the free encyclopedia.” 2026. Available: https://en.wikipedia.org/wiki/Prior_probability
[5]
Wikipedia contributors, “Posterior probability — Wikipedia, the free encyclopedia.” 2026. Available: https://en.wikipedia.org/wiki/Posterior_probability
[6]
Wikipedia contributors, “Marginal likelihood — Wikipedia, the free encyclopedia.” 2026. Available: https://en.wikipedia.org/wiki/Marginal_likelihood
[7]
Wikipedia contributors, “Bayes’ theorem — Wikipedia, the free encyclopedia.” 2026. Available: https://en.wikipedia.org/wiki/Bayes%27_theorem
[8]
Wikipedia contributors, “Maximum a posteriori estimation — Wikipedia, the free encyclopedia.” 2026. Available: https://en.wikipedia.org/wiki/Maximum_a_posteriori_estimation
[9]
Wikipedia contributors, “Credible interval — Wikipedia, the free encyclopedia.” 2026. Available: https://en.wikipedia.org/wiki/Credible_interval
[10]
G. Casella and R. Berger, Statistical inference, 2nd ed. Cengage Learning, 2002. Available: https://www.cengage.com/c/statistical-inference-2e-casella-berger/9780534243128/
[11]
R. V. Hogg, E. A. Tanis, and D. L. Zimmerman, Probability and statistical inference, Tenth edition. Boston: Pearson, 2019.
[12]
J. A. Rice, Mathematical statistics and data analysis, 3rd ed. Belmont, CA: Cengage Learning, 2007.
[13]
Wikipedia contributors, “Conjugate prior — Wikipedia, the free encyclopedia.” 2026. Available: https://en.wikipedia.org/wiki/Conjugate_prior
[14]
D. W. Hosmer and S. Lemeshow, Applied logistic regression. New York: Wiley, 1989.
[15]
W. N. Venables and B. D. Ripley, Modern applied statistics with S, 4th ed. New York: Springer, 2002. doi: 10.1007/978-0-387-21706-2.
[16]
A. Gelman, J. B. Carlin, H. S. Stern, D. B. Dunson, A. Vehtari, and D. B. Rubin, Bayesian data analysis, 3rd ed. in Chapman & hall/CRC texts in statistical science. Boca Raton, FL: CRC Press, 2013. doi: 10.1201/b16018.
[17]
R. McElreath, Statistical rethinking : A Bayesian course with examples in R and Stan, Second edition. in Chapman & hall/CRC texts in statistical science series. Boca Raton, FL: CRC Press, 2020.
[18]
Wikipedia contributors, “Posterior predictive distribution — Wikipedia, the free encyclopedia.” 2026. Available: https://en.wikipedia.org/wiki/Posterior_predictive_distribution
[19]
Wikipedia contributors, “Bayesian hierarchical modeling — Wikipedia, the free encyclopedia.” 2026. Available: https://en.wikipedia.org/wiki/Bayesian_hierarchical_modeling
[20]
Wikipedia contributors, “Hyperparameter — Wikipedia, the free encyclopedia.” 2026. Available: https://en.wikipedia.org/wiki/Hyperparameter
[21]
K. Ross, An introduction to bayesian reasoning and methods. Online, 2022. Available: https://bookdown.org/kevin_davisross/bayesian-reasoning-and-methods/
[22]
T. J. Aragon, “Population health thinking with Bayesian networks,” 2018, Available: https://escholarship.org/uc/item/8000r5m5
[23]
F. Korner-Nievergelt and F. Korner-Nievergelt, Bayesian data analysis in ecology using linear models with R, BUGS, and Stan, 1st ed. Amsterdam, [Netherlands: Academic Press, 2015.
[24]
M. K. Cowles, Applied bayesian statistics: With R and OpenBUGS examples, vol. 98. in Springer texts in statistics, vol. 98. New York, NY: Springer Nature, 2013. doi: 10.1007/978-1-4614-5696-4.
[25]
Marc. Kéry, Michael. Schaub, and S. R. Beissinger, Bayesian population analysis using WinBUGS : A hierarchical perspective, 1st ed. Boston: Academic Press, 2012. Available: https://shop.elsevier.com/books/bayesian-population-analysis-using-winbugs/kery/978-0-12-387020-9
[26]
N. T. Hobbs and M. B. Hooten, Bayesian models: A statistical primer for ecologists, STU - Student edition. Princeton: Princeton University Press, 2015.