Functions from these packages will be used throughout this document:
[R code]
library(conflicted) # check for conflicting function definitions# printr is not loaded here: it inserts help-file output into markdown outputlibrary(rmarkdown) # Convert R Markdown documents into a variety of formats.library(pander) # format tables for markdownlibrary(ggplot2) # graphicslibrary(ggfortify) # help with graphicslibrary(dplyr) # manipulate datalibrary(tibble) # `tibble`s extend `data.frame`slibrary(magrittr) # `%>%` and other additional piping toolslibrary(haven) # import Stata fileslibrary(knitr) # format R output for markdownlibrary(tidyr) # Tools to help to create tidy datalibrary(plotly) # interactive graphicslibrary(dobson) # datasets from Dobson and Barnett 2018library(parameters) # format model output tables for markdownlibrary(haven) # import Stata fileslibrary(latex2exp) # use LaTeX in R code (for figures and tables)library(fs) # filesystem path manipulationslibrary(survival) # survival analysislibrary(survminer) # survival analysis graphicslibrary(KMsurv) # datasets from Klein and Moeschbergerlibrary(parameters) # format model output tables forlibrary(webshot2) # convert interactive content to static for pdflibrary(forcats) # functions for categorical variables ("factors")library(stringr) # functions for dealing with stringslibrary(lubridate) # functions for dealing with dates and times# Summarizes key information about statistical objects in tidy tibbleslibrary(broom)# Provides suite of functions to work with regression model# `broom::tidy()` tibbleslibrary(broom.helpers)
Here are some R settings I use in this document:
[R code]
rm(list =ls()) # delete any data that's already loaded into Rconflicts_prefer(dplyr::filter)ggplot2::theme_set( ggplot2::theme_bw() +# ggplot2::labs(col = "") + ggplot2::theme(legend.position ="bottom",text = ggplot2::element_text(size =12, family ="serif") ))knitr::opts_chunk$set(message =FALSE)options(digits =6)panderOptions("big.mark", ",")pander::panderOptions("table.emphasize.rownames", FALSE)pander::panderOptions("table.split.table", Inf)# use the `filter()` function from dplyr() by defaultconflicts_prefer(dplyr::filter)legend_text_size <-9run_graphs <-TRUE
1 Parametric Survival Models
Video lecture
David Rocke’s Epi 204 lecture Parametric Survival Regression (slides) covers exponential and Weibull models, accelerated failure time models, the survreg() function, and complementary log-log plots, using the anderson data [1].
1.1 Exponential Distribution
The exponential distribution is the baseline parametric model in survival analysis. It assumes a constant hazard rate\(\lambda > 0\) over time. This constant hazard implies that the event probability in any short interval depends only on the interval duration and not on elapsed time (the memoryless property).
\[
\begin{aligned}
\operatorname{f}(t) &\stackrel{\text{def}}{=}\lambda \text{e}^{-\lambda t} && \text{(probability density function definition for $t \ge 0$)} \\
{\operatorname{log}\mathopen{}\left\{\operatorname{f}(t)\right\}\mathclose{}} &= {\operatorname{log}\mathopen{}\left\{\lambda\right\}\mathclose{}} - \lambda t && \text{(taking natural logarithm of density)} \\
\operatorname{F}(t) &\stackrel{\text{def}}{=}\int_{0}^{t} \operatorname{f}(u) du && \text{(cumulative distribution function definition)} \\
&= \int_{0}^{t} \lambda \text{e}^{-\lambda u} du && \text{(substituting probability density function)} \\
&= \mathopen{}\left[ -\text{e}^{-\lambda u} \right]\mathclose{}_{0}^{t} && \text{(evaluating antiderivative)} \\
&= 1 - \text{e}^{-\lambda t} && \text{(evaluating limits of integration)} \\
\operatorname{S}(t) &\stackrel{\text{def}}{=}1 - \operatorname{F}(t) && \text{(survival function definition)} \\
&= 1 - \mathopen{}\left(1 - \text{e}^{-\lambda t}\right)\mathclose{} && \text{(substituting cumulative distribution function)} \\
&= \text{e}^{-\lambda t} && \text{(simplifying terms)} \\
{\Lambda}(t) &\stackrel{\text{def}}{=}-{\operatorname{log}\mathopen{}\left\{\operatorname{S}(t)\right\}\mathclose{}} && \text{(cumulative hazard function definition)} \\
&= -{\operatorname{log}\mathopen{}\left\{\text{e}^{-\lambda t}\right\}\mathclose{}} && \text{(substituting survival function)} \\
&= \lambda t && \text{(simplifying logarithm of exponential)} \\
{\lambda}(t) &\stackrel{\text{def}}{=}\frac{\partial}{\partial t} {\Lambda}(t) && \text{(hazard function definition as derivative of cumulative hazard)} \\
&= \frac{\partial}{\partial t} (\lambda t) && \text{(substituting cumulative hazard)} \\
&= \lambda && \text{(differentiating linear term)} \\
{\mathbb{E}\mathopen{}\left[T\right]\mathclose{}} &\stackrel{\text{def}}{=}\int_{0}^{\infty} \operatorname{S}(t) dt && \text{(expectation formula for non-negative continuous random variable)} \\
&= \int_{0}^{\infty} \text{e}^{-\lambda t} dt && \text{(substituting survival function)} \\
&= \mathopen{}\left[ -\frac{1}{\lambda} \text{e}^{-\lambda t} \right]\mathclose{}_{0}^{\infty} && \text{(evaluating antiderivative)} \\
&= \lambda^{-1} && \text{(evaluating limits of integration)}
\end{aligned}
\]
Theorem 1 (The exponential distribution is memoryless) If \(T\) has an exponential distribution with rate \(\lambda > 0\), then for all \(s \ge 0\) and \(t \ge 0\),
\[
\mathbb{P}(T > s + t \mid T > s) = \mathbb{P}(T > t).
\]
Proof. \[
\begin{aligned}
\mathbb{P}(T > s + t \mid T > s)
&= \frac{\mathbb{P}(T > s + t,\ T > s)}{\mathbb{P}(T > s)}
&& \text{(definition of conditional probability)} \\
&= \frac{\mathbb{P}(T > s + t)}{\mathbb{P}(T > s)}
&& \text{(the event } T > s + t \text{ implies } T > s \text{)} \\
&= \frac{\operatorname{S}(s + t)}{\operatorname{S}(s)}
&& \text{(definition of the survival function)} \\
&= \frac{\text{e}^{-\lambda (s + t)}}{\text{e}^{-\lambda s}}
&& \text{(exponential survival function)} \\
&= \text{e}^{-\lambda (s + t) + \lambda s}
&& \text{(quotient rule for exponentials)} \\
&= \text{e}^{-\lambda t}
&& \text{(cancel } \lambda s \text{)} \\
&= \mathbb{P}(T > t)
&& \text{(exponential survival function)}
\end{aligned}
\]
Example 1 (Remaining survival after 10 event-free weeks) Let \(T\) be exponential with rate \(\lambda = 0.1\) events per week. For a subject who has been event-free for \(s = 10\) weeks, the probability of lasting at least \(t = 5\) more weeks is:
This value equals \(\mathbb{P}(T > 5) = \text{e}^{-0.1 \cdot 5} = \text{e}^{-0.5}\), the probability that a new subject lasts 5 weeks: the 10 weeks already survived do not change the outlook.
Example 2 (A Weibull distribution with shape 2 is not memoryless (counterexample)) Now let \(T\) be Weibull with \(\lambda = 0.1\) and \(p = 2\), so \(\operatorname{S}(t) = \text{e}^{-(0.1 t)^2}\) and the hazard increases over time. Then:
whereas \(\mathbb{P}(T > 5) = \text{e}^{-(0.5)^2} = \text{e}^{-0.25} \approx 0.7788\). A subject who has already lasted 10 weeks is less likely to last 5 more weeks than a new subject is, because the hazard has risen in the meantime.
1.2 Weibull Distribution
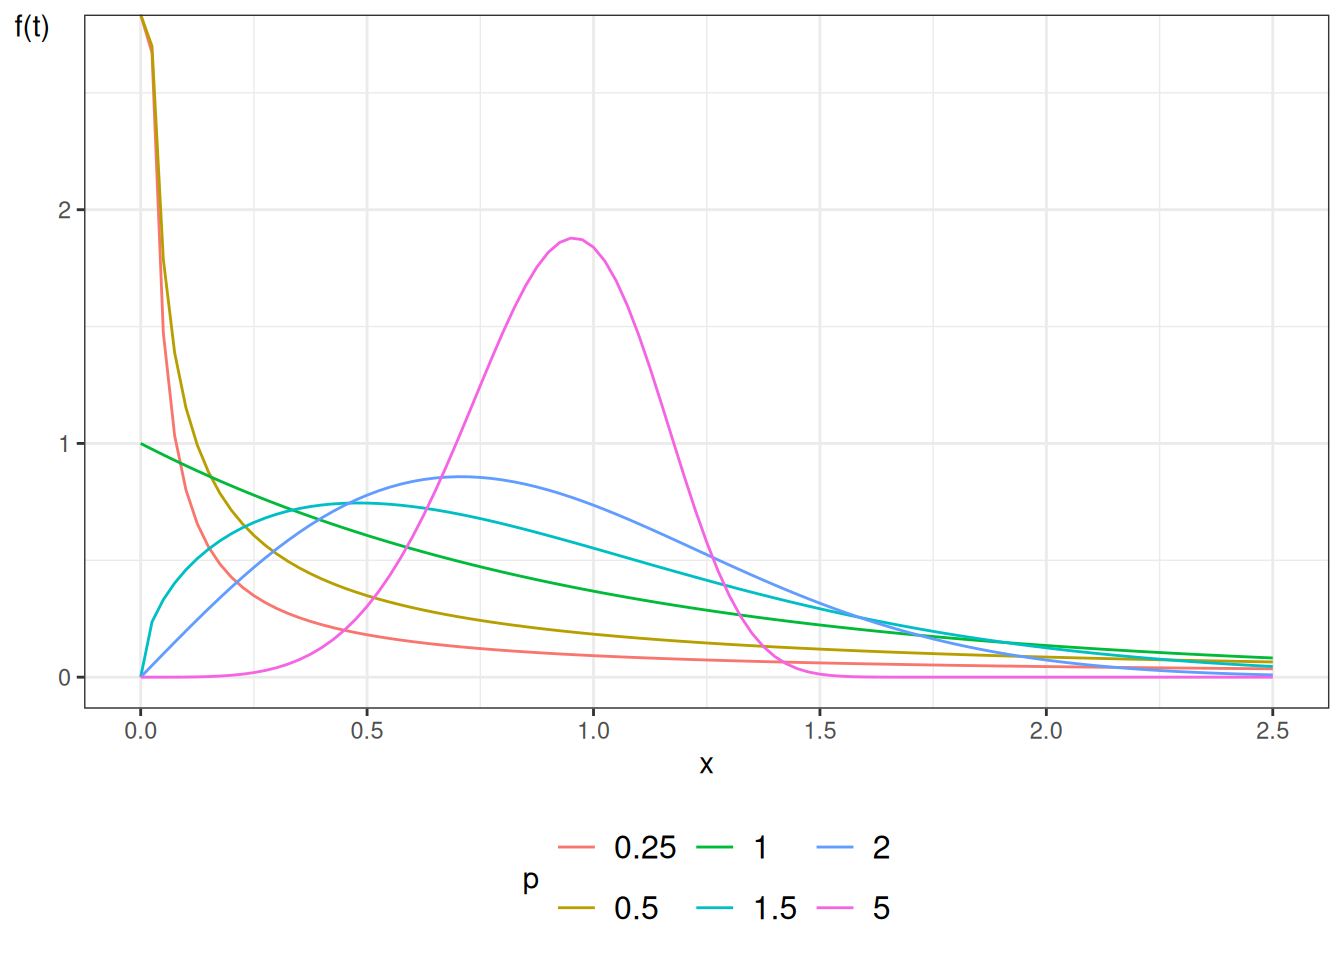
The Weibull distribution generalizes the exponential distribution by introducing a shape parameter \(p > 0\) alongside the scale parameter \(\lambda > 0\)[2]. This flexibility allows the hazard rate to change monotonically over time, accommodating situations where risk increases or decreases as time elapses.
Using the parameterization of Kalbfleisch and Prentice [2]:
\[
\begin{aligned}
\operatorname{f}(t) &\stackrel{\text{def}}{=}\lambda p (\lambda t)^{p-1} \text{e}^{-(\lambda t)^p} && \text{(probability density function for $t \ge 0$)} \\
\operatorname{F}(t) &\stackrel{\text{def}}{=}\int_{0}^{t} \operatorname{f}(u) du && \text{(cumulative distribution function definition)} \\
&= \int_{0}^{t} \lambda p (\lambda u)^{p-1} \text{e}^{-(\lambda u)^p} du && \text{(substituting density function)} \\
&= \mathopen{}\left[ -\text{e}^{-(\lambda u)^p} \right]\mathclose{}_{0}^{t} && \text{(evaluating antiderivative via substitution $w = (\lambda u)^p$)} \\
&= 1 - \text{e}^{-(\lambda t)^p} && \text{(evaluating limits of integration)} \\
\operatorname{S}(t) &\stackrel{\text{def}}{=}1 - \operatorname{F}(t) && \text{(survival function definition)} \\
&= 1 - \mathopen{}\left(1 - \text{e}^{-(\lambda t)^p}\right)\mathclose{} && \text{(substituting cumulative distribution function)} \\
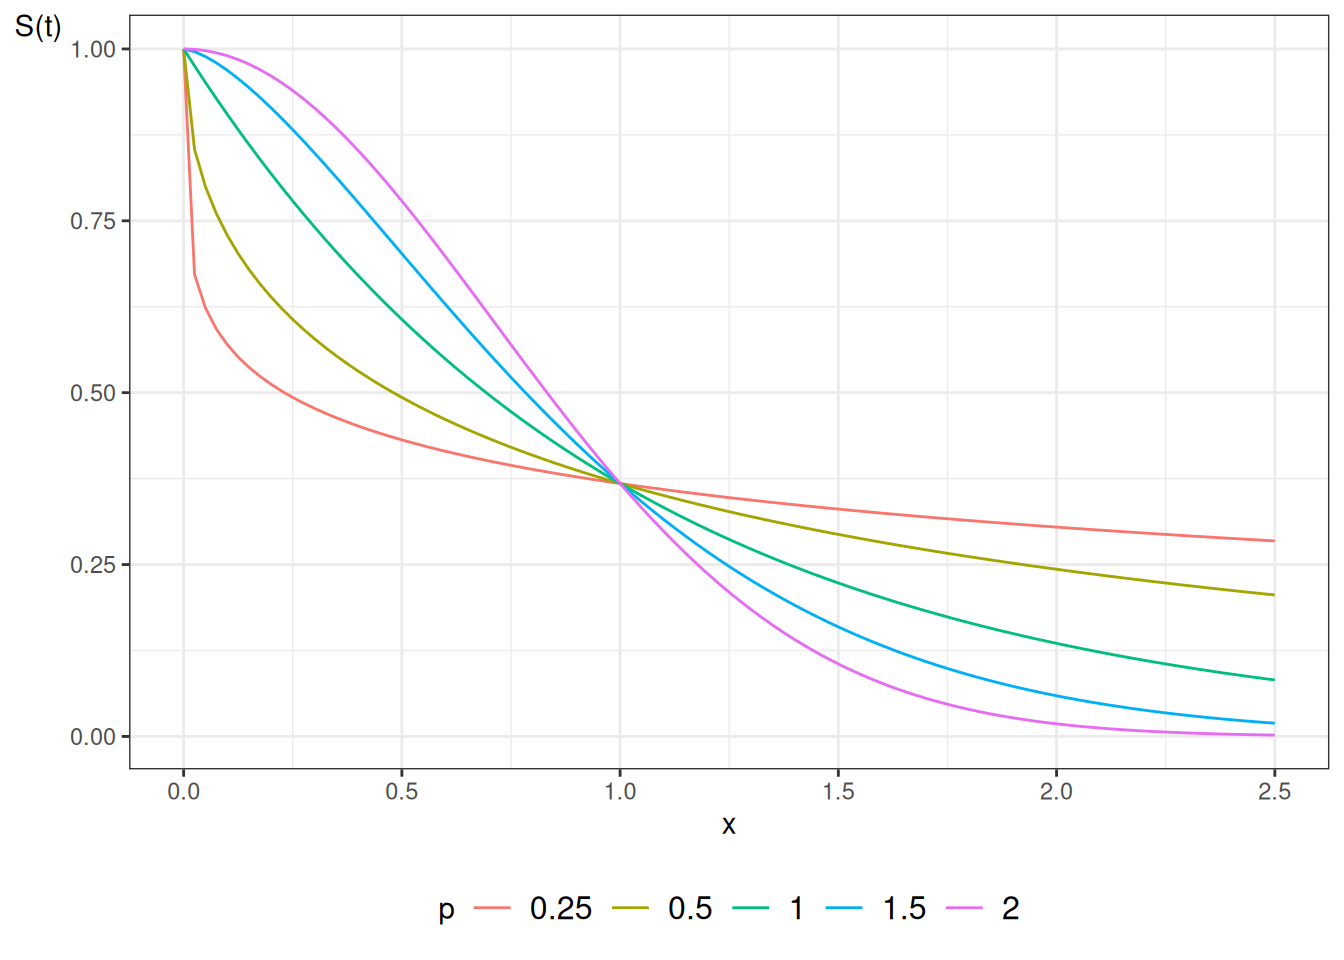
&= \text{e}^{-(\lambda t)^p} && \text{(simplifying terms)} \\
{\Lambda}(t) &\stackrel{\text{def}}{=}-{\operatorname{log}\mathopen{}\left\{\operatorname{S}(t)\right\}\mathclose{}} && \text{(cumulative hazard function definition)} \\
&= -{\operatorname{log}\mathopen{}\left\{\text{e}^{-(\lambda t)^p}\right\}\mathclose{}} && \text{(substituting survival function)} \\
&= (\lambda t)^p && \text{(simplifying logarithm of exponential)} \\
{\operatorname{log}\mathopen{}\left\{{\Lambda}(t)\right\}\mathclose{}} &= {\operatorname{log}\mathopen{}\left\{(\lambda t)^p\right\}\mathclose{}} && \text{(taking natural logarithm of cumulative hazard)} \\
&= p {\operatorname{log}\mathopen{}\left\{\lambda t\right\}\mathclose{}} && \text{(applying exponent rule for logarithms)} \\
&= p {\operatorname{log}\mathopen{}\left\{\lambda\right\}\mathclose{}} + p {\operatorname{log}\mathopen{}\left\{t\right\}\mathclose{}} && \text{(applying product rule for logarithms)} \\
{\lambda}(t) &\stackrel{\text{def}}{=}\frac{\partial}{\partial t} {\Lambda}(t) && \text{(hazard function definition)} \\
&= \frac{\partial}{\partial t} \mathopen{}\left( (\lambda t)^p \right)\mathclose{} && \text{(substituting cumulative hazard)} \\
&= p (\lambda t)^{p-1} \cdot \lambda && \text{(applying power and chain rules of differentiation)} \\
&= \lambda p (\lambda t)^{p-1} && \text{(rearranging factors)} \\
{\mathbb{E}\mathopen{}\left[T\right]\mathclose{}} &\stackrel{\text{def}}{=}\int_{0}^{\infty} \operatorname{S}(t) dt && \text{(expectation formula for non-negative random variable)} \\
&= \int_{0}^{\infty} \text{e}^{-(\lambda t)^p} dt && \text{(substituting survival function)} \\
&= \frac{1}{\lambda p} \int_{0}^{\infty} u^{\frac{1}{p}-1} \text{e}^{-u} du && \text{(substituting $u = (\lambda t)^p \implies t = \lambda^{-1} u^{1/p}$)} \\
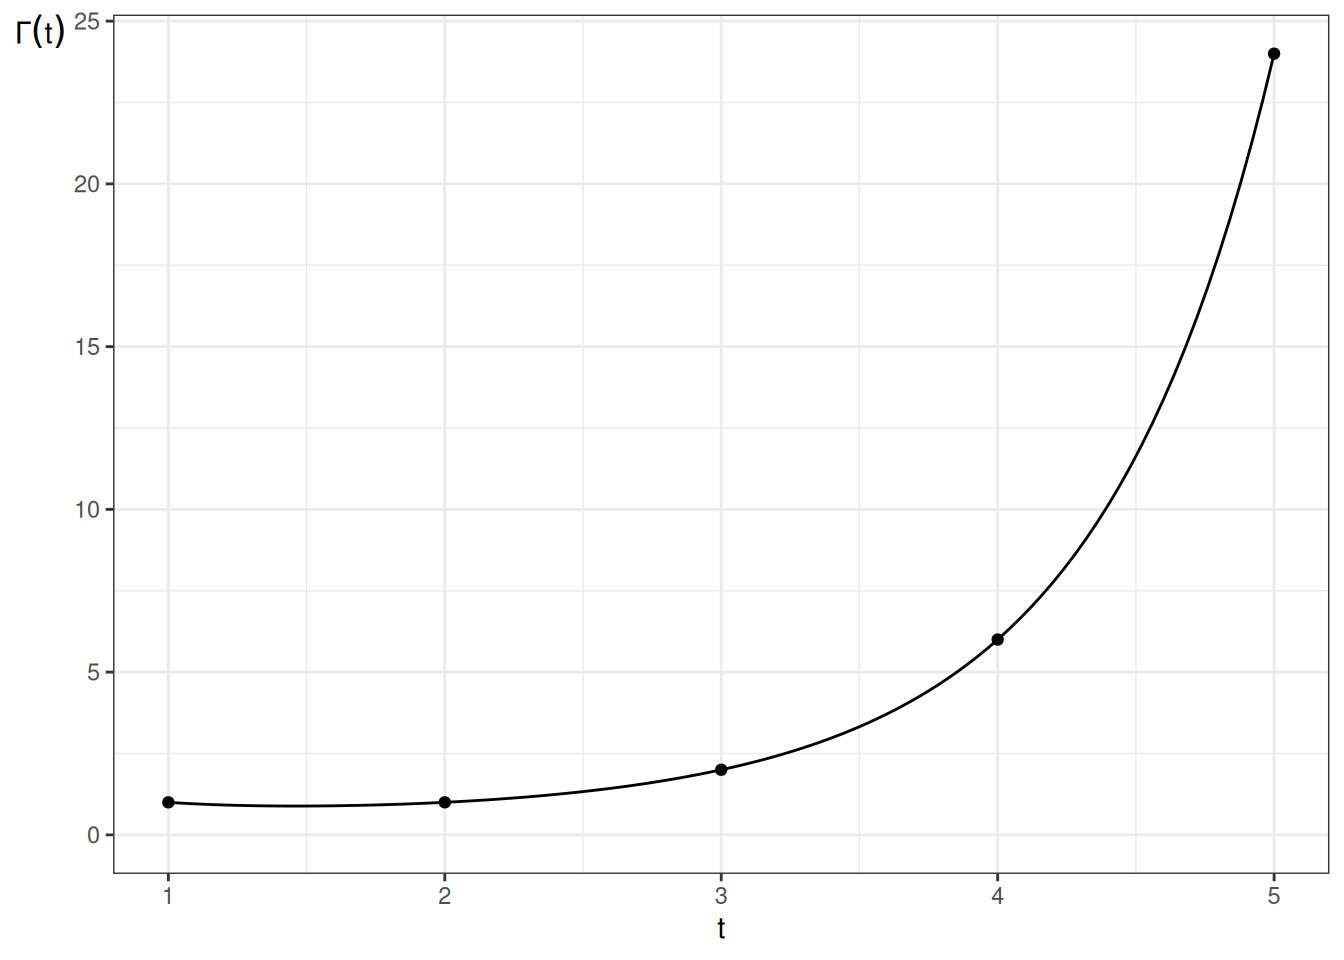
&= \lambda^{-1} \cdot \Gamma\mathopen{}\left(1 + \frac{1}{p}\right)\mathclose{} && \text{(applying definition of Gamma function $\Gamma(z)$)}
\end{aligned}
\]
Theorem 2 (Properties of Weibull hazard functions) If \(T\) has a Weibull distribution, then:
When \(p=1\), the Weibull distribution simplifies to the exponential distribution.
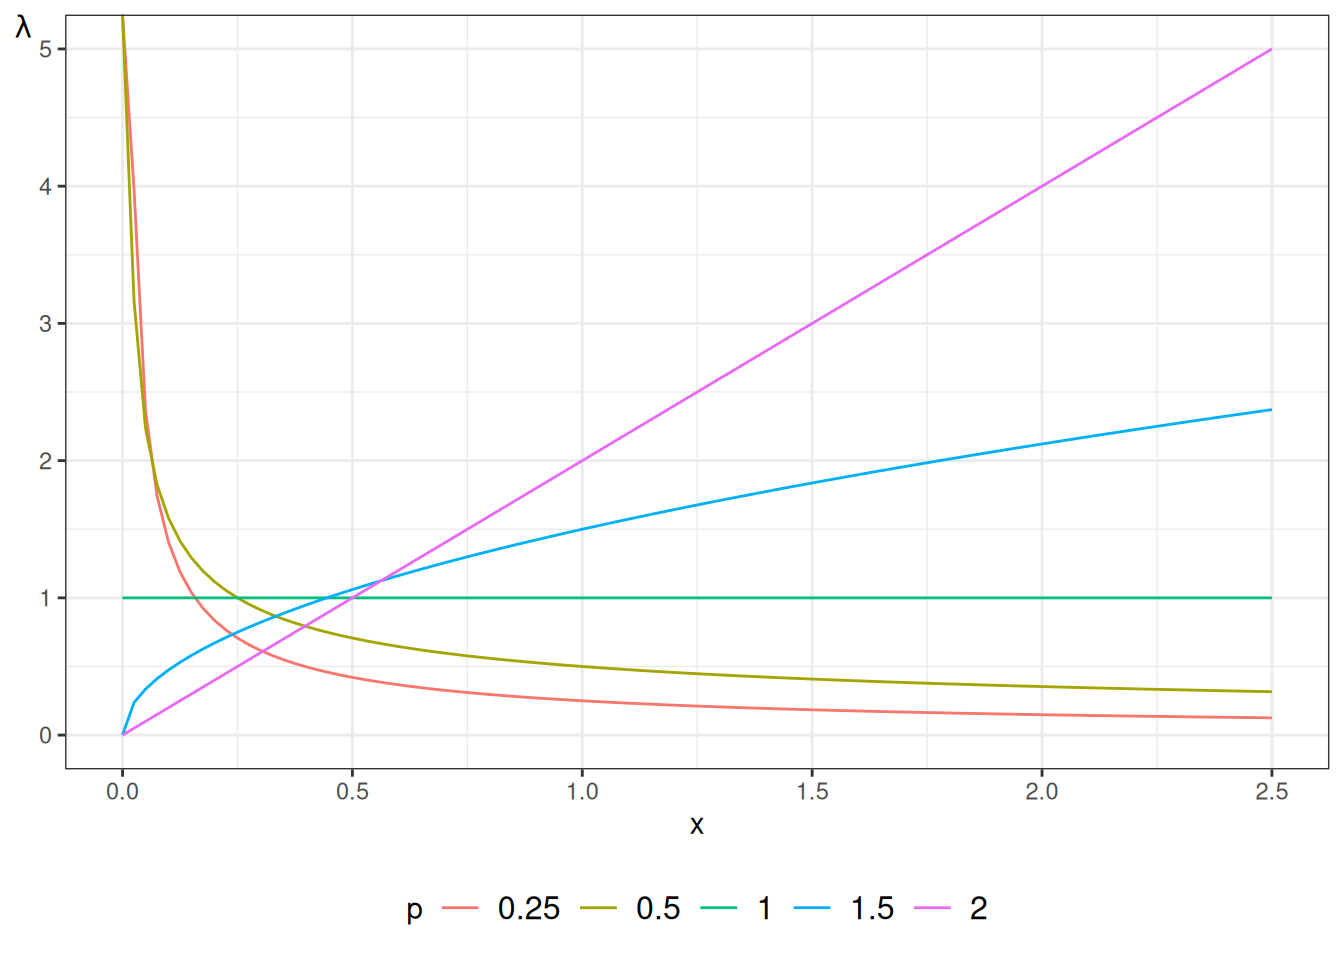
When \(p > 1\), the hazard is strictly increasing: \({\lambda}'(t) > 0\).
When \(p < 1\), the hazard is strictly decreasing: \({\lambda}'(t) < 0\).
\(\log{{\Lambda}(t)}\) is a straight line relative to \(\log{t}\): \(\log{{\Lambda}(t)} = p \log{\lambda} + p \log{t}\).
Proof. We prove each property of the Weibull hazard function \({\lambda}(t) = \lambda p (\lambda t)^{p-1}\):
Simplification to Exponential distribution when \(p=1\): Setting \(p=1\) in the Weibull hazard function yields: \[
\begin{aligned}
{\lambda}(t) &= \lambda (1) (\lambda t)^{1-1} && \text{(substituting $p=1$ into Weibull hazard formula)} \\
&= \lambda \cdot 1 \cdot (\lambda t)^0 && \text{(simplifying exponent $1-1 = 0$)} \\
&= \lambda && \text{(since $(\lambda t)^0 = 1$ for $t > 0$)}
\end{aligned}
\] This constant value is the hazard function of the exponential distribution with parameter \(\lambda\).
Increasing hazard when \(p > 1\): Differentiating \({\lambda}(t) = \lambda^p p t^{p-1}\) with respect to \(t\) gives: \[
\begin{aligned}
{\lambda}'(t) &\stackrel{\text{def}}{=}\frac{\partial}{\partial t} \mathopen{}\left( \lambda^p p t^{p-1} \right)\mathclose{} && \text{(definition of hazard derivative)} \\
&= \lambda^p p (p-1) t^{p-2} && \text{(applying power rule of differentiation)}
\end{aligned}
\] Since \(\lambda > 0\), \(p > 0\), and \(t > 0\), the sign of \({\lambda}'(t)\) depends entirely on the factor \((p-1)\). When \(p > 1\), \((p-1) > 0\), so \({\lambda}'(t) > 0\) for all \(t > 0\), meaning the hazard function is strictly increasing over time.
Decreasing hazard when \(p < 1\): Using the derivative \({\lambda}'(t) = \lambda^p p (p-1) t^{p-2}\): When \(p < 1\), \((p-1) < 0\), so \({\lambda}'(t) < 0\) for all \(t > 0\), meaning the hazard function is strictly decreasing over time.
Linear relationship between \(\log {\Lambda}(t)\) and \(\log t\): Taking the natural logarithm of the cumulative hazard function\({\Lambda}(t) = (\lambda t)^p\): \[
\begin{aligned}
{\operatorname{log}\mathopen{}\left\{{\Lambda}(t)\right\}\mathclose{}} &\stackrel{\text{def}}{=}{\operatorname{log}\mathopen{}\left\{(\lambda t)^p\right\}\mathclose{}} && \text{(substituting Weibull cumulative hazard)} \\
&= p {\operatorname{log}\mathopen{}\left\{\lambda t\right\}\mathclose{}} && \text{(applying logarithm exponent rule $\log(a^b) = b \log a$)} \\
&= p {\operatorname{log}\mathopen{}\left\{\lambda\right\}\mathclose{}} + p {\operatorname{log}\mathopen{}\left\{t\right\}\mathclose{}} && \text{(applying logarithm product rule $\log(ab) = \log a + \log b$)}
\end{aligned}
\] Defining \(y \stackrel{\text{def}}{=}{\operatorname{log}\mathopen{}\left\{{\Lambda}(t)\right\}\mathclose{}}\) and \(x \stackrel{\text{def}}{=}{\operatorname{log}\mathopen{}\left\{t\right\}\mathclose{}}\), this equation takes the linear form \(y = a + b x\) with intercept \(a = p {\operatorname{log}\mathopen{}\left\{\lambda\right\}\mathclose{}}\) and slope \(b = p\).
Example 3 (Evaluating Weibull hazard shapes under different shape parameters) Consider a clinical trial evaluating time to relapse in months following cancer treatment, modeled using a Weibull distribution with scale parameter \(\lambda = 0.1\). We evaluate the hazard rate \({\lambda}(t)\) at months \(t = 1, 6, 12\) under three distinct shape parameters:
Decreasing hazard (\(p = 0.5\)): The hazard rate formula gives: \[
{\lambda}(t) = (0.1)(0.5)(0.1 t)^{-0.5} = \frac{0.05}{\sqrt{0.1 t}}
\]
At \(t = 1\) month: \({\lambda}(1) = \frac{0.05}{\sqrt{0.1}} \approx 0.1581\) events per month.
At \(t = 6\) months: \({\lambda}(6) = \frac{0.05}{\sqrt{0.6}} \approx 0.0645\) events per month.
At \(t = 12\) months: \({\lambda}(12) = \frac{0.05}{\sqrt{1.2}} \approx 0.0456\) events per month. The risk of relapse is highest immediately following treatment and declines over time.
Constant hazard (\(p = 1.0\)): The hazard rate formula reduces to \({\lambda}(t) = \lambda = 0.1000\) events per month for all \(t\). The risk of relapse remains constant regardless of time elapsed.
Increasing hazard (\(p = 2.0\)): The hazard rate formula gives: \[
{\lambda}(t) = (0.1)(2.0)(0.1 t)^{1.0} = 0.02 t
\]
At \(t = 1\) month: \({\lambda}(1) = 0.02(1) = 0.0200\) events per month.
At \(t = 6\) months: \({\lambda}(6) = 0.02(6) = 0.1200\) events per month.
At \(t = 12\) months: \({\lambda}(12) = 0.02(12) = 0.2400\) events per month. The risk of relapse increases linearly over time.
Figure 2: Survival functions for Weibull distribution
1.3 Exponential Regression
Definition 1 (Exponential regression model) An exponential regression model for an event time \(T\) with predictor vector \(\mathord{\smash[b]{\underset{\raise.3ex\hbox{$\scriptstyle\sim$}}{x}}\vphantom{x}}\) assumes that, given \(\mathord{\smash[b]{\underset{\raise.3ex\hbox{$\scriptstyle\sim$}}{x}}\vphantom{x}}\), \(T\) has an exponential distribution whose hazard rate is the exponentiated linear predictor:
Example 4 (Exponential regression with one binary covariate) Let \(x_1 = 1\) for patients on a standard treatment and \(x_1 = 0\) for patients on a new treatment, and suppose \(\beta_0 = {\operatorname{log}\mathopen{}\left\{0.025\right\}\mathclose{}}\) and \(\beta_1 = {\operatorname{log}\mathopen{}\left\{4\right\}\mathclose{}}\), with time measured in weeks. By Equation 1:
Each group’s mean event time is the reciprocal of its hazard rate, as derived in Section 1.1: \(1/0.025 = 40\) weeks on the new treatment and \(1/0.1 = 10\) weeks on the standard treatment.
Exponential regression models the hazard rate using a log link function. At \(\mathord{\smash[b]{\underset{\raise.3ex\hbox{$\scriptstyle\sim$}}{x}}\vphantom{x}}= \mathord{\smash[b]{\underset{\raise.3ex\hbox{$\scriptstyle\sim$}}{0}}\vphantom{0}}\), Equation 1 gives the baseline hazard rate:
When there are no additional predictors (\(\mathord{\smash[b]{\underset{\raise.3ex\hbox{$\scriptstyle\sim$}}{x}}\vphantom{x}}= \mathord{\smash[b]{\underset{\raise.3ex\hbox{$\scriptstyle\sim$}}{0}}\vphantom{0}}\)), the baseline hazard is constant: \(\lambda = {\operatorname{exp}\mathopen{}\left\{\beta_0\right\}\mathclose{}}\). This model uses a log link as in a generalized linear model for Poisson or rate outcomes. Because the hazard rate does not depend on time \(t\), the hazard ratio comparing two covariate vectors \(\mathord{\smash[b]{\underset{\raise.3ex\hbox{$\scriptstyle\sim$}}{x}}\vphantom{x}}\) and \(\mathord{{\mathord{\smash[b]{\underset{\raise.3ex\hbox{$\scriptstyle\sim$}}{x}}\vphantom{x}}^*}}\) is constant over time:
An alternative modeling framework is the Accelerated Failure Time (AFT) model. Rather than multiplying the hazard rate, covariates accelerate or decelerate the progression of time itself.
Definition 2 (Acceleration factor) For a covariate vector \(\mathord{\smash[b]{\underset{\raise.3ex\hbox{$\scriptstyle\sim$}}{x}}\vphantom{x}}\) and coefficients \(\beta_1, \dots, \beta_p\), let \(\eta(\mathord{\smash[b]{\underset{\raise.3ex\hbox{$\scriptstyle\sim$}}{x}}\vphantom{x}}) \stackrel{\text{def}}{=}\beta_1 x_1 + \dots + \beta_p x_p\), with no intercept. The acceleration factor is
Example 5 (Computing an acceleration factor) Suppose there is one covariate, with coefficient \(\beta_1 = {\operatorname{log}\mathopen{}\left\{2\right\}\mathclose{}}\), and a subject has \(x_1 = 2\). Then:
\[
\begin{aligned}
\theta_{{\lambda}}(\mathord{\smash[b]{\underset{\raise.3ex\hbox{$\scriptstyle\sim$}}{x}}\vphantom{x}})
&= {\operatorname{exp}\mathopen{}\left\{\eta(\mathord{\smash[b]{\underset{\raise.3ex\hbox{$\scriptstyle\sim$}}{x}}\vphantom{x}})\right\}\mathclose{}}
&& \text{(definition of the acceleration factor)} \\
&= {\operatorname{exp}\mathopen{}\left\{\beta_1 x_1\right\}\mathclose{}}
&& \text{(one covariate, no intercept)} \\
&= {\operatorname{exp}\mathopen{}\left\{2 {\operatorname{log}\mathopen{}\left\{2\right\}\mathclose{}}\right\}\mathclose{}}
&& \text{(substitute } \beta_1 = {\operatorname{log}\mathopen{}\left\{2\right\}\mathclose{}} \text{ and } x_1 = 2 \text{)} \\
&= 4
&& \text{(} {\operatorname{exp}\mathopen{}\left\{{\operatorname{log}\mathopen{}\left\{a\right\}\mathclose{}}\right\}\mathclose{}} = a \text{, and } 2 {\operatorname{log}\mathopen{}\left\{2\right\}\mathclose{}} = {\operatorname{log}\mathopen{}\left\{4\right\}\mathclose{}} \text{)}
\end{aligned}
\]
Definition 3 (Accelerated failure time model) An accelerated failure time (AFT) model for an event time \(T\) with covariate vector \(\mathord{\smash[b]{\underset{\raise.3ex\hbox{$\scriptstyle\sim$}}{x}}\vphantom{x}}\) assumes that
\[
\operatorname{S}(t \mid \mathord{\smash[b]{\underset{\raise.3ex\hbox{$\scriptstyle\sim$}}{x}}\vphantom{x}}) \stackrel{\text{def}}{=}\operatorname{S}_0\mathopen{}\left( t \cdot \theta_{{\lambda}}(\mathord{\smash[b]{\underset{\raise.3ex\hbox{$\scriptstyle\sim$}}{x}}\vphantom{x}}) \right)\mathclose{}
\tag{2}\]
where:
\(\operatorname{S}_0(t) \stackrel{\text{def}}{=}\mathbb{P}(T > t \mid \mathord{\smash[b]{\underset{\raise.3ex\hbox{$\scriptstyle\sim$}}{x}}\vphantom{x}}= \mathord{\smash[b]{\underset{\raise.3ex\hbox{$\scriptstyle\sim$}}{0}}\vphantom{0}})\) is the baseline survival function, and
\(\theta_{{\lambda}}(\mathord{\smash[b]{\underset{\raise.3ex\hbox{$\scriptstyle\sim$}}{x}}\vphantom{x}})\) is the acceleration factor (Definition 2).
Example 6 (An acceleration factor of 4) Suppose the baseline survival function is exponential with mean 40 weeks, \(\operatorname{S}_0(t) = {\operatorname{exp}\mathopen{}\left\{-t/40\right\}\mathclose{}}\), and a covariate pattern \(\mathord{\smash[b]{\underset{\raise.3ex\hbox{$\scriptstyle\sim$}}{x}}\vphantom{x}}\) has acceleration factor \(\theta_{{\lambda}}(\mathord{\smash[b]{\underset{\raise.3ex\hbox{$\scriptstyle\sim$}}{x}}\vphantom{x}}) = 4\). By Equation 2, the probability that a subject with covariates \(\mathord{\smash[b]{\underset{\raise.3ex\hbox{$\scriptstyle\sim$}}{x}}\vphantom{x}}\) is still event-free at 10 weeks is:
A subject with covariates \(\mathord{\smash[b]{\underset{\raise.3ex\hbox{$\scriptstyle\sim$}}{x}}\vphantom{x}}\) has the same chance of lasting 10 weeks that a baseline subject has of lasting 40 weeks.
Theorem 3 (AFT models rescale every quantile) In an AFT model (Definition 3), suppose the baseline survival function \(\operatorname{S}_0\) is continuous and strictly decreasing, and let \(t_q^0\) be the baseline time by which a fraction \(q\) of subjects have had the event, so that \(\operatorname{S}_0(t_q^0) = 1 - q\). Then the corresponding time for covariate pattern \(\mathord{\smash[b]{\underset{\raise.3ex\hbox{$\scriptstyle\sim$}}{x}}\vphantom{x}}\) is
Example 7 (Median event times with an acceleration factor of 4) In Example 6, the baseline survival function is \(\operatorname{S}_0(t) = {\operatorname{exp}\mathopen{}\left\{-t/40\right\}\mathclose{}}\). Its median (\(q = 0.5\)) solves \(\operatorname{S}_0(t_{0.5}^0) = 0.5\):
By Theorem 3, with \(\theta_{{\lambda}}(\mathord{\smash[b]{\underset{\raise.3ex\hbox{$\scriptstyle\sim$}}{x}}\vphantom{x}}) = 4\), the median for covariate pattern \(\mathord{\smash[b]{\underset{\raise.3ex\hbox{$\scriptstyle\sim$}}{x}}\vphantom{x}}\) is \(27.73 / 4 \approx 6.93\) weeks. To check: \(\operatorname{S}(6.93 \mid \mathord{\smash[b]{\underset{\raise.3ex\hbox{$\scriptstyle\sim$}}{x}}\vphantom{x}}) = \operatorname{S}_0(6.93 \cdot 4) = \operatorname{S}_0(27.73) = 0.5\).
We derive the expected survival time under the AFT model using change-of-variables integration:
\[
\begin{aligned}
{\mathbb{E}\mathopen{}\left[T \mid \mathord{\smash[b]{\underset{\raise.3ex\hbox{$\scriptstyle\sim$}}{x}}\vphantom{x}}\right]\mathclose{}} &\stackrel{\text{def}}{=}\int_{0}^{\infty} \operatorname{S}(t \mid \mathord{\smash[b]{\underset{\raise.3ex\hbox{$\scriptstyle\sim$}}{x}}\vphantom{x}}) dt && \text{(expectation formula for non-negative random variable)} \\
&= \int_{0}^{\infty} \operatorname{S}_0\mathopen{}\left( t \cdot \theta_{{\lambda}}(\mathord{\smash[b]{\underset{\raise.3ex\hbox{$\scriptstyle\sim$}}{x}}\vphantom{x}}) \right)\mathclose{} dt && \text{(substituting AFT survival function)} \\
&= \int_{0}^{\infty} \operatorname{S}_0(u) \cdot \frac{du}{\theta_{{\lambda}}(\mathord{\smash[b]{\underset{\raise.3ex\hbox{$\scriptstyle\sim$}}{x}}\vphantom{x}})} && \text{(substituting $u = t \cdot \theta_{{\lambda}}(\mathord{\smash[b]{\underset{\raise.3ex\hbox{$\scriptstyle\sim$}}{x}}\vphantom{x}}) \implies dt = \frac{du}{\theta_{{\lambda}}(\mathord{\smash[b]{\underset{\raise.3ex\hbox{$\scriptstyle\sim$}}{x}}\vphantom{x}})}$)} \\
&= \theta_{{\lambda}}(\mathord{\smash[b]{\underset{\raise.3ex\hbox{$\scriptstyle\sim$}}{x}}\vphantom{x}})^{-1} \cdot \int_{0}^{\infty} \operatorname{S}_0(u) du && \text{(factoring constant $\theta_{{\lambda}}(\mathord{\smash[b]{\underset{\raise.3ex\hbox{$\scriptstyle\sim$}}{x}}\vphantom{x}})^{-1}$ out of integral)} \\
&= \theta_{{\lambda}}(\mathord{\smash[b]{\underset{\raise.3ex\hbox{$\scriptstyle\sim$}}{x}}\vphantom{x}})^{-1} \cdot {\mathbb{E}\mathopen{}\left[T \mid \mathord{\smash[b]{\underset{\raise.3ex\hbox{$\scriptstyle\sim$}}{x}}\vphantom{x}}= \mathord{\smash[b]{\underset{\raise.3ex\hbox{$\scriptstyle\sim$}}{0}}\vphantom{0}}\right]\mathclose{}} && \text{(substituting baseline expectation formula)}
\end{aligned}
\]
Thus, the mean survival time for a subject with covariates \(\mathord{\smash[b]{\underset{\raise.3ex\hbox{$\scriptstyle\sim$}}{x}}\vphantom{x}}\) equals the baseline mean survival time divided by the acceleration factor \(\theta_{{\lambda}}(\mathord{\smash[b]{\underset{\raise.3ex\hbox{$\scriptstyle\sim$}}{x}}\vphantom{x}}) = {\operatorname{exp}\mathopen{}\left\{\eta(\mathord{\smash[b]{\underset{\raise.3ex\hbox{$\scriptstyle\sim$}}{x}}\vphantom{x}})\right\}\mathclose{}}\).
We also derive the cumulative hazard and hazard rate functions under the AFT formulation:
If the baseline distribution is exponential with parameter \(\lambda\), substituting \(\operatorname{S}_0(t) = {\operatorname{exp}\mathopen{}\left\{-\lambda t\right\}\mathclose{}}\) into the AFT model yields:
This derivation demonstrates that the exponential AFT model is mathematically identical to the exponential PH model.
The Weibull distribution has the same property.
Theorem 4 (A Weibull proportional hazards model is an AFT model) Let \(\operatorname{S}_0(t) = {\operatorname{exp}\mathopen{}\left\{-(\lambda t)^p\right\}\mathclose{}}\) be a Weibull baseline survival function with scale \(\lambda > 0\) and shape \(p > 0\). If subject \(i\) has hazard \({\lambda}_0(t) \cdot \theta_i\) for a constant \(\theta_i > 0\), then subject \(i\)’s survival function is
\[
\operatorname{S}_i(t) = \operatorname{S}_0\mathopen{}\left( t \cdot \theta_i^{1/p} \right)\mathclose{},
\]
so the model is also an accelerated failure time model, with acceleration factor \(\theta_i^{1/p}\).
Proof. \[
\begin{aligned}
\operatorname{S}_i(t)
&\stackrel{\text{def}}{=}{\operatorname{exp}\mathopen{}\left\{-\int_0^t {\lambda}_0(u) \cdot \theta_i \, du\right\}\mathclose{}}
&& \text{(survival function in terms of the hazard)} \\
&= {\operatorname{exp}\mathopen{}\left\{-\theta_i \cdot {\Lambda}_0(t)\right\}\mathclose{}}
&& \text{(factor the constant $\theta_i$ out of the integral)} \\
&= {\operatorname{exp}\mathopen{}\left\{-\theta_i (\lambda t)^p\right\}\mathclose{}}
&& \text{(Weibull cumulative hazard ${\Lambda}_0(t) = (\lambda t)^p$)} \\
&= {\operatorname{exp}\mathopen{}\left\{-\mathopen{}\left(\theta_i^{1/p}\right)\mathclose{}^p (\lambda t)^p\right\}\mathclose{}}
&& \text{(write $\theta_i = \mathopen{}\left(\theta_i^{1/p}\right)\mathclose{}^p$)} \\
&= {\operatorname{exp}\mathopen{}\left\{-\mathopen{}\left(\lambda \cdot t \cdot \theta_i^{1/p}\right)\mathclose{}^p\right\}\mathclose{}}
&& \text{(combine the $p$-th powers)} \\
&= \operatorname{S}_0\mathopen{}\left( t \cdot \theta_i^{1/p} \right)\mathclose{}
&& \text{(Weibull baseline survival function at $t \cdot \theta_i^{1/p}$)}
\end{aligned}
\]
Example 8 (A hazard ratio of 4 with Weibull shape 2) Take \(\lambda = 0.05\), \(p = 2\), and \(\theta_i = 4\), with time in weeks. By Theorem 4, the acceleration factor is
Both forms give \({\operatorname{exp}\mathopen{}\left\{-1\right\}\mathclose{}} \approx 0.368\): a four-fold hazard means that subject \(i\) ages twice as fast as baseline.
Theorem 5 (The Weibull model is a log-linear model for event times) Suppose subject \(i\) has the Weibull proportional hazards survival function \(\operatorname{S}_i(t) = {\operatorname{exp}\mathopen{}\left\{-\theta_i (\lambda t)^p\right\}\mathclose{}}\) of Theorem 4, with \(\theta_i \stackrel{\text{def}}{=}{\operatorname{exp}\mathopen{}\left\{\eta_i\right\}\mathclose{}}\) for a linear predictor \(\eta_i\). Define \(\alpha \stackrel{\text{def}}{=}-{\operatorname{log}\mathopen{}\left\{\lambda\right\}\mathclose{}}\) and \(\sigma \stackrel{\text{def}}{=}1/p\), and let \(W\) have the standard (minimum) Gumbel distribution, \(\mathbb{P}(W > w) = {\operatorname{exp}\mathopen{}\left\{-\text{e}^{w}\right\}\mathclose{}}\). Then the log event time \(Y_i \stackrel{\text{def}}{=}{\operatorname{log}\mathopen{}\left\{T_i\right\}\mathclose{}}\) has the same distribution as
The two random variables have the same survival function, so they have the same distribution.
Example 9 (Median event times from the log-linear form) Take \(\lambda = 0.1\) and \(p = 2\), so \(\alpha = -{\operatorname{log}\mathopen{}\left\{0.1\right\}\mathclose{}} = {\operatorname{log}\mathopen{}\left\{10\right\}\mathclose{}} \approx 2.3026\) and \(\sigma = 0.5\). The median of \(W\) solves \({\operatorname{exp}\mathopen{}\left\{-\text{e}^{w}\right\}\mathclose{}} = 0.5\), so \(\text{e}^{w} = {\operatorname{log}\mathopen{}\left\{2\right\}\mathclose{}}\) and \(w = {\operatorname{log}\mathopen{}\left\{{\operatorname{log}\mathopen{}\left\{2\right\}\mathclose{}}\right\}\mathclose{}} \approx -0.3665\). Because \(\alpha - \sigma \eta + \sigma W\) is an increasing function of \(W\), the median of \(Y\) is that function evaluated at the median of \(W\).
For a baseline subject (\(\eta = 0\)):
\[
\begin{aligned}
\text{median}(Y)
&= \alpha + \sigma \cdot (-0.3665)
&& \text{(log-linear form at the median of } W \text{)} \\
&= 2.3026 - 0.1833
&& \text{(multiply)} \\
&= 2.1193
&& \text{(subtract)}
\end{aligned}
\]
so the median event time is \(\text{e}^{2.1193} \approx 8.33\). Directly, \(\operatorname{S}_0(8.33) = {\operatorname{exp}\mathopen{}\left\{-(0.833)^2\right\}\mathclose{}} = {\operatorname{exp}\mathopen{}\left\{-0.694\right\}\mathclose{}} \approx 0.5\).
For a subject with hazard ratio \(\theta = 4\), so \(\eta = {\operatorname{log}\mathopen{}\left\{4\right\}\mathclose{}} \approx 1.3863\), the median of \(Y\) shifts by \(-\sigma \eta = -0.5 \cdot 1.3863 \approx -0.6931\), so the median event time is multiplied by \(\text{e}^{-0.6931} = 0.5\), giving \(8.33 \cdot 0.5 \approx 4.16\).
By Equation 3, the estimated AFT regression coefficients \(\hat{\beta}_{\text{AFT}}\) produced by R’s survreg() function relate directly to the PH regression coefficients \(\hat{\beta}_{\text{PH}}\) produced by coxph() via the identity \(\hat{\beta}_{\text{AFT}} = -\sigma \hat{\beta}_{\text{PH}}\).
The exponential and Weibull distributions are the only continuous distributions that are simultaneously proportional hazards models and accelerated failure time models. Other parametric families commonly used for survival data (log-logistic, log-normal, and generalized gamma) are AFT families rather than PH families; the log-logistic distribution is additionally a proportional-odds model.
1.5 Dataset: Leukemia treatments
To illustrate semi-parametric and parametric survival models, we analyze remission survival times from a clinical trial of 42 pediatric leukemia patients [2]. Half of the patients received a new therapy (6-mercaptopurine, 6-MP) and half received a standard control treatment.
The variables in this dataset include:
survt: Remission duration in weeks (\(T\)).
status: Relapse status (relapse = 1 or censored = 0).
rx: Treatment assignment (new vs standard).
sex: Patient sex (female vs male).
surv: Survival outcome object created with Surv(time = survt, event = (status == "relapse")).
anderson_cox0 <-coxph(formula = surv ~ rx,data = anderson)summary(anderson_cox0)#> Call:#> coxph(formula = surv ~ rx, data = anderson)#> #> n= 42, number of events= 30 #> #> coef exp(coef) se(coef) z Pr(>|z|) #> rxstandard 1.572 4.817 0.412 3.81 0.00014 ***#> ---#> Signif. codes: 0 '***' 0.001 '**' 0.01 '*' 0.05 '.' 0.1 ' ' 1#> #> exp(coef) exp(-coef) lower .95 upper .95#> rxstandard 4.82 0.208 2.15 10.8#> #> Concordance= 0.69 (se = 0.041 )#> Likelihood ratio test= 16.4 on 1 df, p=5e-05#> Wald test = 14.5 on 1 df, p=1e-04#> Score (logrank) test = 17.2 on 1 df, p=3e-05
The estimated log hazard ratio\(\hat{\beta}_{\text{PH}}\) for standard treatment relative to new treatment is positive, indicating that standard therapy is associated with a higher hazard of relapse (shorter remission duration).
Weibull parametric model
We next fit a parametric Weibull accelerated failure time model using survreg():
In survreg(), regression parameters are reported on the log-time scale (\(Y = \log T = \alpha + \mathord{\smash[b]{\underset{\raise.3ex\hbox{$\scriptstyle\sim$}}{\beta}}\vphantom{\beta}}_{\text{AFT}} \mathord{\smash[b]{\underset{\raise.3ex\hbox{$\scriptstyle\sim$}}{x}}\vphantom{x}}+ \sigma W\)). The estimated coefficient \(\hat{\beta}_{\text{AFT}}\) for standard treatment is negative, indicating a reduction in log survival time (faster progression to relapse). The scale estimate \(\hat{\sigma}\) corresponds to \(1 / p\), and satisfies \(\hat{\beta}_{\text{AFT}} = -\hat{\sigma}\hat{\beta}_{\text{PH}}\).
Exponential parametric model
Setting the scale parameter to \(\sigma = 1\) (\(p = 1\)) yields the exponential parametric model:
[R code]
anderson_exp <-survreg(formula = surv ~ rx,data = anderson,dist ="exp")summary(anderson_exp)#> #> Call:#> survreg(formula = surv ~ rx, data = anderson, dist = "exp")#> Value Std. Error z p#> (Intercept) 3.686 0.333 11.06 < 2e-16#> rxstandard -1.527 0.398 -3.83 0.00013#> #> Scale fixed at 1 #> #> Exponential distribution#> Loglik(model)= -108.5 Loglik(intercept only)= -116.8#> Chisq= 16.49 on 1 degrees of freedom, p= 4.9e-05 #> Number of Newton-Raphson Iterations: 4 #> n= 42
In the exponential model, \(\hat{\beta}_{\text{AFT}} = -\hat{\beta}_{\text{PH}}\), so the AFT coefficient is equal in magnitude and opposite in sign to the Cox proportional hazards coefficient.
Example 10 (Exponential rate estimates for the leukemia trial) By the MLE of the exponential rate parameter, each group’s estimated hazard rate is its number of relapses divided by its total follow-up time:
For the new treatment, 9 relapses over 359 weeks of follow-up give \(\hat{{\lambda}}_{\text{new}} = 9/359 \approx 0.0251\) relapses per week; for the standard treatment, 21 relapses over 182 weeks give \(\hat{{\lambda}}_{\text{standard}} = 21/182 \approx 0.1154\). The estimated log hazard ratio is then:
The survreg() fit’s rxstandard coefficient, \(-1.527\), is the negative of this log hazard ratio, as the exponential AFT model predicts, and its intercept, \(3.686\), is \({\operatorname{log}\mathopen{}\left\{359/9\right\}\mathclose{}}\), the log of the estimated mean remission time on the new treatment.
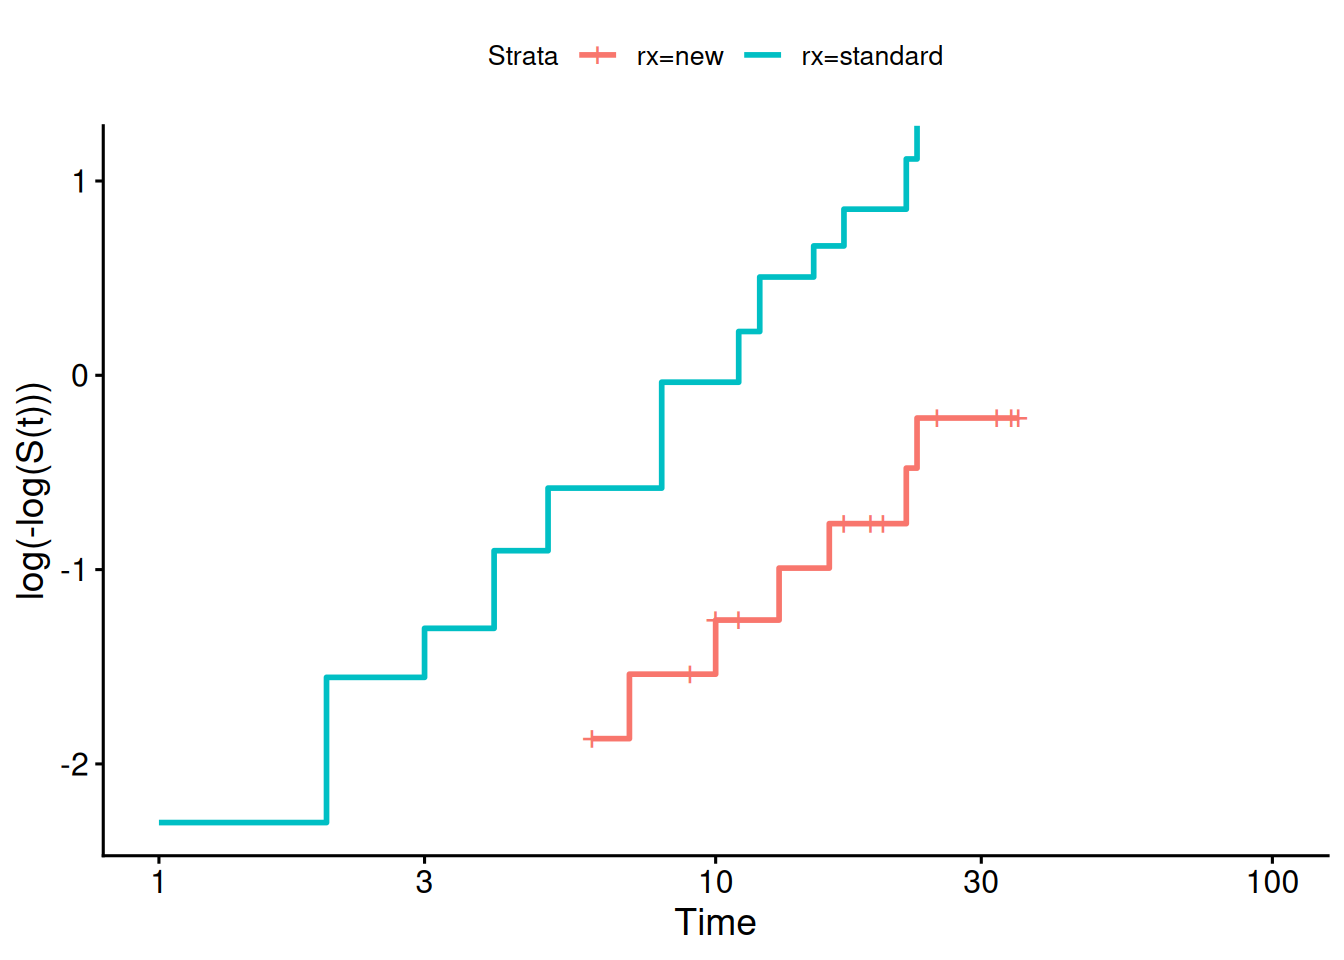
Diagnostic: complementary log-log survival plot
To check whether a Weibull proportional hazards assumption is reasonable, we inspect the complementary log-log transformation of the Kaplan-Meier survival curves, \(\log(-\log \mathop{\hat{\operatorname{S}}}\nolimits(t)) = p \log \lambda + p \log t\):
[R code]
# plot the cumulative hazard H(t) = -log(S(t)) against time on log-spaced axes,# so that the ticks are in weeks and in units of cumulative hazard,# rather than in the logs of those quantities;# log10 is not finite at 0, so leave out the points where H(t) = 0# (before the first event) and where S(t) = 0 (so that H(t) is infinite):survfit(formula = surv ~ rx,data = anderson) |> broom::tidy() |> dplyr::mutate(cumhaz =-log(estimate)) |> dplyr::filter(time >0, cumhaz >0, is.finite(cumhaz)) |>ggplot() +aes(x = time, y = cumhaz, col = strata) +geom_step() +theme_bw() +scale_x_continuous(trans ="log10",labels = scales::label_number(drop0trailing =TRUE, big.mark =","),name ="Time (weeks, log scale)" ) +scale_y_continuous(trans ="log10",labels = scales::label_number(drop0trailing =TRUE, big.mark =","),name ="Cumulative hazard H(t) (log scale)" ) +theme(legend.position ="bottom", legend.title =element_blank())
Cumulative hazard curves by treatment group, on log-spaced axes (complementary log-log survival curves)
If the complementary log-log curves are approximately linear and parallel across treatment groups, then a Weibull proportional hazards model is appropriate.
2 Combining left-truncation and interval-censoring
In observational studies and clinical trials, complex observation schemes can introduce both left-truncation (delayed entry) and interval-censoring. Left-truncation occurs when subjects enter the risk set only after surviving past an entry time \(L_{\text{entry}} > 0\). Interval-censoring occurs when the exact event time \(T_i\) is unknown, but is known to fall within an interval \((L_i, R_i]\).
Standard software tools in R make distinct trade-offs between these two observation mechanisms:
coxph does left truncation but not left (or interval) censoring; survreg does interval censoring but not left truncation (or time dependent covariates).
In particular, coxph() constructs risk sets dynamically at each observed failure time \(t_j\) using counting process format (time1 = entry, time2 = exit), enabling seamless handling of left-truncation. However, because partial likelihood relies on ordered exact failure times, standard Cox models cannot easily accommodate interval-censored data.
Conversely, survreg() accommodates interval-censored outcomes via Surv(time1 = L, time2 = R, type = "interval") by maximizing the interval parametric likelihood\(\mathbb{P}(L_i < T_i \le R_i) = \operatorname{F}_0(R_i) - \operatorname{F}_0(L_i)\). However, standard survreg() assumes all subjects enter observation at time 0, and does not condition likelihood terms on surviving past a delayed entry time \(L_{\text{entry}}\).
When a study contains both delayed entry and interval-censored event times, specialized tooling is needed. Among the following R packages, only flexsurv handles both features together; the other two are listed because they cover interval censoring well and are the usual starting points, not because they solve the truncation half:
flexsurv: Fits flexible parametric survival models and allows custom likelihood specifications that incorporate both left-truncation conditioning and interval-censored bounds.
icenReg: Fits regression models for interval-censored data: Cox proportional-hazards, proportional-odds, and accelerated failure time. Semi-parametric and fully parametric forms are both available, but the fully parametric option covers the AFT models only. It does not itself provide left-truncation conditioning.
interval: Fits nonparametric survival curves (NPMLE) for interval-censored data and provides weighted logrank and Wilcoxon-type tests [3]. It is nonparametric throughout, so it supports neither regression nor truncation.
J. D. Kalbfleisch and R. L. Prentice, The statistical analysis of failure time data. John Wiley & Sons, 2011.
[3]
M. P. Fay and P. A. Shaw, “Exact and asymptotic weighted logrank tests for interval censored data: The intervalR package,”Journal of Statistical Software, vol. 36, no. 2, pp. 1–34, 2010, doi: 10.18637/jss.v036.i02.