Key distributions

Last modified: 2026-11-07 04:59:05 (PST)

Table 1: Distributions typically used for outcome models
Distribution Uses
Bernoulli Binary outcomes
Binomial Sums of Bernoulli outcomes
Poisson Unbounded count outcomes
Geometric Counts of non-events before an event occurs
Negative binomial Mixtures of Poisson distributions, counts of non-events until a given number of events occurs
Normal (Gaussian) Continuous outcomes without a more specific distribution
Multivariate normal Vectors of continuous outcomes
Mixtures Outcomes from a population of unobserved subpopulations
Exponential Time to event outcomes
Gamma Time to event outcomes
Weibull Time to event outcomes
Log-normal Time to event outcomes
Table 2: Distributions typically used for test statistics
Distribution Uses
\(\chi^2\) Regression comparisons (asymptotic), contingency table independence tests, goodness-of-fit tests
\(F\) Gaussian model comparisons (exact)
\(Z\) (standard normal) Proportions, means, regression coefficients (asymptotic)
\(t\) (Student’s) Means, regression coefficients in Gaussian outcome models (exact)

0.1 The Bernoulli distribution

Example 1 (A coin flip) The Bernoulli distribution describes a binary outcome. The indicator of heads on one flip of a fair coin is \(\operatorname{Ber}(1/2)\). By the expectation of the Bernoulli distribution, \(X \sim \operatorname{Ber}(\pi)\) has mean \(\pi\), and by the variance of a Bernoulli random variable, it has variance \(\pi(1 - \pi)\).

0.2 The binomial distribution

Definition 1 (Binomial distribution) A discrete random variable \(X\) has the binomial distribution with number of trials \(n \in {\mathopen{}\left\{1, 2, \dots\right\}\mathclose{}}\) and event probability \(\pi\in [0, 1]\), written \(X \sim {\operatorname{Bin}\mathopen{}\left(n, \pi\right)\mathclose{}}\) [1], if:

\[ \mathbb{P}(X = x) \stackrel{\text{def}}{=}\binom{n}{x} \pi^x (1 - \pi)^{n - x}, \quad x \in {\mathopen{}\left\{0, 1, \dots, n\right\}\mathclose{}} \tag{1}\]

where \(\binom{n}{x} = \frac{n!}{x!\,(n - x)!}\) is the number of ways to choose \(x\) of the \(n\) trials.

Example 2 (Two heads in three flips) Let \(X \sim {\operatorname{Bin}\mathopen{}\left(3, 1/2\right)\mathclose{}}\) be the number of heads in three flips of a fair coin. By Equation 1:

\[ \begin{aligned} \mathbb{P}(X = 2) &= \binom{3}{2} \mathopen{}\left(\frac{1}{2}\right)\mathclose{}^2 \mathopen{}\left(1 - \frac{1}{2}\right)\mathclose{}^{3 - 2} && \text{(binomial PMF with } n = 3,\ \pi= 1/2,\ x = 2 \text{)} \\ &= \frac{3!}{2!\,1!} \mathopen{}\left(\frac{1}{2}\right)\mathclose{}^2 \mathopen{}\left(\frac{1}{2}\right)\mathclose{}^1 && \text{(definition of } \tbinom{3}{2} \text{; } 1 - 1/2 = 1/2 \text{)} \\ &= 3 \cdot\frac{1}{4} \cdot\frac{1}{2} && \text{(evaluate the factorials and powers)} \\ &= \frac{3}{8} && \text{(multiply)} \end{aligned} \]

The three outcomes with two heads are \(HHT\), \(HTH\), and \(THH\), each with probability \(1/8\).

Example 3 (Draws without replacement are not binomial) An urn holds two red balls and two blue balls. Draw two balls without replacement, and let \(X\) be the number of red balls drawn. Each draw is red with probability \(1/2\), but \(X \not\sim {\operatorname{Bin}\mathopen{}\left(2, 1/2\right)\mathclose{}}\), because the draws are not independent:

\[ \begin{aligned} \mathbb{P}(X = 2) &= \mathbb{P}(\text{first red}) \cdot\mathbb{P}(\text{second red} \mid \text{first red}) && \text{(multiplication rule)} \\ &= \frac{2}{4} \cdot\frac{1}{3} && \text{(one red ball is left among three)} \\ &= \frac{1}{6} && \text{(multiply)} \end{aligned} \]

whereas, by Equation 1, a \({\operatorname{Bin}\mathopen{}\left(2, 1/2\right)\mathclose{}}\) random variable has

\[ \begin{aligned} \mathbb{P}(X = 2) &= \binom{2}{2} \mathopen{}\left(\frac{1}{2}\right)\mathclose{}^2 \mathopen{}\left(\frac{1}{2}\right)\mathclose{}^0 && \text{(binomial PMF with } n = 2,\ \pi= 1/2,\ x = 2 \text{)} \\ &= \frac{1}{4} && \text{(evaluate)} \end{aligned} \]

Theorem 1 (A sum of IID Bernoulli variables is binomial) If \(X_1, \ldots, X_n\) are IID \(\operatorname{Ber}(\pi)\) random variables, then their sum \(S = \sum_{i=1}^nX_i\) has the \({\operatorname{Bin}\mathopen{}\left(n, \pi\right)\mathclose{}}\) distribution.

Proof. Each \(X_i\) is \(0\) or \(1\), so \(S\) takes values in \({\mathopen{}\left\{0, 1, \dots, n\right\}\mathclose{}}\). Let \(x \in {\mathopen{}\left\{0, 1, \dots, n\right\}\mathclose{}}\) be a value of \(S\), and let \(A_x\) be the set of sequences \((s_1, \ldots, s_n) \in {\mathopen{}\left\{0, 1\right\}\mathclose{}}^n\) with exactly \(x\) ones. The event \({\mathopen{}\left\{S = x\right\}\mathclose{}}\) is the disjoint union of the events \({\mathopen{}\left\{X_1 = s_1, \ldots, X_n = s_n\right\}\mathclose{}}\) over \((s_1, \ldots, s_n) \in A_x\). For one such sequence:

\[ \begin{aligned} \mathbb{P}(X_1 = s_1, \ldots, X_n = s_n) &= \prod_{i=1}^n \mathbb{P}(X_i = s_i) && \text{(independence)} \\ &= \prod_{i=1}^n \pi^{s_i} (1 - \pi)^{1 - s_i} && \text{(Bernoulli PMF)} \\ &= \pi^{\sum_{i=1}^ns_i} (1 - \pi)^{\sum_{i=1}^n(1 - s_i)} && \text{(collect exponents)} \\ &= \pi^x (1 - \pi)^{n - x} && \text{(} \textstyle\sum_{i=1}^ns_i = x \text{ for a sequence in } A_x \text{)} \end{aligned} \]

Choosing which \(x\) of the \(n\) positions hold the ones determines the sequence, so \(A_x\) has \(\binom{n}{x}\) elements. Therefore:

\[ \begin{aligned} \mathbb{P}(S = x) &= \sum_{(s_1, \ldots, s_n) \in A_x} \mathbb{P}(X_1 = s_1, \ldots, X_n = s_n) && \text{(additivity over disjoint events)} \\ &= \sum_{(s_1, \ldots, s_n) \in A_x} \pi^x (1 - \pi)^{n - x} && \text{(probability of one sequence)} \\ &= \binom{n}{x} \pi^x (1 - \pi)^{n - x} && \text{(} A_x \text{ has } \tbinom{n}{x} \text{ elements)} \end{aligned} \]

which is Equation 1.

Example 4 (Counting treatment responders) Suppose five patients each respond to a treatment with probability \(0.2\), independently of one another, and let \(X_i = 1\) if patient \(i\) responds and \(X_i = 0\) otherwise. By Theorem 1, the number of responders \(S = \sum_{i=1}^5 X_i\) is \({\operatorname{Bin}\mathopen{}\left(5, 0.2\right)\mathclose{}}\), so the probability that nobody responds is:

\[ \begin{aligned} \mathbb{P}(S = 0) &= \binom{5}{0} (0.2)^0 (1 - 0.2)^{5 - 0} && \text{(binomial PMF with } n = 5,\ \pi= 0.2,\ x = 0 \text{)} \\ &= 1 \cdot 1 \cdot(0.8)^5 && \text{(} \tbinom{5}{0} = 1 \text{ and } (0.2)^0 = 1 \text{)} \\ &= 0.32768 && \text{(evaluate the power)} \end{aligned} \]

Theorem 2 (Mean and variance of the binomial distribution) If \(X \sim {\operatorname{Bin}\mathopen{}\left(n, \pi\right)\mathclose{}}\), then:

  • \({\mathbb{E}\mathopen{}\left[X\right]\mathclose{}} = n\pi\)
  • \({\operatorname{Var}\mathopen{}\left(X\right)\mathclose{}} = n\pi(1 - \pi)\)

Proof. The mean and variance of \(X\) depend only on its distribution, so by Theorem 1 we can compute them for \(S = \sum_{i=1}^nX_i\), where \(X_1, \ldots, X_n\) are IID \(\operatorname{Ber}(\pi)\). For the mean, apply linearity of expectation \(n - 1\) times, then the Bernoulli mean:

\[ \begin{aligned} {\mathbb{E}\mathopen{}\left[S\right]\mathclose{}} &= {\mathbb{E}\mathopen{}\left[\sum_{i=1}^nX_i\right]\mathclose{}} && \text{(definition of } S \text{)} \\ &= \sum_{i=1}^n{\mathbb{E}\mathopen{}\left[X_i\right]\mathclose{}} && \text{(linearity of expectation)} \\ &= \sum_{i=1}^n\pi && \text{(Bernoulli mean)} \\ &= n\pi && \text{(sum of } n \text{ copies of } \pi\text{)} \end{aligned} \]

For the variance, apply the variance of a linear combination with \(a_1 = \cdots = a_n = 1\), then independent components give a diagonal variance matrix, then the Bernoulli variance:

\[ \begin{aligned} {\operatorname{Var}\mathopen{}\left(S\right)\mathclose{}} &= \sum_{i=1}^n\sum_{j=1}^n {\operatorname{Cov}\mathopen{}\left(X_i, X_j\right)\mathclose{}} && \text{(variance of a linear combination with } a_i = 1 \text{)} \\ &= \sum_{i=1}^n{\operatorname{Cov}\mathopen{}\left(X_i, X_i\right)\mathclose{}} && \text{(} {\operatorname{Cov}\mathopen{}\left(X_i, X_j\right)\mathclose{}} = 0 \text{ for } i \neq j \text{, by independence)} \\ &= \sum_{i=1}^n{\operatorname{Var}\mathopen{}\left(X_i\right)\mathclose{}} && \text{(} {\operatorname{Cov}\mathopen{}\left(X_i, X_i\right)\mathclose{}} = {\operatorname{Var}\mathopen{}\left(X_i\right)\mathclose{}} \text{)} \\ &= \sum_{i=1}^n\pi(1 - \pi) && \text{(Bernoulli variance)} \\ &= n\pi(1 - \pi) && \text{(sum of } n \text{ copies of } \pi(1 - \pi) \text{)} \end{aligned} \]

Example 5 (Expected number of responders) In Example 4, \(S \sim {\operatorname{Bin}\mathopen{}\left(5, 0.2\right)\mathclose{}}\). By Theorem 2:

\[ \begin{aligned} {\mathbb{E}\mathopen{}\left[S\right]\mathclose{}} &= 5 \cdot 0.2 && \text{(} n\pi\text{)} \\ &= 1 && \text{(multiply)} \\ {\operatorname{Var}\mathopen{}\left(S\right)\mathclose{}} &= 5 \cdot 0.2 \cdot(1 - 0.2) && \text{(} n\pi(1 - \pi) \text{)} \\ &= 0.8 && \text{(multiply)} \end{aligned} \]

On average, one of the five patients responds.

0.3 The Poisson distribution

Definition 2 (Poisson distribution) A random variable \(Y\) has the Poisson distribution with mean parameter \(\mu> 0\), written \(Y \sim \operatorname{Pois}(\mu)\) [3], if:

\[\mathbb{P}(Y = y) \stackrel{\text{def}}{=}\frac{\mu^{y} e^{-\mu}}{y!}, \quad y \in \mathbb{N}= {\mathopen{}\left\{0, 1, 2, \dots\right\}\mathclose{}} \tag{2}\]

Exercise 1 What is the range of possible values for a Poisson distribution?

Solution 1. \[ \begin{aligned} \mathcal{R}(Y) &= {\mathopen{}\left\{0, 1, 2, \dots\right\}\mathclose{}} \\ &= \mathbb{N} \end{aligned} \]

Theorem 3 (CDF of Poisson distribution) If \(Y \sim \operatorname{Pois}(\mu)\), then for every real number \(y\):

\[\mathbb{P}(Y \le y) = e^{-\mu} \sum_{j=0}^{\mathopen{}\left\lfloor y\right\rfloor\mathclose{}}\frac{\mu^j}{j!} \tag{3}\]

Proof. For \(y < 0\), both sides are \(0\) (the sum is empty). For any \(y \ge 0\), the event \(\{Y \le y\}\) is the disjoint union of events \(\{Y = j\}\) for all non-negative integers \(j \le \mathopen{}\left\lfloor y\right\rfloor\mathclose{}\). Applying the Poisson PMF (Equation 2) and factoring out the common term \(e^{-\mu}\):

\[ \begin{aligned} \mathbb{P}(Y \le y) &= \sum_{j=0}^{\mathopen{}\left\lfloor y\right\rfloor\mathclose{}} \mathbb{P}(Y = j) && (\text{disjoint union of events } Y = j) \\ &= \sum_{j=0}^{\mathopen{}\left\lfloor y\right\rfloor\mathclose{}} \frac{\mu^j e^{-\mu}}{j!} && (\text{definition of Poisson PMF}) \\ &= e^{-\mu} \sum_{j=0}^{\mathopen{}\left\lfloor y\right\rfloor\mathclose{}} \frac{\mu^j}{j!} && (\text{factoring out } e^{-\mu} \text{ constant wrt } j) \end{aligned} \]

Example 6 (Computing Poisson cumulative probabilities) For a Poisson random variable \(X \sim \operatorname{Pois}(\mu= 2)\), the probability of observing at most 2 events is computed as:

\[ \begin{aligned} \mathbb{P}(X \le 2) &= e^{-2} \sum_{j=0}^{2} \frac{2^j}{j!} && (\text{apply CDF formula with } \mu= 2, y = 2) \\ &= e^{-2} \mathopen{}\left(\frac{2^0}{0!} + \frac{2^1}{1!} + \frac{2^2}{2!}\right)\mathclose{} && (\text{expand terms for } j = 0, 1, 2) \\ &= e^{-2} \mathopen{}\left(1 + 2 + 2\right)\mathclose{} && (\text{simplify factorials and powers}) \\ &= 5 e^{-2} \approx 0.677 && (\text{evaluate numerical value}) \end{aligned} \]

[Code]
pois_dists <-
  dplyr::tibble(mu = c(0.5, 1, 2, 5, 10, 20)) |>
  dplyr::reframe(.by = mu, x = 0:30) |>
  dplyr::mutate(
    `P(X = x)` = dpois(x, lambda = mu),
    `P(X <= x)` = ppois(x, lambda = mu),
    mu = factor(mu)
  )

plot0 <-
  pois_dists |>
  ggplot2::ggplot(
    ggplot2::aes(
      x = x,
      y = `P(X = x)`,
      fill = mu,
      col = mu
    )
  ) +
  ggplot2::theme(legend.position = "bottom") +
  ggplot2::labs(
    fill = latex2exp::TeX("$\\mu$"),
    col = latex2exp::TeX("$\\mu$"),
    y = latex2exp::TeX("$\\Pr_{\\mu}(X = x)$")
  )

plot1 <-
  plot0 +
  ggplot2::geom_segment(yend = 0) +
  ggplot2::facet_wrap(~mu)

print(plot1)
Figure 1: Poisson PMFs, by mean parameter \(\mu\)
[Code]
plot2 <-
  plot0 +
  ggplot2::geom_step(alpha = 0.75) +
  ggplot2::aes(y = `P(X <= x)`) +
  ggplot2::labs(y = latex2exp::TeX("$\\Pr_{\\mu}(X \\leq x)$"))

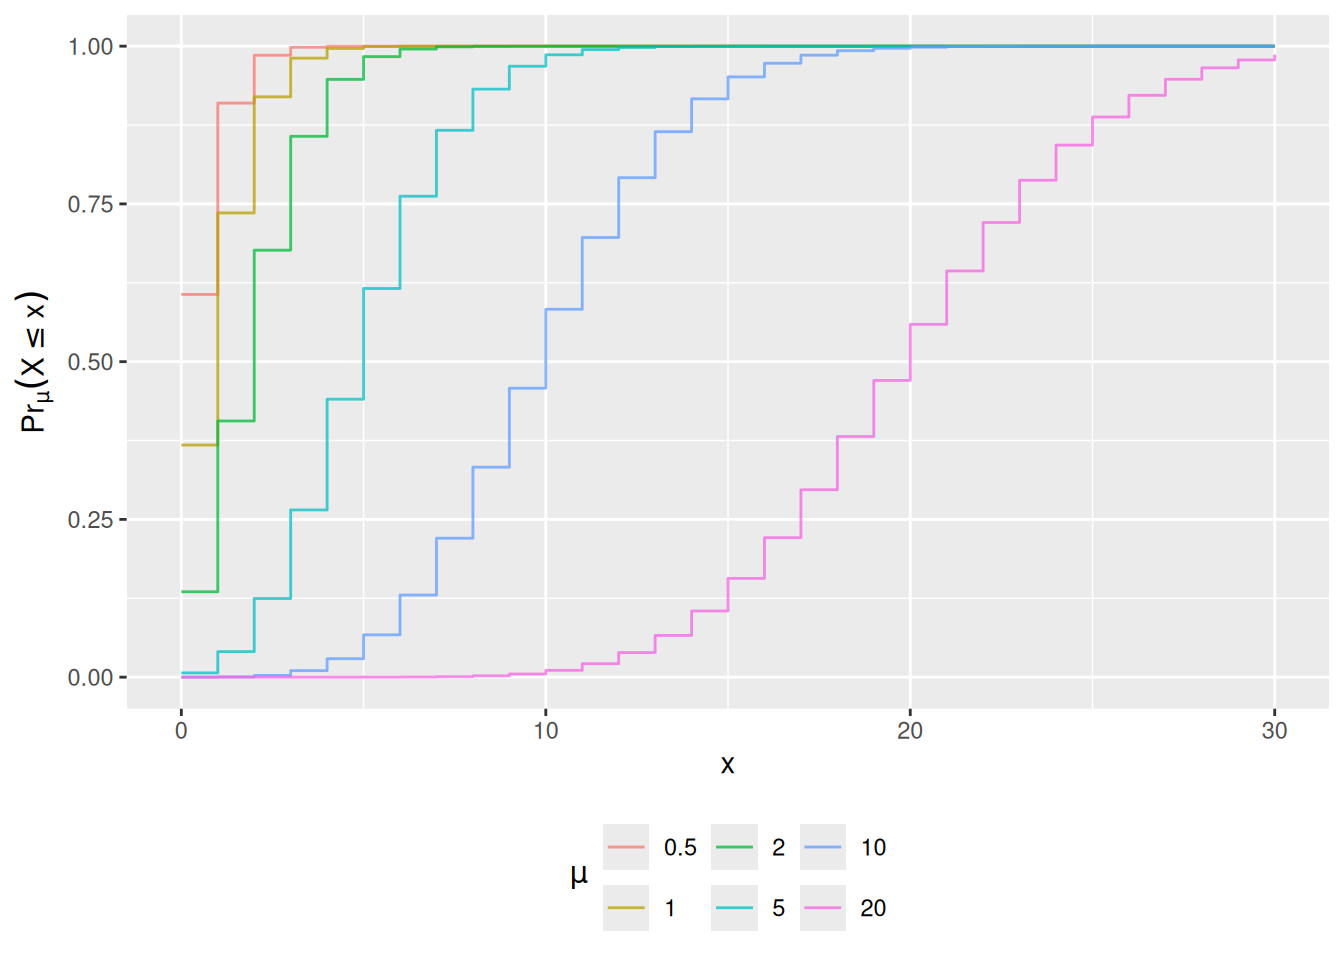
print(plot2)
Figure 2: Poisson CDFs

Exercise 2 (Poisson distribution functions) Let \(X \sim \operatorname{Pois}(\mu= 3.75)\).

Compute:

  • \(\mathbb{P}(X = 4)\)
  • \(\mathbb{P}(X \le 7)\)
  • \(\mathbb{P}(X > 5)\)

Solution.

  • \(\mathbb{P}(X=4) = 0.1937803\)
  • \(\mathbb{P}(X\le 7) = 0.9623787\)
  • \(\mathbb{P}(X > 5) = 0.1771172\)

Theorem 4 (Mean and variance of the Poisson distribution) If \(X \sim \operatorname{Pois}(\mu)\), then:

  • \(\mathbb{E}[X] = \mu\)
  • \(\operatorname{Var}(X) = \mu\)

Proof. Mean.

\[ \begin{aligned} \mathbb{E}[X] &= \sum_{x=0}^\infty x \cdot \mathbb{P}(X=x) && (\text{definition of expected value}) \\ &= 0 \cdot \mathbb{P}(X=0) + \sum_{x=1}^{\infty} x \cdot \mathbb{P}(X=x) && (\text{separate } x=0 \text{ term}) \\ &= \sum_{x=1}^{\infty} x \cdot \frac{\mu^x e^{-\mu}}{x!} && (\text{substitute Poisson PMF}) \\ &= \sum_{x=1}^{\infty} x \cdot \frac{\mu^x e^{-\mu}}{x \cdot (x-1)!} && (\text{definition of factorial } x!) \\ &= \sum_{x=1}^{\infty} \frac{\mu^x e^{-\mu}}{(x-1)!} && (\text{cancel factor of } x) \\ &= \mu\cdot \sum_{x=1}^{\infty} \frac{\mu^{x-1} e^{-\mu}}{(x-1)!} && (\text{factor out one power of } \mu) \\ &= \mu\cdot \sum_{y=0}^\infty \frac{\mu^y e^{-\mu}}{y!} && (\text{change index variable } y \stackrel{\text{def}}{=}x-1) \\ &= \mu\cdot 1 && (\text{PMF sums to 1 over state space}) \\ &= \mu&& (\text{simplify}) \end{aligned} \]

Variance. The same steps, canceling two factors instead of one, give \({\mathbb{E}\mathopen{}\left[X(X-1)\right]\mathclose{}}\):

\[ \begin{aligned} {\mathbb{E}\mathopen{}\left[X(X-1)\right]\mathclose{}} &= \sum_{x=2}^\infty x(x-1) \cdot \frac{\mu^x e^{-\mu}}{x!} && (\text{LOTUS; the } x = 0, 1 \text{ terms are } 0) \\ &= \sum_{x=2}^\infty \frac{\mu^x e^{-\mu}}{(x-2)!} && (\text{cancel } x(x-1) \text{ against } x!) \\ &= \mu^2 \cdot \sum_{y=0}^\infty \frac{\mu^y e^{-\mu}}{y!} && (\text{factor out } \mu^2 \text{; } y \stackrel{\text{def}}{=}x - 2) \\ &= \mu^2 && (\text{PMF sums to 1}) \end{aligned} \]

Then, by the simplified expression for variance and linearity of expectation:

\[ \begin{aligned} \operatorname{Var}(X) &= {\mathbb{E}\mathopen{}\left[X^2\right]\mathclose{}} - {\mathopen{}\left({\mathbb{E}\mathopen{}\left[X\right]\mathclose{}}\right)\mathclose{}}^{2} && (\text{simplified expression for variance}) \\ &= {\mathbb{E}\mathopen{}\left[X(X-1)\right]\mathclose{}} + {\mathbb{E}\mathopen{}\left[X\right]\mathclose{}} - {\mathopen{}\left({\mathbb{E}\mathopen{}\left[X\right]\mathclose{}}\right)\mathclose{}}^{2} && (X^2 = X(X-1) + X \text{; linearity}) \\ &= \mu^2 + \mu- \mu^2 && (\text{substitute}) \\ &= \mu&& (\text{simplify}) \end{aligned} \]

See also https://statproofbook.github.io/P/poiss-mean and https://statproofbook.github.io/P/poiss-var.

Theorem 5 (Ratio of consecutive Poisson probabilities, and the mode) If \(X \sim \operatorname{Pois}(\mu)\), then:

  • \(\mathbb{P}(X=x) = \frac{\mu}{x} \mathbb{P}(X = x-1)\) for \(x \in {\mathopen{}\left\{1, 2, \dots\right\}\mathclose{}}\)
  • For \(x \in {\mathopen{}\left\{1, 2, \dots\right\}\mathclose{}}\) with \(x < \mu\), \(\mathbb{P}(X=x) > \mathbb{P}(X = x-1)\)
  • For \(x = \mu\) (possible only when \(\mu\) is an integer), \(\mathbb{P}(X=x) = \mathbb{P}(X = x-1)\)
  • For \(x \in {\mathopen{}\left\{1, 2, \dots\right\}\mathclose{}}\) with \(x > \mu\), \(\mathbb{P}(X=x) < \mathbb{P}(X = x-1)\)
  • If \(\mu\) is not an integer, \(\arg \max_{x} \mathbb{P}(X=x) = \mathopen{}\left\lfloor\mu\right\rfloor\mathclose{}\); if \(\mu\) is an integer, the maximum is attained at both \(x = \mu- 1\) and \(x = \mu\)

Proof. Ratio of consecutive probabilities. For \(x \in {\mathopen{}\left\{1, 2, \dots\right\}\mathclose{}}\):

\[ \begin{aligned} \frac{\mathbb{P}(X = x)}{\mathbb{P}(X = x - 1)} &= \frac{\mu^x e^{-\mu} / x!}{\mu^{x-1} e^{-\mu} / (x-1)!} && (\text{substitute Poisson PMF}) \\ &= \frac{\mu}{x} && (\text{cancel } \mu^{x-1} e^{-\mu} \text{ and } (x-1)!) \end{aligned} \]

This ratio is greater than, equal to, or less than 1 as \(x\) is less than, equal to, or greater than \(\mu\), which gives the three comparisons. So \(\mathbb{P}(X = x)\) increases while \(x < \mu\) and decreases once \(x > \mu\). If \(\mu\) is not an integer, the last increase is at \(x = \mathopen{}\left\lfloor\mu\right\rfloor\mathclose{}\), which is therefore the unique mode. If \(\mu\) is an integer, \(\mathbb{P}(X = \mu) = \mathbb{P}(X = \mu- 1)\), and both are modes.

Example 7 (Mode of a Poisson distribution) For \(X \sim \operatorname{Pois}(2.5)\), \(\mathbb{P}(X = 2) = \frac{2.5}{2}\mathbb{P}(X = 1) > \mathbb{P}(X = 1)\) and \(\mathbb{P}(X = 3) = \frac{2.5}{3}\mathbb{P}(X = 2) < \mathbb{P}(X = 2)\), so the mode is \(\mathopen{}\left\lfloor 2.5\right\rfloor\mathclose{} = 2\). For \(X \sim \operatorname{Pois}(2)\), \(\mathbb{P}(X = 2) = \frac{2}{2}\mathbb{P}(X = 1)\), so \(1\) and \(2\) are both modes, each with probability \(2 e^{-2} \approx 0.271\).

Definition 3 (Exposure magnitude) For many count outcomes, there is some sense of an exposure magnitude, such as population size or duration of observation, which multiplicatively rescales the expected (mean) count.

Exercise 3 What are some examples of exposure magnitudes?

Solution.

Table 3: Examples of exposure units
outcome exposure units
disease incidence number of individuals exposed; time at risk
car accidents miles driven
worksite accidents person-hours worked
population size size of habitat

Definition 4 (Event rate) For a count \(Y\) observed over a fixed, known exposure magnitude \(t > 0\), the event rate, denoted \({\lambda}\), is the mean of \(Y\) divided by the exposure magnitude:

\[{\lambda}\stackrel{\text{def}}{=}\frac{{\mathbb{E}\mathopen{}\left[Y\right]\mathclose{}}}{t} \tag{4}\]

Theorem 6 (Transformation function from event rate to mean) If a count \(Y\) is observed over exposure magnitude \(t > 0\) with event rate \({\lambda}\), then its mean \(\mu\stackrel{\text{def}}{=}{\mathbb{E}\mathopen{}\left[Y\right]\mathclose{}}\) is:

\[\mu= {\lambda}\cdot t \tag{5}\]

Proof. By Definition 4:

\[ \begin{aligned} {\lambda}&\stackrel{\text{def}}{=}\frac{{\mathbb{E}\mathopen{}\left[Y\right]\mathclose{}}}{t} && (\text{definition of event rate}) \\ {\mathbb{E}\mathopen{}\left[Y\right]\mathclose{}} &= {\lambda}\cdot t && (\text{multiply both sides by } t > 0) \\ \mu&= {\lambda}\cdot t && (\mu\stackrel{\text{def}}{=}{\mathbb{E}\mathopen{}\left[Y\right]\mathclose{}}) \end{aligned} \]

Example 8 (Calculating expected counts from event rates) Suppose a city records a disease event rate of \({\lambda}= 0.05\) cases per person-year. For a subpopulation with an exposure magnitude of \(t = 100\) person-years, the expected count of cases is, by Theorem 6:

\[ \begin{aligned} \mu&= {\lambda}\cdot t && (\text{transformation from event rate to mean}) \\ &= 0.05 \times 100 && (\text{substitute } {\lambda}= 0.05 \text{ and } t = 100) \\ &= 5 \text{ cases} && (\text{evaluate expected count}) \end{aligned} \]

Theorem 7 (No exposure means no expected events) For each exposure magnitude \(t \ge 0\), let \(Y_t\) be the count observed over exposure \(t\). If the mean count is proportional to the exposure magnitude, \({\mathbb{E}\mathopen{}\left[Y_t\right]\mathclose{}} = {\lambda}\cdot t\) for all \(t \ge 0\) with one finite rate \({\lambda}\), then there are no expected events without exposure:

\[{\mathbb{E}\mathopen{}\left[Y_0\right]\mathclose{}} = 0\]

Proof. \[ \begin{aligned} {\mathbb{E}\mathopen{}\left[Y_0\right]\mathclose{}} &= {\lambda}\cdot 0 && (\text{evaluate } {\mathbb{E}\mathopen{}\left[Y_t\right]\mathclose{}} = {\lambda}t \text{ at } t = 0) \\ &= 0 && (\text{multiplication by zero; } {\lambda}\text{ is finite}) \end{aligned} \]

Example 9 (Zero exposure time) If a subject is observed for \(t = 0\) person-years, no follow-up time has elapsed, so under a constant-rate model the expected number of incident events is \({\mathbb{E}\mathopen{}\left[Y_0\right]\mathclose{}} = 0\).

Important

A mean proportional to exposure, \({\mathbb{E}\mathopen{}\left[Y_t\right]\mathclose{}} = {\lambda}t\), has no term that stays nonzero at \(t = 0\): a model of this form says that with no exposure, no events are expected. A mean with an added constant, such as \({\mathbb{E}\mathopen{}\left[Y_t\right]\mathclose{}} = c + {\lambda}t\) with \(c > 0\), would expect \(c\) events even with no exposure. Regression models for counts keep the proportional form when they add covariates (see rme’s count-regression chapter).

Theorem 8 (Exposure is additive on the log scale) If \(\mu= {\lambda}\cdot t\) with \({\lambda}> 0\) and \(t > 0\), then:

\[\log{\mu} = \log{{\lambda}} + \log{t}\]

Proof. \[ \begin{aligned} \log{\mu} &= \log({\lambda}\cdot t) && (\text{substitute } \mu= {\lambda}\cdot t) \\ &= \log{{\lambda}} + \log{t} && (\text{logarithm product rule}) \end{aligned} \]

Example 10 (Log-linear representation of expected counts) If a clinic sees an event rate of \({\lambda}= 0.02\) events/day and \(t = 30\) days of observation:

\[ \begin{aligned} \log{\mu} &= \log(0.02) + \log(30) && (\text{apply log-scale formula}) \\ &= -3.912 + 3.401 && (\text{evaluate natural logarithms}) \\ &= -0.511 && (\text{sum terms}) \end{aligned} \]

Exponentiating yields \(\mu= {\operatorname{exp}\mathopen{}\left\{-0.511\right\}\mathclose{}} \approx 0.60\) expected events.

Definition 5 (Offset) In a model whose linear component contains a term with no unknown coefficient, that term is called an offset: it shifts the linear component by a known amount. In a count model with exposure magnitude \(t\), the offset is the known term \(\log{t}\) in the log-scale decomposition of the mean (8),

\[\log{\mu} = \log{{\lambda}} + \log{t}.\]

Example 11 (The offset for a clinic’s event count) In Example 10, the clinic was observed for \(t = 30\) days, so the offset is \(\log{30} \approx 3.401\). Only \(\log{{\lambda}}\) is unknown before the data are seen; the offset is fixed by the length of observation. A clinic observed for \(t = 60\) days has offset \(\log{60} \approx 4.094\), which raises \(\log{\mu}\) by \(\log{2} \approx 0.693\) at the same event rate.

Theorem 9 (Sum of independent Poisson random variables) If \(X\) and \(Y\) are independent Poisson random variables with means \(\mu_X\) and \(\mu_Y\), their sum, \(Z=X+Y\), is also a Poisson random variable, with mean \(\mu_Z = \mu_X + \mu_Y\).

Proof. The event \(\{Z = z\}\) is the disjoint union of the events \(\{X = k, Y = z - k\}\) for \(k = 0, 1, \ldots, z\) (since \(X\) and \(Y\) are non-negative integers), so:

\[ \begin{aligned} \mathbb{P}(Z = z) &= \sum_{k=0}^z \mathbb{P}(X = k,\, Y = z - k) && (\text{countable additivity}) \\ &= \sum_{k=0}^z \mathbb{P}(X = k) \mathbb{P}(Y = z - k) && (\text{independence}) \\ &= \sum_{k=0}^z \frac{\mu_X^k e^{-\mu_X}}{k!} \frac{\mu_Y^{z-k} e^{-\mu_Y}}{(z-k)!} && (\text{substitute Poisson PMFs}) \\ &= e^{-(\mu_X + \mu_Y)} \sum_{k=0}^z \frac{\mu_X^k \mu_Y^{z-k}}{k!(z-k)!} && (\text{factor out } e^{-\mu_X} e^{-\mu_Y}) \\ &= \frac{e^{-(\mu_X + \mu_Y)}}{z!} \sum_{k=0}^z \frac{z!}{k!(z-k)!} \mu_X^k \mu_Y^{z-k} && (\text{multiply and divide by } z!) \\ &= \frac{e^{-(\mu_X + \mu_Y)}}{z!} (\mu_X + \mu_Y)^z && (\text{binomial theorem}) \end{aligned} \]

This probability expression matches the PMF of a \(\operatorname{Pois}(\mu_X + \mu_Y)\) random variable (see also https://web.stanford.edu/class/archive/cs/cs109/cs109.1206/lectureNotes/LN12_independent_rvs.pdf, Example 3).

Example 12 (Aggregating independent region counts) Suppose Region A records \(X \sim \operatorname{Pois}(\mu_X = 12)\) cases and Region B records \(Y \sim \operatorname{Pois}(\mu_Y = 18)\) cases independently. By Theorem 9, the combined total count \(Z = X + Y\) follows a Poisson distribution:

\[ \begin{aligned} Z &\sim \operatorname{Pois}(\mu_X + \mu_Y) && (\text{sum of independent Poissons}) \\ &= \operatorname{Pois}(12 + 18) && (\text{substitute region means}) \\ &= \operatorname{Pois}(30) && (\text{evaluate sum}) \end{aligned} \]

0.4 The Negative-Binomial distribution

Definition 6 (Negative binomial distribution) A random variable \(Y\) has the negative binomial distribution with mean \(\mu> 0\) and overdispersion parameter \(\rho> 0\), written \(Y \sim \operatorname{NegBin}(\mu, \rho)\) [4], if, for \(y \in {\mathopen{}\left\{0, 1, 2, \dots\right\}\mathclose{}}\):

\[ \mathbb{P}(Y=y) \stackrel{\text{def}}{=}\frac{\mu^y}{y!} \cdot \frac{\Gamma(\rho+ y)}{\Gamma(\rho) \cdot (\rho+ \mu)^y} \cdot \mathopen{}\left(1+\frac{\mu}{\rho}\right)\mathclose{}^{-\rho} \]

where \(\Gamma\) is the gamma function, which satisfies \(\Gamma(x) = (x-1)!\) for positive integers \(x\).

Theorem 10 (The negative binomial converges to the Poisson) Let the population mean be \(\mu> 0\), and let \(Y_\rho\sim \operatorname{NegBin}(\mu, \rho)\). Then for each \(y \in {\mathopen{}\left\{0, 1, 2, \dots\right\}\mathclose{}}\), as \(\rho\rightarrow \infty\), the negative binomial PMF converges to the Poisson PMF (Equation 2):

\[\lim_{\rho\rightarrow \infty} \mathbb{P}(Y_\rho= y) = \frac{\mu^{y} e^{-\mu}}{y!}\]

Proof. Choose a value \(y\) of \(Y_\rho\). In Definition 6, the first factor \(\mu^y / y!\) does not depend on \(\rho\). For the second factor, \(\Gamma(\rho+ y) = \Gamma(\rho) \prod_{k=0}^{y-1} (\rho+ k)\), by applying \(\Gamma(x + 1) = x\,\Gamma(x)\) \(y\) times (for \(y = 0\), the product is empty and equals 1), so:

\[ \begin{aligned} \frac{\Gamma(\rho+ y)}{\Gamma(\rho) \cdot (\rho+ \mu)^y} &= \frac{\Gamma(\rho) \prod_{k=0}^{y-1} (\rho+ k)}{\Gamma(\rho) \cdot (\rho+ \mu)^y} && (\Gamma(x + 1) = x\,\Gamma(x) \text{, applied } y \text{ times}) \\ &= \prod_{k=0}^{y-1} \frac{\rho+ k}{\rho+ \mu} && (\text{cancel } \Gamma(\rho) \text{; one factor of } \rho+ \mu\text{ per } k) \\ &= \prod_{k=0}^{y-1} \frac{1 + k/\rho}{1 + \mu/\rho} && (\text{divide each numerator and denominator by } \rho) \\ &\rightarrow \prod_{k=0}^{y-1} \frac{1 + 0}{1 + 0} && (k/\rho\rightarrow 0 \text{ and } \mu/\rho\rightarrow 0 \text{; finitely many factors}) \\ &= 1 && (\text{simplify}) \end{aligned} \]

For the third factor, write \(x \stackrel{\text{def}}{=}\mu/\rho\), so \(x \rightarrow 0\) as \(\rho\rightarrow \infty\), and \(\rho= \mu/x\):

\[ \begin{aligned} \log\mathopen{}\left(\mathopen{}\left(1 + \frac{\mu}{\rho}\right)\mathclose{}^{-\rho}\right)\mathclose{} &= -\rho\log\mathopen{}\left(1 + \frac{\mu}{\rho}\right)\mathclose{} && (\text{log of a power}) \\ &= -\mu\cdot \frac{\log(1 + x)}{x} && (\text{substitute } \rho= \mu/x) \\ &\rightarrow -\mu\cdot 1 && (\textstyle\lim_{x \rightarrow 0} \log(1 + x)/x = 1 \text{, the derivative of } \log(1 + x) \text{ at } x = 0) \\ &= -\mu && (\text{simplify}) \end{aligned} \]

so, since the exponential function is continuous, \(\mathopen{}\left(1 + \mu/\rho\right)\mathclose{}^{-\rho} \rightarrow {\operatorname{exp}\mathopen{}\left\{-\mu\right\}\mathclose{}}\). Each of the three factors has a limit, so their product does too:

\[ \begin{aligned} \lim_{\rho\rightarrow \infty} \mathbb{P}(Y_\rho= y) &= \frac{\mu^y}{y!} \cdot 1 \cdot {\operatorname{exp}\mathopen{}\left\{-\mu\right\}\mathclose{}} && (\text{limit of a product of convergent factors}) \\ &= \frac{\mu^{y} e^{-\mu}}{y!} && (\text{rearrange}) \end{aligned} \]

which is the \(\operatorname{Pois}(\mu)\) PMF.

Theorem 11 (Mean and variance of the negative binomial distribution) If \(Y \sim \operatorname{NegBin}(\mu, \rho)\), then:

  • \(\mathbb{E}[Y] = \mu\)
  • \({\operatorname{Var}\mathopen{}\left(Y\right)\mathclose{}} = \mu+ \frac{\mu^2}{\rho} > \mu\)

Proof. The negative binomial distribution is a gamma mixture of Poisson distributions: if \(\Lambda\) has the gamma density \(g({\lambda}) = \frac{(\rho/\mu)^\rho}{\Gamma(\rho)} {\lambda}^{\rho- 1} e^{-\rho{\lambda}/\mu}\) for \({\lambda}> 0\), which has mean \(\mu\) and variance \(\mu^2/\rho\) [2], and \(Y \mid \Lambda= {\lambda}\sim \operatorname{Pois}({\lambda})\), then \(Y \sim \operatorname{NegBin}(\mu, \rho)\). To check this, integrate the joint density over \({\lambda}\):

\[ \begin{aligned} \mathbb{P}(Y = y) &= \int_0^\infty \frac{{\lambda}^y e^{-{\lambda}}}{y!} \cdot\frac{(\rho/\mu)^\rho}{\Gamma(\rho)} {\lambda}^{\rho- 1} e^{-\rho{\lambda}/\mu}\,d{\lambda} && (\text{marginalize over } \Lambda) \\ &= \frac{(\rho/\mu)^\rho}{y!\,\Gamma(\rho)} \int_0^\infty {\lambda}^{y + \rho- 1} e^{-{\lambda}(1 + \rho/\mu)}\,d{\lambda} && (\text{collect powers of } {\lambda}\text{ and exponents}) \\ &= \frac{(\rho/\mu)^\rho}{y!\,\Gamma(\rho)} \cdot\frac{\Gamma(y + \rho)}{(1 + \rho/\mu)^{y + \rho}} && (\textstyle\int_0^\infty {\lambda}^{a-1} e^{-b{\lambda}}\,d{\lambda}= \Gamma(a)/b^a) \\ &= \frac{\Gamma(y + \rho)}{y!\,\Gamma(\rho)} \mathopen{}\left(\frac{\rho}{\mu}\right)\mathclose{}^\rho\mathopen{}\left(\frac{\mu}{\mu+ \rho}\right)\mathclose{}^{y + \rho} && (1 + \rho/\mu= (\mu+ \rho)/\mu) \\ &= \frac{\Gamma(y + \rho)}{y!\,\Gamma(\rho)} \mathopen{}\left(\frac{\rho}{\mu+ \rho}\right)\mathclose{}^{\rho} \mathopen{}\left(\frac{\mu}{\mu+ \rho}\right)\mathclose{}^{y} && (\text{combine the } \mu^\rho\text{ factors}) \\ &= \frac{\mu^y}{y!} \cdot\frac{\Gamma(\rho+ y)}{\Gamma(\rho)\,(\rho+ \mu)^y} \cdot\mathopen{}\left(1 + \frac{\mu}{\rho}\right)\mathclose{}^{-\rho} && (\text{rearrange into the form of the definition}) \end{aligned} \]

Then, by the law of iterated expectations and the law of total variance, using

\[ \begin{aligned} {\mathbb{E}\mathopen{}\left[Y \mid \Lambda\right]\mathclose{}} &= \operatorname{Var}(Y \mid \Lambda) \\ &= \Lambda \end{aligned} \]

(Theorem 4):

\[ \begin{aligned} \mathbb{E}[Y] &= {\mathbb{E}\mathopen{}\left[{\mathbb{E}\mathopen{}\left[Y \mid \Lambda\right]\mathclose{}}\right]\mathclose{}} && (\text{law of iterated expectations}) \\ &= {\mathbb{E}\mathopen{}\left[\Lambda\right]\mathclose{}} && ({\mathbb{E}\mathopen{}\left[Y \mid \Lambda\right]\mathclose{}} = \Lambda) \\ &= \mu && (\text{mean of the gamma distribution}) \\ {\operatorname{Var}\mathopen{}\left(Y\right)\mathclose{}} &= {\mathbb{E}\mathopen{}\left[{\operatorname{Var}\mathopen{}\left(Y \mid \Lambda\right)\mathclose{}}\right]\mathclose{}} + {\operatorname{Var}\mathopen{}\left({\mathbb{E}\mathopen{}\left[Y \mid \Lambda\right]\mathclose{}}\right)\mathclose{}} && (\text{law of total variance}) \\ &= {\mathbb{E}\mathopen{}\left[\Lambda\right]\mathclose{}} + {\operatorname{Var}\mathopen{}\left(\Lambda\right)\mathclose{}} && ({\operatorname{Var}\mathopen{}\left(Y \mid \Lambda\right)\mathclose{}} = \Lambda\text{ and } {\mathbb{E}\mathopen{}\left[Y \mid \Lambda\right]\mathclose{}} = \Lambda) \\ &= \mu+ \frac{\mu^2}{\rho} && (\text{mean and variance of the gamma distribution}) \end{aligned} \]

and \(\mu^2/\rho> 0\) gives \({\operatorname{Var}\mathopen{}\left(Y\right)\mathclose{}} > \mu\).

Example 13 (Overdispersion relative to the Poisson) With \(\mu= 4\) and \(\rho= 2\),

\[ \begin{aligned} {\operatorname{Var}\mathopen{}\left(Y\right)\mathclose{}} &= 4 + 16/2 \\ &= 12, \end{aligned} \]

three times the variance of a \(\operatorname{Pois}(4)\) count with the same mean.

0.5 The Laplace distribution

Definition 7 (Laplace distribution) A random variable \(Y\) has the Laplace distribution with location parameter \(\mu\in \mathbb{R}\) and scale parameter \(b > 0\), written \(Y \sim {\operatorname{Laplace}\mathopen{}\left(\mu, b\right)\mathclose{}}\) [5], if \(Y\) is continuous with density:

\[\mathbb{p}(Y=y) \stackrel{\text{def}}{=}\frac{1}{2b} \text{e}^{-\frac{\mathopen{}\left|y - \mu\right|\mathclose{}}{b}}, \quad y \in \mathbb{R} \tag{6}\]

Example 14 (Laplace density values) Let \(Y \sim {\operatorname{Laplace}\mathopen{}\left(3, 2\right)\mathclose{}}\), so \(\mu= 3\) and \(b = 2\) (Definition 7). At the location, \(\mathopen{}\left|y - \mu\right|\mathclose{} = 0\), so the density is \(\frac{1}{2b}\). At a point \(y = 5\), the distance is

\[ \begin{aligned} \mathopen{}\left|5 - 3\right|\mathclose{} &= 2 \\ &= b, \end{aligned} \]

so the density is \(\frac{1}{2b}\text{e}^{-1}\). Here are both values:

b <- 2
c(
  at_mu = 1 / (2 * b),
  at_mu_plus_2 = exp(-1) / (2 * b)
) |>
  round(3)
#>        at_mu at_mu_plus_2 
#>        0.250        0.092

The density at \(\mu+ b\) is the density at \(\mu\) times \(\text{e}^{-1}\), and the same holds at \(\mu- b\), because the density depends only on the distance from \(\mu\).

Theorem 12 (Mean and variance of the Laplace distribution) If \(Y \sim {\operatorname{Laplace}\mathopen{}\left(\mu, b\right)\mathclose{}}\) (Definition 7), then

\[{\mathbb{E}\mathopen{}\left[Y\right]\mathclose{}} = \mu\quad \text{and} \quad {\operatorname{Var}\mathopen{}\left(Y\right)\mathclose{}} = 2b^2. \tag{7}\]

Proof. Write \(U = Y - \mu\). By Equation 6, \(U\) has density \(\frac{1}{2b}\text{e}^{-\mathopen{}\left|u\right|\mathclose{}/b}\), which is symmetric about \(0\).

For the mean, the integrand \(u \cdot \frac{1}{2b}\text{e}^{-\mathopen{}\left|u\right|\mathclose{}/b}\) is an odd function, so its integral over \(\mathbb{R}\) is \(0\). Therefore \({\mathbb{E}\mathopen{}\left[U\right]\mathclose{}} = 0\), and

\[ \begin{aligned} {\mathbb{E}\mathopen{}\left[Y\right]\mathclose{}} &= \mu+ {\mathbb{E}\mathopen{}\left[U\right]\mathclose{}} \\ &= \mu. \end{aligned} \]

For the variance,

\[ \begin{aligned} {\operatorname{Var}\mathopen{}\left(Y\right)\mathclose{}} &= {\operatorname{Var}\mathopen{}\left(U\right)\mathclose{}} \\ &= {\mathbb{E}\mathopen{}\left[U^2\right]\mathclose{}} \end{aligned} \]

because \({\mathbb{E}\mathopen{}\left[U\right]\mathclose{}} = 0\). The integrand \(u^2 \cdot \frac{1}{2b}\text{e}^{-\mathopen{}\left|u\right|\mathclose{}/b}\) is even, so

\[ \begin{aligned} {\mathbb{E}\mathopen{}\left[U^2\right]\mathclose{}} &= 2 \int_0^\infty u^2 \frac{1}{2b} \text{e}^{-u/b} \, du && \text{(even integrand)} \\ &= \frac{1}{b} \int_0^\infty u^2 \text{e}^{-u/b} \, du && \text{(multiplying the constants)} \\ &= \frac{1}{b} \mathopen{}\left(2b \int_0^\infty u \text{e}^{-u/b} \, du\right)\mathclose{} && \text{(integration by parts; the boundary terms are $0$)} \\ &= \frac{1}{b} \mathopen{}\left(2b \cdot b^2\right)\mathclose{} && \text{(integration by parts again; the boundary terms are $0$)} \\ &= 2b^2. && \text{(multiplying the constants)} \end{aligned} \]

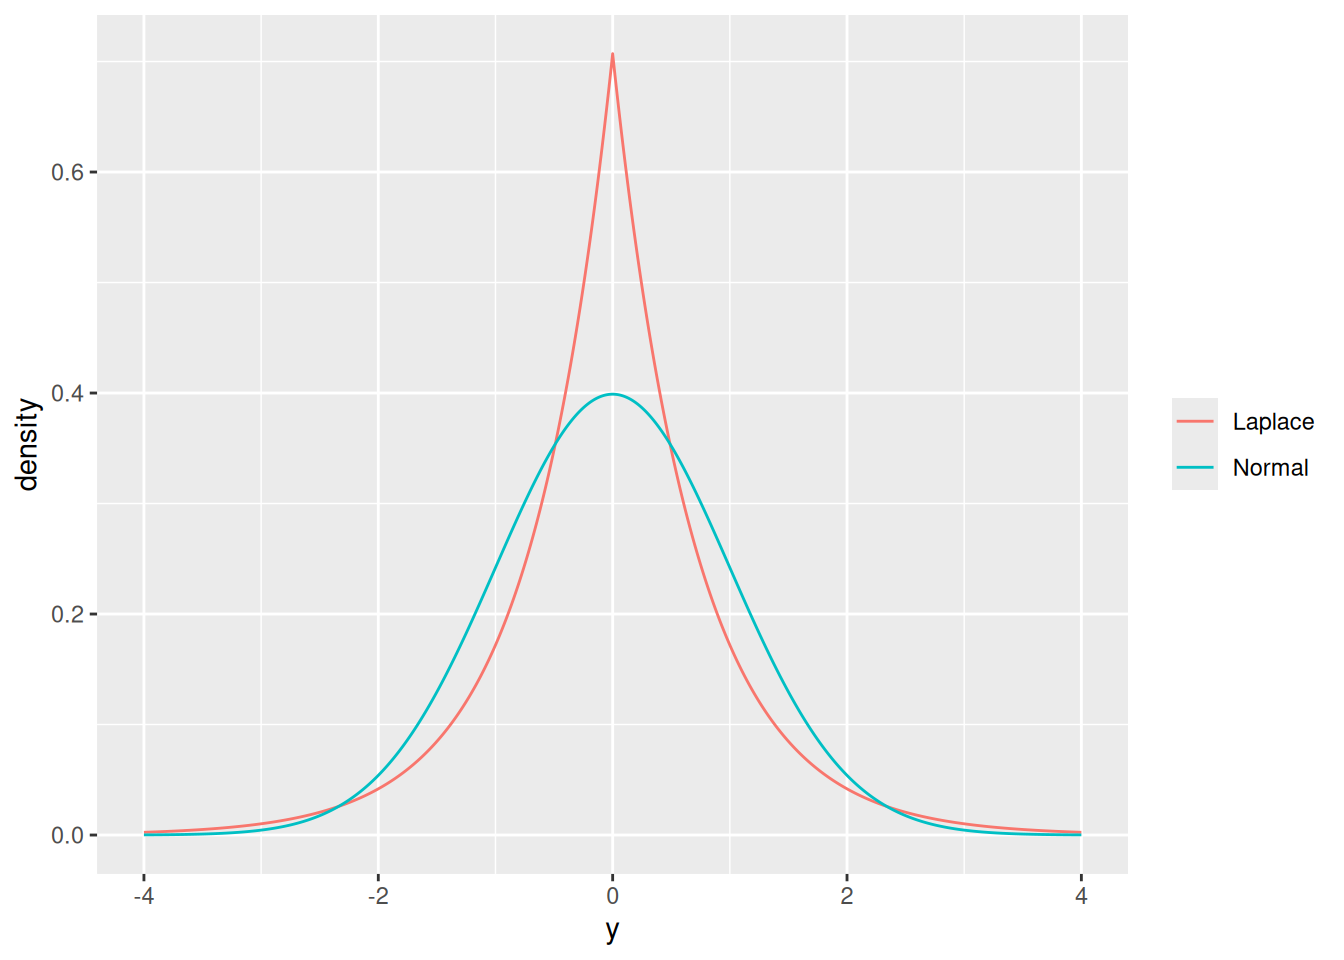
Example 15 (Laplace and normal tails with the same mean and variance) A Laplace variable \(Y \sim {\operatorname{Laplace}\mathopen{}\left(0, b\right)\mathclose{}}\) has variance \(2b^2\) (Theorem 12). Choosing \(b = 1/\sqrt{2}\) gives variance \(1\), the same mean and variance as a standard normal. Figure 3 compares the two densities. The Laplace density is higher at the center and in the far tails, and lower in between.

[Code]
b <- 1 / sqrt(2)
grid <- seq(-4, 4, length.out = 801)
dlaplace <- function(y, mu = 0, b = 1) exp(-abs(y - mu) / b) / (2 * b)
densities <- tibble::tibble(
  y = rep(grid, times = 2),
  distribution = rep(c("Laplace", "Normal"), each = length(grid)),
  density = c(dlaplace(grid, b = b), dnorm(grid))
)
ggplot2::ggplot(densities) +
  ggplot2::aes(x = y, y = density, colour = distribution) +
  ggplot2::geom_line() +
  ggplot2::labs(colour = NULL)
Figure 3: Laplace and standard normal densities with the same mean (0) and variance (1)
Two symmetric curves over y from minus 4 to 4. The standard normal is a smooth bell. The Laplace curve with the same variance peaks higher at 0 with a sharp point, falls below the normal curve at moderate distances, and stays above it in the far tails.

The probability of landing more than \(3\) standard deviations from the mean shows the difference in the tails. For the Laplace distribution, \(\mathbb{P}(\mathopen{}\left|Y\right|\mathclose{} > t) = \text{e}^{-t/b}\), because each tail has probability \(\frac{1}{2}\text{e}^{-t/b}\) by integrating Equation 6.

t <- 3
c(
  Laplace = exp(-t / b),
  Normal = 2 * pnorm(-t)
)
#>     Laplace      Normal 
#> 0.014369596 0.002699796

The Laplace distribution puts about 5.3 times as much probability beyond \(3\) standard deviations as the normal distribution does.

0.6 Weibull distribution

Definition 8 (Weibull distribution) A non-negative random variable \(T\) has the Weibull distribution with shape \(\alpha> 0\) and rate \({\lambda}> 0\) [6] if its survival function is:

\[\mathbb{S}(t) \stackrel{\text{def}}{=}\text{e}^{-{\lambda}t^\alpha}, \quad t \ge 0\]

Theorem 13 (Weibull density and hazard) If \(T\) has the Weibull distribution with shape \(\alpha\) and rate \({\lambda}\), then for \(t > 0\):

\[ \begin{aligned} f(t) &= \alpha{\lambda}t^{\alpha-1}\text{e}^{-{\lambda}t^\alpha}\\ \mathbb{h}(t) &= \alpha{\lambda}t^{\alpha-1} \end{aligned} \]

Proof. The CDF of \(T\) is \(F(t) = 1 - \mathbb{S}(t)\) (survival function and CDF), which is \(0\) for \(t < 0\) and \(1 - \text{e}^{-{\lambda}t^\alpha}\) for \(t \ge 0\). This \(F\) is continuous everywhere, with a continuous derivative everywhere except possibly \(t = 0\), so

\[ \begin{aligned} f &= F' \\ &= -\mathbb{S}' \end{aligned} \]

is a density of \(T\) (a piecewise-smooth CDF has its derivative as a density). This density is continuous at every \(t > 0\), so there the hazard is \(f(t)/\mathbb{S}(t)\) (hazard equals density over survival):

\[ \begin{aligned} f(t) &= -\frac{d}{dt}\text{e}^{-{\lambda}t^\alpha} && (f = -\mathbb{S}') \\ &= \alpha{\lambda}t^{\alpha-1}\text{e}^{-{\lambda}t^\alpha} && (\text{chain rule}) \\ \mathbb{h}(t) &= \frac{\alpha{\lambda}t^{\alpha-1}\text{e}^{-{\lambda}t^\alpha}}{\text{e}^{-{\lambda}t^\alpha}} && (\text{hazard is density over survival}) \\ &= \alpha{\lambda}t^{\alpha-1} && (\text{cancel}) \end{aligned} \]

Theorem 14 (Weibull mean) If \(T\) has the Weibull distribution with shape \(\alpha\) and rate \({\lambda}\), then:

\[{\mathbb{E}\mathopen{}\left[T\right]\mathclose{}} = \Gamma(1+1/\alpha)\cdot {\lambda}^{-1/\alpha}\]

Proof. For the mean, use the survival-function formula for the mean and substitute \(u = {\lambda}t^\alpha\), so that \(t = (u/{\lambda})^{1/\alpha}\) and \(dt = \frac{1}{\alpha}{\lambda}^{-1/\alpha} u^{1/\alpha- 1}\,du\):

\[ \begin{aligned} {\mathbb{E}\mathopen{}\left[T\right]\mathclose{}} &= \int_0^\infty \text{e}^{-{\lambda}t^\alpha}\,dt && (\text{expectation via the survival function}) \\ &= \frac{1}{\alpha}{\lambda}^{-1/\alpha} \int_0^\infty u^{1/\alpha- 1} \text{e}^{-u}\,du && (\text{substitute } u = {\lambda}t^\alpha) \\ &= \frac{1}{\alpha}{\lambda}^{-1/\alpha}\,\Gamma(1/\alpha) && (\text{definition of the gamma function}) \\ &= \Gamma(1 + 1/\alpha)\,{\lambda}^{-1/\alpha} && (\Gamma(1 + a) = a\,\Gamma(a)) \end{aligned} \]

Corollary 1 (The Weibull with shape 1 is the exponential) If \(T\) has the Weibull distribution with shape \(\alpha= 1\) and rate \({\lambda}\), then \(T\) has the exponential distribution with rate \({\lambda}\).

Proof. By Theorem 13 with \(\alpha= 1\), for \(t > 0\):

\[ \begin{aligned} f(t) &= \alpha{\lambda}t^{\alpha-1}\text{e}^{-{\lambda}t^\alpha} && (\text{Weibull density}) \\ &= 1 \cdot {\lambda}t^{0}\text{e}^{-{\lambda}t^1} && (\text{substitute } \alpha= 1) \\ &= {\lambda}\text{e}^{-{\lambda}t} && (t^0 = 1 \text{ and } t^1 = t) \end{aligned} \]

and \(f(t) = 0\) for \(t < 0\), since \(T\) is non-negative. This density matches the exponential density at every \(t \ne 0\). Changing a density at the single point \(t = 0\) does not change its integral over any set, so \(T\) has the exponential distribution with rate \({\lambda}\).

Corollary 2 (The Weibull shape sets the direction of the hazard) If \(T\) has the Weibull distribution with shape \(\alpha\) and rate \({\lambda}\), then on \(t > 0\) its hazard \(\mathbb{h}(t)\) is:

  • strictly increasing if \(\alpha> 1\)
  • constant if \(\alpha= 1\)
  • strictly decreasing if \(\alpha< 1\)

Proof. By Theorem 13, \(\mathbb{h}(t) = \alpha{\lambda}t^{\alpha-1}\) for \(t > 0\), so:

\[ \begin{aligned} \frac{d}{dt}\mathbb{h}(t) &= \frac{d}{dt} \alpha{\lambda}t^{\alpha-1} && (\text{Weibull hazard}) \\ &= \alpha(\alpha- 1){\lambda}t^{\alpha-2} && (\text{power rule}) \end{aligned} \]

For \(t > 0\), the factors \(\alpha\), \({\lambda}\), and \(t^{\alpha-2}\) are all positive, so \(\frac{d}{dt}\mathbb{h}(t)\) has the sign of \(\alpha- 1\): positive for \(\alpha> 1\), zero for \(\alpha= 1\), and negative for \(\alpha< 1\). A function with a positive (negative) derivative on an interval is strictly increasing (decreasing) there, and one with a zero derivative is constant.

Example 16 (Exponential as a special case) With \(\alpha= 1\), Theorem 13 gives \(\mathbb{h}(t) = {\lambda}\) and

\[ \begin{aligned} {\mathbb{E}\mathopen{}\left[T\right]\mathclose{}} &= \Gamma(2){\lambda}^{-1} \\ &= 1/{\lambda}, \end{aligned} \]

matching the exponential distribution’s constant hazard and mean. With \(\alpha= 2\) and \({\lambda}= 1\), \(\mathbb{h}(t) = 2t\) increases with \(t\), and

\[ \begin{aligned} {\mathbb{E}\mathopen{}\left[T\right]\mathclose{}} &= \Gamma(3/2) \\ &= \sqrt{\pi}/2 \\ &\approx 0.886. \end{aligned} \]

0.7 The multivariate normal distribution

Definition 9 (Multivariate normal distribution (multivariate Gaussian distribution)) A \(p \times 1\) random vector \(\mathord{\smash[b]{\underset{\raise.3ex\hbox{$\scriptstyle\sim$}}{X}}\vphantom{X}}= {(X_1, \ldots, X_p)}^{\top}\) has the multivariate normal distribution (or multivariate Gaussian distribution) with mean parameter \(\mathord{\smash[b]{\underset{\raise.3ex\hbox{$\scriptstyle\sim$}}{\mu}}\vphantom{\mu}} \in \mathbb{R}^p\) and variance parameter \(\mathbf{\Sigma}\), a \(p \times p\) positive definite matrix, written \(\mathord{\smash[b]{\underset{\raise.3ex\hbox{$\scriptstyle\sim$}}{X}}\vphantom{X}}\sim \operatorname{N}_p\mathopen{}\left(\mathord{\smash[b]{\underset{\raise.3ex\hbox{$\scriptstyle\sim$}}{\mu}}\vphantom{\mu}}, \mathbf{\Sigma}\right)\mathclose{}\), if \(\mathord{\smash[b]{\underset{\raise.3ex\hbox{$\scriptstyle\sim$}}{X}}\vphantom{X}}\) has joint density:

\[ \mathbb{p}(\mathord{\smash[b]{\underset{\raise.3ex\hbox{$\scriptstyle\sim$}}{X}}\vphantom{X}}= \mathord{\smash[b]{\underset{\raise.3ex\hbox{$\scriptstyle\sim$}}{x}}\vphantom{x}}) \stackrel{\text{def}}{=} \frac{1}{(2\pi)^{p/2} \det(\mathbf{\Sigma})^{1/2}} \text{e}^{-\frac{1}{2} {(\mathord{\smash[b]{\underset{\raise.3ex\hbox{$\scriptstyle\sim$}}{x}}\vphantom{x}}- \mathord{\smash[b]{\underset{\raise.3ex\hbox{$\scriptstyle\sim$}}{\mu}}\vphantom{\mu}})}^{\top} \mathbf{\Sigma}^{-1} (\mathord{\smash[b]{\underset{\raise.3ex\hbox{$\scriptstyle\sim$}}{x}}\vphantom{x}}- \mathord{\smash[b]{\underset{\raise.3ex\hbox{$\scriptstyle\sim$}}{\mu}}\vphantom{\mu}})}, \quad \mathord{\smash[b]{\underset{\raise.3ex\hbox{$\scriptstyle\sim$}}{x}}\vphantom{x}}\in \mathbb{R}^p \]

where \(\det(\mathbf{\Sigma})\) is the determinant of \(\mathbf{\Sigma}\) and \(\mathbf{\Sigma}^{-1}\) is its inverse.

Theorem 15 (The multivariate normal density integrates to 1) If \(\mathord{\smash[b]{\underset{\raise.3ex\hbox{$\scriptstyle\sim$}}{X}}\vphantom{X}}\sim \operatorname{N}_p\mathopen{}\left(\mathord{\smash[b]{\underset{\raise.3ex\hbox{$\scriptstyle\sim$}}{\mu}}\vphantom{\mu}}, \mathbf{\Sigma}\right)\mathclose{}\) (Definition 9), then the density in Definition 9 integrates to 1 over \(\mathbb{R}^p\).

Theorem 16 (The mean and variance of the multivariate normal distribution) If \(\mathord{\smash[b]{\underset{\raise.3ex\hbox{$\scriptstyle\sim$}}{X}}\vphantom{X}}\sim \operatorname{N}_p\mathopen{}\left(\mathord{\smash[b]{\underset{\raise.3ex\hbox{$\scriptstyle\sim$}}{\mu}}\vphantom{\mu}}, \mathbf{\Sigma}\right)\mathclose{}\) (Definition 9), then \(\mathbb{E}\mathord{\smash[b]{\underset{\raise.3ex\hbox{$\scriptstyle\sim$}}{X}}\vphantom{X}}= \mathord{\smash[b]{\underset{\raise.3ex\hbox{$\scriptstyle\sim$}}{\mu}}\vphantom{\mu}}\) (the expectation of a random vector), and \({\operatorname{Var}\mathopen{}\left(\mathord{\smash[b]{\underset{\raise.3ex\hbox{$\scriptstyle\sim$}}{X}}\vphantom{X}}\right)\mathclose{}} = \mathbf{\Sigma}\) (the variance of a random vector).

Example 17 (The univariate normal is the case \(p = 1\)) With \(p = 1\), \(\mathord{\smash[b]{\underset{\raise.3ex\hbox{$\scriptstyle\sim$}}{\mu}}\vphantom{\mu}} = (\mu)\), and \(\mathbf{\Sigma} = (\sigma^2)\) for \(\sigma^2> 0\), \(\det(\mathbf{\Sigma}) = \sigma^2\) (determinant, \(p = 1\)) and \(\mathbf{\Sigma}^{-1} = (1/\sigma^2)\), so:

\[ \begin{aligned} \mathbb{p}(\mathord{\smash[b]{\underset{\raise.3ex\hbox{$\scriptstyle\sim$}}{X}}\vphantom{X}}= \mathord{\smash[b]{\underset{\raise.3ex\hbox{$\scriptstyle\sim$}}{x}}\vphantom{x}}) &= \frac{1}{(2\pi)^{1/2} (\sigma^2)^{1/2}} \text{e}^{-\frac{1}{2} (x - \mu) \frac{1}{\sigma^2} (x - \mu)} && \text{(substitute into the multivariate normal density)} \\ &= \frac{1}{\sigma\sqrt{2\pi}} \text{e}^{-\frac{(x - \mu)^2}{2\sigma^2}} && \text{(simplify)} \end{aligned} \]

which is the normal density \({\operatorname{N}\mathopen{}\left(\mu, \sigma^2\right)\mathclose{}}\).

Lemma 1 (The quadratic form in the multivariate normal density is non-negative) If \(\mathbf{\Sigma}\) is a \(p \times p\) positive definite matrix and \(\mathord{\smash[b]{\underset{\raise.3ex\hbox{$\scriptstyle\sim$}}{x}}\vphantom{x}}, \mathord{\smash[b]{\underset{\raise.3ex\hbox{$\scriptstyle\sim$}}{\mu}}\vphantom{\mu}} \in \mathbb{R}^p\), then

\[{(\mathord{\smash[b]{\underset{\raise.3ex\hbox{$\scriptstyle\sim$}}{x}}\vphantom{x}}- \mathord{\smash[b]{\underset{\raise.3ex\hbox{$\scriptstyle\sim$}}{\mu}}\vphantom{\mu}})}^{\top} \mathbf{\Sigma}^{-1} (\mathord{\smash[b]{\underset{\raise.3ex\hbox{$\scriptstyle\sim$}}{x}}\vphantom{x}}- \mathord{\smash[b]{\underset{\raise.3ex\hbox{$\scriptstyle\sim$}}{\mu}}\vphantom{\mu}}) \ge 0,\]

with equality if and only if \(\mathord{\smash[b]{\underset{\raise.3ex\hbox{$\scriptstyle\sim$}}{x}}\vphantom{x}}= \mathord{\smash[b]{\underset{\raise.3ex\hbox{$\scriptstyle\sim$}}{\mu}}\vphantom{\mu}}\).

Proof. \(\mathbf{\Sigma}^{-1}\) is positive definite (positive definite inverse). If \(\mathord{\smash[b]{\underset{\raise.3ex\hbox{$\scriptstyle\sim$}}{x}}\vphantom{x}}\neq \mathord{\smash[b]{\underset{\raise.3ex\hbox{$\scriptstyle\sim$}}{\mu}}\vphantom{\mu}}\), then \(\mathord{\smash[b]{\underset{\raise.3ex\hbox{$\scriptstyle\sim$}}{x}}\vphantom{x}}- \mathord{\smash[b]{\underset{\raise.3ex\hbox{$\scriptstyle\sim$}}{\mu}}\vphantom{\mu}} \neq \mathord{\smash[b]{\underset{\raise.3ex\hbox{$\scriptstyle\sim$}}{0}}\vphantom{0}}\), so the quadratic form is positive by the definition of positive definite. If \(\mathord{\smash[b]{\underset{\raise.3ex\hbox{$\scriptstyle\sim$}}{x}}\vphantom{x}}= \mathord{\smash[b]{\underset{\raise.3ex\hbox{$\scriptstyle\sim$}}{\mu}}\vphantom{\mu}}\), then \(\mathord{\smash[b]{\underset{\raise.3ex\hbox{$\scriptstyle\sim$}}{x}}\vphantom{x}}- \mathord{\smash[b]{\underset{\raise.3ex\hbox{$\scriptstyle\sim$}}{\mu}}\vphantom{\mu}} = \mathord{\smash[b]{\underset{\raise.3ex\hbox{$\scriptstyle\sim$}}{0}}\vphantom{0}}\), and the quadratic form is \(0\).

Definition 10 (Mahalanobis distance) For a \(p \times p\) positive definite matrix \(\mathbf{\Sigma}\) and \(\mathord{\smash[b]{\underset{\raise.3ex\hbox{$\scriptstyle\sim$}}{x}}\vphantom{x}}, \mathord{\smash[b]{\underset{\raise.3ex\hbox{$\scriptstyle\sim$}}{\mu}}\vphantom{\mu}} \in \mathbb{R}^p\), the Mahalanobis distance from \(\mathord{\smash[b]{\underset{\raise.3ex\hbox{$\scriptstyle\sim$}}{x}}\vphantom{x}}\) to \(\mathord{\smash[b]{\underset{\raise.3ex\hbox{$\scriptstyle\sim$}}{\mu}}\vphantom{\mu}}\) with respect to \(\mathbf{\Sigma}\) is:

\[ \Delta(\mathord{\smash[b]{\underset{\raise.3ex\hbox{$\scriptstyle\sim$}}{x}}\vphantom{x}}) \stackrel{\text{def}}{=}\sqrt{{(\mathord{\smash[b]{\underset{\raise.3ex\hbox{$\scriptstyle\sim$}}{x}}\vphantom{x}}- \mathord{\smash[b]{\underset{\raise.3ex\hbox{$\scriptstyle\sim$}}{\mu}}\vphantom{\mu}})}^{\top} \mathbf{\Sigma}^{-1} (\mathord{\smash[b]{\underset{\raise.3ex\hbox{$\scriptstyle\sim$}}{x}}\vphantom{x}}- \mathord{\smash[b]{\underset{\raise.3ex\hbox{$\scriptstyle\sim$}}{\mu}}\vphantom{\mu}})} \]

Corollary 3 (The multivariate normal density decreases with Mahalanobis distance) If \(\mathord{\smash[b]{\underset{\raise.3ex\hbox{$\scriptstyle\sim$}}{X}}\vphantom{X}}\sim \operatorname{N}_p\mathopen{}\left(\mathord{\smash[b]{\underset{\raise.3ex\hbox{$\scriptstyle\sim$}}{\mu}}\vphantom{\mu}}, \mathbf{\Sigma}\right)\mathclose{}\), then:

\[ \mathbb{p}(\mathord{\smash[b]{\underset{\raise.3ex\hbox{$\scriptstyle\sim$}}{X}}\vphantom{X}}= \mathord{\smash[b]{\underset{\raise.3ex\hbox{$\scriptstyle\sim$}}{x}}\vphantom{x}}) = \frac{1}{(2\pi)^{p/2} \det(\mathbf{\Sigma})^{1/2}} \text{e}^{-\frac{\Delta(\mathord{\smash[b]{\underset{\raise.3ex\hbox{$\scriptstyle\sim$}}{x}}\vphantom{x}})^2}{2}} \]

where \(\Delta\) is the Mahalanobis distance to \(\mathord{\smash[b]{\underset{\raise.3ex\hbox{$\scriptstyle\sim$}}{\mu}}\vphantom{\mu}}\) with respect to \(\mathbf{\Sigma}\) (Definition 10). So the density is highest at \(\mathord{\smash[b]{\underset{\raise.3ex\hbox{$\scriptstyle\sim$}}{x}}\vphantom{x}}= \mathord{\smash[b]{\underset{\raise.3ex\hbox{$\scriptstyle\sim$}}{\mu}}\vphantom{\mu}}\), decreases as \(\Delta(\mathord{\smash[b]{\underset{\raise.3ex\hbox{$\scriptstyle\sim$}}{x}}\vphantom{x}})\) increases, and is the same at every \(\mathord{\smash[b]{\underset{\raise.3ex\hbox{$\scriptstyle\sim$}}{x}}\vphantom{x}}\) with the same \(\Delta(\mathord{\smash[b]{\underset{\raise.3ex\hbox{$\scriptstyle\sim$}}{x}}\vphantom{x}})\).

Proof. Substitute Definition 10 into Definition 9. The function \(\delta\mapsto \text{e}^{-\delta^2/2}\) decreases on \(\delta\ge 0\), and by Lemma 1, \(\Delta(\mathord{\smash[b]{\underset{\raise.3ex\hbox{$\scriptstyle\sim$}}{x}}\vphantom{x}}) = 0\) only at \(\mathord{\smash[b]{\underset{\raise.3ex\hbox{$\scriptstyle\sim$}}{x}}\vphantom{x}}= \mathord{\smash[b]{\underset{\raise.3ex\hbox{$\scriptstyle\sim$}}{\mu}}\vphantom{\mu}}\).

Example 18 (Mahalanobis distance for diagonal variance matrices) If \(\mathbf{\Sigma}\) is diagonal with diagonal elements \(\sigma^2_1, \ldots, \sigma^2_p\), all positive, then \(\mathbf{\Sigma}^{-1}\) is diagonal with diagonal elements \(1/\sigma^2_1, \ldots, 1/\sigma^2_p\) (multiplying the two gives \(\mathbf{I}_p\); matrix inverse), so:

\[ \Delta(\mathord{\smash[b]{\underset{\raise.3ex\hbox{$\scriptstyle\sim$}}{x}}\vphantom{x}})^2 = \sum_{i=1}^p\frac{(x_i - \mu_i)^2}{\sigma^2_i} \]

Two special cases:

  • If \(\mathbf{\Sigma} = \mathbf{I}_p\), then \(\Delta(\mathord{\smash[b]{\underset{\raise.3ex\hbox{$\scriptstyle\sim$}}{x}}\vphantom{x}})^2 = \sum_{i=1}^p(x_i - \mu_i)^2\), so the Mahalanobis distance is the ordinary (Euclidean) distance.
  • If \(\mathbf{\Sigma} = \sigma^2\mathbf{I}_p\), then \(\Delta(\mathord{\smash[b]{\underset{\raise.3ex\hbox{$\scriptstyle\sim$}}{x}}\vphantom{x}})\) is the Euclidean distance divided by \(\sigma\).

In general, each coordinate’s difference is measured in units of that coordinate’s standard deviation.

Theorem 17 (A multivariate normal vector with diagonal variance has independent normal components) If \(\mathord{\smash[b]{\underset{\raise.3ex\hbox{$\scriptstyle\sim$}}{X}}\vphantom{X}}\sim \operatorname{N}_p\mathopen{}\left(\mathord{\smash[b]{\underset{\raise.3ex\hbox{$\scriptstyle\sim$}}{\mu}}\vphantom{\mu}}, \mathbf{\Sigma}\right)\mathclose{}\) and \(\mathbf{\Sigma}\) is diagonal with diagonal elements \(\sigma^2_1, \ldots, \sigma^2_p\), then:

  • the joint density of \(\mathord{\smash[b]{\underset{\raise.3ex\hbox{$\scriptstyle\sim$}}{X}}\vphantom{X}}\) is the product of the normal densities \({\operatorname{N}\mathopen{}\left(\mu_i, \sigma^2_i\right)\mathclose{}}\), \(i = 1, \ldots, p\),
  • each \(X_i \sim {\operatorname{N}\mathopen{}\left(\mu_i, \sigma^2_i\right)\mathclose{}}\), and
  • \(X_1, \ldots, X_p\) are independent.

Proof. By the determinant of a diagonal matrix, \(\det(\mathbf{\Sigma}) = \prod_{i=1}^p \sigma^2_i\), so \(\det(\mathbf{\Sigma})^{1/2} = \prod_{i=1}^p \sigma_i\). Using Example 18 for the quadratic form:

\[ \begin{aligned} \mathbb{p}(\mathord{\smash[b]{\underset{\raise.3ex\hbox{$\scriptstyle\sim$}}{X}}\vphantom{X}}= \mathord{\smash[b]{\underset{\raise.3ex\hbox{$\scriptstyle\sim$}}{x}}\vphantom{x}}) &= \frac{1}{(2\pi)^{p/2} \prod_{i=1}^p \sigma_i} \text{e}^{-\frac{1}{2} \sum_{i=1}^p\frac{(x_i - \mu_i)^2}{\sigma^2_i}} && \text{(substitute)} \\ &= \prod_{i=1}^p \frac{1}{\sigma_i \sqrt{2\pi}} \text{e}^{-\frac{(x_i - \mu_i)^2}{2\sigma^2_i}} && \text{(} \text{e}^{a + b} = \text{e}^{a}\text{e}^{b} \text{)} \end{aligned} \]

which is the product of the \({\operatorname{N}\mathopen{}\left(\mu_i, \sigma^2_i\right)\mathclose{}}\) densities. Integrating out every coordinate except \(x_i\), each other factor integrates to 1 (the normal density integrates to 1), leaving the \({\operatorname{N}\mathopen{}\left(\mu_i, \sigma^2_i\right)\mathclose{}}\) density as the density of \(X_i\) (marginal density from a joint density, with \(p\) variables). So the joint density is the product of the marginal densities, and the components are independent by the factorization theorem for densities, extended to \(p\) variables as its remark describes.

Corollary 4 (For a multivariate normal vector, uncorrelated components are independent) If \(\mathord{\smash[b]{\underset{\raise.3ex\hbox{$\scriptstyle\sim$}}{X}}\vphantom{X}}\sim \operatorname{N}_p\mathopen{}\left(\mathord{\smash[b]{\underset{\raise.3ex\hbox{$\scriptstyle\sim$}}{\mu}}\vphantom{\mu}}, \mathbf{\Sigma}\right)\mathclose{}\), then \(X_1, \ldots, X_p\) are independent if and only if \(\mathbf{\Sigma}\) is diagonal, that is, if and only if \({\operatorname{Cov}\mathopen{}\left(X_i, X_j\right)\mathclose{}} = 0\) for every \(i \neq j\).

Proof. By Theorem 16, \({\operatorname{Var}\mathopen{}\left(\mathord{\smash[b]{\underset{\raise.3ex\hbox{$\scriptstyle\sim$}}{X}}\vphantom{X}}\right)\mathclose{}} = \mathbf{\Sigma}\), whose \((i,j)\)-th element is \({\operatorname{Cov}\mathopen{}\left(X_i, X_j\right)\mathclose{}}\) (elements of the variance matrix). If \(\mathbf{\Sigma}\) is diagonal, the components are independent by Theorem 17. If the components are independent, then:

  • each pair \(X_i, X_j\) with \(i \neq j\) is independent,
  • each \(X_i\) is continuous, with the density left after integrating out the other coordinates of the joint density (marginal density from a joint density, with \(p\) variables), and
  • \({\mathbb{E}\mathopen{}\left[X_i^2\right]\mathclose{}} < \infty\), because \({\operatorname{Var}\mathopen{}\left(X_i\right)\mathclose{}}\), the \((i,i)\)-th element of \(\mathbf{\Sigma}\), is defined, and a variance is defined only when \({\mathbb{E}\mathopen{}\left[X_i^2\right]\mathclose{}} < \infty\).

So \(\mathbf{\Sigma}\) is diagonal by independent components give a diagonal variance matrix.

Theorem 18 (Mahalanobis distance in eigenvector coordinates) Let \(\mathbf{\Sigma}\) be positive definite, with eigendecomposition \(\mathbf{\Sigma} = \mathbf{Q}\mathbf{\Lambda}{\mathbf{Q}}^{\top}\), where \(\mathbf{Q}\) has columns \(\mathord{\smash[b]{\underset{\raise.3ex\hbox{$\scriptstyle\sim$}}{q}}\vphantom{q}}_1, \ldots, \mathord{\smash[b]{\underset{\raise.3ex\hbox{$\scriptstyle\sim$}}{q}}\vphantom{q}}_p\) and \(\mathbf{\Lambda}\) has diagonal elements \(\lambda_1, \ldots, \lambda_p\). Then:

\[ \Delta(\mathord{\smash[b]{\underset{\raise.3ex\hbox{$\scriptstyle\sim$}}{x}}\vphantom{x}})^2 = \sum_{i=1}^p\frac{\mathopen{}\left({\mathord{\smash[b]{\underset{\raise.3ex\hbox{$\scriptstyle\sim$}}{q}}\vphantom{q}}_i}^{\top}(\mathord{\smash[b]{\underset{\raise.3ex\hbox{$\scriptstyle\sim$}}{x}}\vphantom{x}}- \mathord{\smash[b]{\underset{\raise.3ex\hbox{$\scriptstyle\sim$}}{\mu}}\vphantom{\mu}})\right)\mathclose{}^2}{\lambda_i} \]

Proof. Let \(\mathord{\smash[b]{\underset{\raise.3ex\hbox{$\scriptstyle\sim$}}{y}}\vphantom{y}} = {\mathbf{Q}}^{\top}(\mathord{\smash[b]{\underset{\raise.3ex\hbox{$\scriptstyle\sim$}}{x}}\vphantom{x}}- \mathord{\smash[b]{\underset{\raise.3ex\hbox{$\scriptstyle\sim$}}{\mu}}\vphantom{\mu}})\), whose \(i\)-th element is \(y_i = {\mathord{\smash[b]{\underset{\raise.3ex\hbox{$\scriptstyle\sim$}}{q}}\vphantom{q}}_i}^{\top}(\mathord{\smash[b]{\underset{\raise.3ex\hbox{$\scriptstyle\sim$}}{x}}\vphantom{x}}- \mathord{\smash[b]{\underset{\raise.3ex\hbox{$\scriptstyle\sim$}}{\mu}}\vphantom{\mu}})\). By the inverse of a positive definite matrix, \(\mathbf{\Sigma}^{-1} = \mathbf{Q}\mathbf{\Lambda}^{-1}{\mathbf{Q}}^{\top}\), with every \(\lambda_i > 0\). So:

\[ \begin{aligned} \Delta(\mathord{\smash[b]{\underset{\raise.3ex\hbox{$\scriptstyle\sim$}}{x}}\vphantom{x}})^2 &= {(\mathord{\smash[b]{\underset{\raise.3ex\hbox{$\scriptstyle\sim$}}{x}}\vphantom{x}}- \mathord{\smash[b]{\underset{\raise.3ex\hbox{$\scriptstyle\sim$}}{\mu}}\vphantom{\mu}})}^{\top} \mathbf{Q}\mathbf{\Lambda}^{-1}{\mathbf{Q}}^{\top} (\mathord{\smash[b]{\underset{\raise.3ex\hbox{$\scriptstyle\sim$}}{x}}\vphantom{x}}- \mathord{\smash[b]{\underset{\raise.3ex\hbox{$\scriptstyle\sim$}}{\mu}}\vphantom{\mu}}) && \text{(definition; substitute } \mathbf{\Sigma}^{-1} \text{)} \\ &= {\mathord{\smash[b]{\underset{\raise.3ex\hbox{$\scriptstyle\sim$}}{y}}\vphantom{y}}}^{\top} \mathbf{\Lambda}^{-1} \mathord{\smash[b]{\underset{\raise.3ex\hbox{$\scriptstyle\sim$}}{y}}\vphantom{y}} && \text{(} {(\mathord{\smash[b]{\underset{\raise.3ex\hbox{$\scriptstyle\sim$}}{x}}\vphantom{x}}- \mathord{\smash[b]{\underset{\raise.3ex\hbox{$\scriptstyle\sim$}}{\mu}}\vphantom{\mu}})}^{\top}\mathbf{Q} = {\mathord{\smash[b]{\underset{\raise.3ex\hbox{$\scriptstyle\sim$}}{y}}\vphantom{y}}}^{\top} \text{)} \\ &= \sum_{i=1}^p\frac{y_i^2}{\lambda_i} && \text{(} \mathbf{\Lambda}^{-1} \text{ is diagonal)} \end{aligned} \]

Example 19 (Elliptical contours of a bivariate normal density) Let \(\mathord{\smash[b]{\underset{\raise.3ex\hbox{$\scriptstyle\sim$}}{\mu}}\vphantom{\mu}} = \mathord{\smash[b]{\underset{\raise.3ex\hbox{$\scriptstyle\sim$}}{0}}\vphantom{0}}\) and \(\mathbf{\Sigma} = \begin{pmatrix}2 & 1 \\ 1 & 2\end{pmatrix}\), which has eigenvalues \(3\) and \(1\), with eigenvectors \(\mathord{\smash[b]{\underset{\raise.3ex\hbox{$\scriptstyle\sim$}}{q}}\vphantom{q}}_1 = \frac{1}{\sqrt{2}}{(1, 1)}^{\top}\) and \(\mathord{\smash[b]{\underset{\raise.3ex\hbox{$\scriptstyle\sim$}}{q}}\vphantom{q}}_2 = \frac{1}{\sqrt{2}}{(1, -1)}^{\top}\) (an eigendecomposition example). By Theorem 18:

\[ \Delta(\mathord{\smash[b]{\underset{\raise.3ex\hbox{$\scriptstyle\sim$}}{x}}\vphantom{x}})^2 = \frac{(x_1 + x_2)^2}{2 \cdot 3} + \frac{(x_1 - x_2)^2}{2 \cdot 1} \]

The point

\[ \begin{aligned} \mathord{\smash[b]{\underset{\raise.3ex\hbox{$\scriptstyle\sim$}}{x}}\vphantom{x}}&= \sqrt{3}\,\mathord{\smash[b]{\underset{\raise.3ex\hbox{$\scriptstyle\sim$}}{q}}\vphantom{q}}_1 \\ &= \sqrt{3/2}\,{(1, 1)}^{\top} \end{aligned} \]

has \(x_1 + x_2 = \sqrt{6}\) and \(x_1 - x_2 = 0\), so

\[ \begin{aligned} \Delta(\mathord{\smash[b]{\underset{\raise.3ex\hbox{$\scriptstyle\sim$}}{x}}\vphantom{x}})^2 &= 6/6 \\ &= 1; \end{aligned} \]

the point \(\mathord{\smash[b]{\underset{\raise.3ex\hbox{$\scriptstyle\sim$}}{x}}\vphantom{x}}= \mathord{\smash[b]{\underset{\raise.3ex\hbox{$\scriptstyle\sim$}}{q}}\vphantom{q}}_2\) has \(x_1 + x_2 = 0\) and \(x_1 - x_2 = \sqrt{2}\), so

\[ \begin{aligned} \Delta(\mathord{\smash[b]{\underset{\raise.3ex\hbox{$\scriptstyle\sim$}}{x}}\vphantom{x}})^2 &= 2/2 \\ &= 1. \end{aligned} \]

So the contour \(\Delta(\mathord{\smash[b]{\underset{\raise.3ex\hbox{$\scriptstyle\sim$}}{x}}\vphantom{x}}) = 1\) of the \(\operatorname{N}_2\mathopen{}\left(\mathord{\smash[b]{\underset{\raise.3ex\hbox{$\scriptstyle\sim$}}{0}}\vphantom{0}}, \mathbf{\Sigma}\right)\mathclose{}\) density is an ellipse stretched along \({(1, 1)}^{\top}\), with half-length \(\sqrt{3}\), and squeezed along \({(1, -1)}^{\top}\), with half-length \(1\): \(X_1\) and \(X_2\) are positively correlated (Figure 4).

[Code]
# The covariance matrix of the example and its eigendecomposition.
mh_entries <- c(2, 1, 1, 2)
mh_covmat <- matrix(mh_entries, nrow = 2)
mh_eig <- eigen(mh_covmat)
mh_values <- mh_eig$values
mh_expected <- c(3, 1)
mh_matches <- all.equal(mh_values, mh_expected)
stopifnot(mh_matches)

# The Mahalanobis distance of each grid point from the mean zero.
mh_axis <- seq(-3.5, 3.5, length.out = 200)
mh_grid <- tidyr::expand_grid(x1 = mh_axis, x2 = mh_axis)
mh_points <- as.matrix(mh_grid)
mh_inverse <- solve(mh_covmat)
mh_quad <- (mh_points %*% mh_inverse) * mh_points
mh_sums <- rowSums(mh_quad)
mh_dist <- sqrt(mh_sums)
mh_grid <- dplyr::mutate(mh_grid, mahal = mh_dist)

# The points of the example: sqrt(3) q1 and q2, each at distance 1.
mh_long <- sqrt(3 / 2)
mh_short <- 1 / sqrt(2)
mh_marks_x1 <- c(mh_long, mh_short)
mh_marks_x2 <- c(mh_long, -mh_short)
mh_marks <- tibble::tibble(x1 = mh_marks_x1, x2 = mh_marks_x2)

mh_contour_aes <- ggplot2::aes(z = mahal, colour = ggplot2::after_stat(level))
mh_breaks <- c(1, 2)
mh_contours <- ggplot2::geom_contour(mh_contour_aes, breaks = mh_breaks)
mh_dots <- ggplot2::geom_point(data = mh_marks, size = 2.5)
mh_colours <- ggplot2::scale_colour_viridis_c(
  name = "Mahalanobis distance",
  end = 0.7,
  breaks = mh_breaks,
  guide = "legend"
)
mh_plot <- mh_grid |>
  ggplot2::ggplot() +
  ggplot2::aes(x1, x2) +
  mh_contours +
  mh_dots +
  mh_colours +
  ggplot2::coord_fixed(expand = FALSE) +
  ggplot2::labs(x = "x1", y = "x2") +
  ggplot2::theme(legend.position = "bottom")

mh_is_html <- knitr::is_html_output()
if (mh_is_html) {
  mh_legend <- list(
    orientation = "h",
    x = 0.5,
    xanchor = "center",
    y = -0.25
  )
  mh_widget <- plotly::ggplotly(mh_plot) |>
    plotly::layout(legend = mh_legend) |>
    plotly::config(displaylogo = FALSE, responsive = TRUE)
  htmltools::div(
    role = "img",
    `aria-label` = fig_alt_mahal_eigen,
    mh_widget
  )
} else {
  mh_plot
}
Figure 4: The contours of the Mahalanobis distance at \(1\) and \(2\) for the example. The dots are the points \(\sqrt{3}\,\mathord{\smash[b]{\underset{\raise.3ex\hbox{$\scriptstyle\sim$}}{q}}\vphantom{q}}_1\) and \(\mathord{\smash[b]{\underset{\raise.3ex\hbox{$\scriptstyle\sim$}}{q}}\vphantom{q}}_2\) of the example on the inner ellipse.
[Code]
mh3_entries <- c(2, 1, 1, 2)
mh3_covmat <- matrix(mh3_entries, nrow = 2)
mh3_inverse <- solve(mh3_covmat)
mh3_x1 <- seq(-3.5, 3.5, length.out = 101)
mh3_x2 <- seq(-3.5, 3.5, length.out = 101)
mh3_grid <- tidyr::expand_grid(x1 = mh3_x1, x2 = mh3_x2)
mh3_points <- as.matrix(mh3_grid)
mh3_quad <- (mh3_points %*% mh3_inverse) * mh3_points
mh3_sums <- rowSums(mh3_quad)
mh3_dist <- sqrt(mh3_sums)
mh3_n_x2 <- length(mh3_x2)
mh3_z <- matrix(mh3_dist, nrow = mh3_n_x2)

# The points of the example: sqrt(3) q1 and q2, each at distance 1.
mh3_long <- sqrt(3 / 2)
mh3_short <- 1 / sqrt(2)
mh3_marks_x1 <- c(mh3_long, mh3_short)
mh3_marks_x2 <- c(mh3_long, -mh3_short)
mh3_marks_z <- c(1, 1)
mh3_marks <- tibble::tibble(
  x1 = mh3_marks_x1,
  x2 = mh3_marks_x2,
  z = mh3_marks_z
)
mh3_marker <- list(color = "black", size = 5)
mh3_contours_z <- list(
  show = TRUE,
  start = 1,
  end = 2,
  size = 1,
  color = "red"
)
mh3_contours <- list(z = mh3_contours_z)
mh3_stops <- c(0, 1)
mh3_cols <- c("#CCE0F0", "#0072B2")
mh3_scale <- list(mh3_stops, mh3_cols)
mh3_eye <- list(x = 1.6, y = -1.6, z = 0.9)
mh3_camera <- list(eye = mh3_eye)
mh3_xaxis <- list(title = "x1")
mh3_yaxis <- list(title = "x2")
mh3_zaxis <- list(title = "Mahalanobis distance")
mh3_scene <- list(
  xaxis = mh3_xaxis,
  yaxis = mh3_yaxis,
  zaxis = mh3_zaxis,
  camera = mh3_camera
)
mh3_widget <- plotly::plot_ly() |>
  plotly::add_surface(
    x = mh3_x1,
    y = mh3_x2,
    z = mh3_z,
    contours = mh3_contours,
    colorscale = mh3_scale,
    showscale = FALSE,
    opacity = 0.8
  ) |>
  plotly::add_markers(
    data = mh3_marks,
    x = ~x1,
    y = ~x2,
    z = ~z,
    showlegend = FALSE,
    marker = mh3_marker
  ) |>
  plotly::layout(scene = mh3_scene)
htmltools::div(
  role = "img",
  `aria-label` = fig_alt_mahal_surf,
  mh3_widget
)
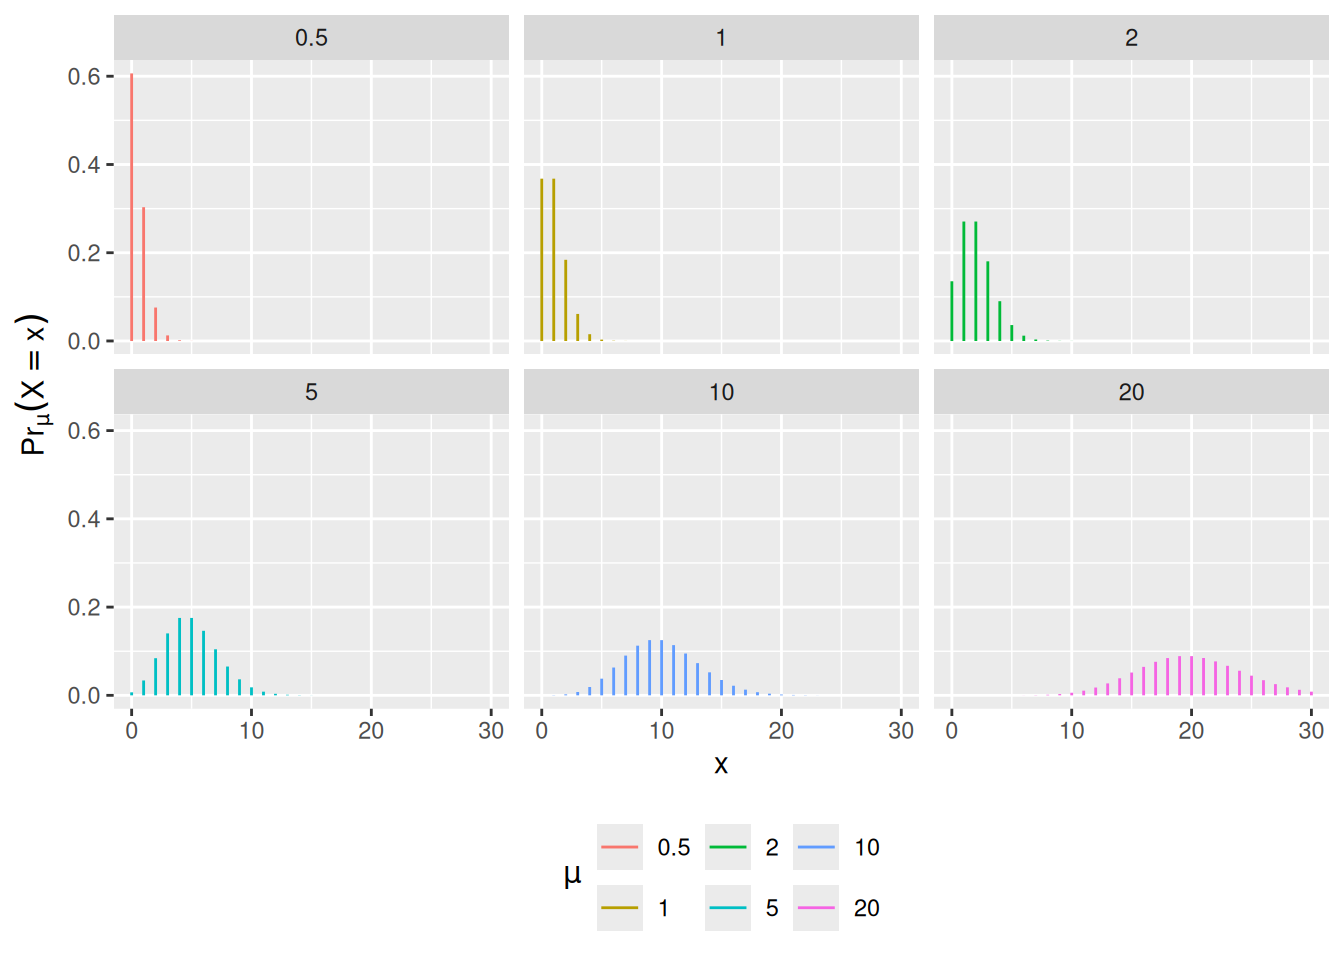
Figure 5: The Mahalanobis distance is a surface over the plane, a cone whose horizontal slices are the ellipses of Figure 4. The red lines are the contours at \(1\) and \(2\), and the dots are the points \(\sqrt{3}\,\mathord{\smash[b]{\underset{\raise.3ex\hbox{$\scriptstyle\sim$}}{q}}\vphantom{q}}_1\) and \(\mathord{\smash[b]{\underset{\raise.3ex\hbox{$\scriptstyle\sim$}}{q}}\vphantom{q}}_2\) of the example on the inner one.

0.8 Mixture distributions

Definition 11 (Mixture density) Let \({\mathbb{p}_1}, \ldots, {\mathbb{p}_K}\) be densities on \(\mathbb{R}\), and let \(w_1, \ldots, w_K\) be numbers with:

  • \(w_c \ge 0\) for every \(c\), and
  • \(\sum_{c=1}^{K} w_c = 1\).

The mixture of \({\mathbb{p}_1}, \ldots, {\mathbb{p}_K}\) with mixing weights \(w_1, \ldots, w_K\) is the function [9]:

\[ {\mathbb{p}_{\text{mix}}}(x) \stackrel{\text{def}}{=}\sum_{c=1}^{K} w_c \, {\mathbb{p}_c}(x), \quad x \in \mathbb{R} \]

Definition 12 (Mixture component) The densities \({\mathbb{p}_1}, \ldots, {\mathbb{p}_K}\) in a mixture (Definition 11) are its components.

Theorem 19 (A mixture is the density of a two-stage random variable) Let \(C\) be a discrete random variable and \(X\) a continuous random variable with joint density-mass function

\[\mathbb{p}(C = c,\, X = x) = w_c \, {\mathbb{p}_c}(x), \quad c \in {\mathopen{}\left\{1, \ldots, K\right\}\mathclose{}},\]

with \({\mathbb{p}_c}\) and \(w_c\) as in Definition 11. Then:

  • \(\mathbb{P}(C = c) = w_c\),
  • for each \(c\) with \(w_c > 0\), the conditional density of \(X\) given \(C = c\) is \({\mathbb{p}_c}\), and
  • the mixture \({\mathbb{p}_{\text{mix}}}\) is a density of \(X\).

Proof. By the marginal PMF from a joint density-mass function,

\[ \begin{aligned} \mathbb{P}(C = c) &= \int_{-\infty}^{\infty} w_c \, {\mathbb{p}_c}(x)\,dx \\ &= w_c, \end{aligned} \]

because \({\mathbb{p}_c}\) is a density and so integrates to 1. Then, by the definition of the conditional density,

\[ \begin{aligned} \mathbb{p}(X = x \mid C = c) &= w_c \, {\mathbb{p}_c}(x) / w_c \\ &= {\mathbb{p}_c}(x). \end{aligned} \]

For the last claim, the events \({\mathopen{}\left\{C = 1\right\}\mathclose{}}, \ldots, {\mathopen{}\left\{C = K\right\}\mathclose{}}\) are mutually exclusive, and their union is the whole sample space. So for any interval \(B\):

\[ \begin{aligned} \Pr(X \in B) &= \sum_{c=1}^{K} \Pr(C = c,\, X \in B) && \text{(additivity over the events } {\mathopen{}\left\{C = c\right\}\mathclose{}} \text{)} \\ &= \sum_{c=1}^{K} \int_B w_c \, {\mathbb{p}_c}(x)\,dx && \text{(definition of a joint density-mass function)} \\ &= \int_B \sum_{c=1}^{K} w_c \, {\mathbb{p}_c}(x)\,dx && \text{(a finite sum of integrals is the integral of the sum)} \\ &= \int_B {\mathbb{p}_{\text{mix}}}(x)\,dx && \text{(definition of a mixture)} \end{aligned} \]

And \({\mathbb{p}_{\text{mix}}} \ge 0\), as a sum of non-negative terms, so \({\mathbb{p}_{\text{mix}}}\) is a density of \(X\).

Theorem 20 (The mean of a mixture is the weighted mean of the component means) If \(X\) has density \({\mathbb{p}_{\text{mix}}}\) (Definition 11), and each component \({\mathbb{p}_c}\) has a defined mean \(\mu_c = \int_{-\infty}^{\infty} x \, {\mathbb{p}_c}(x)\,dx\), then:

\[{\mathbb{E}\mathopen{}\left[X\right]\mathclose{}} = \sum_{c=1}^{K} w_c \, \mu_c\]

Proof. The integral defining \({\mathbb{E}\mathopen{}\left[X\right]\mathclose{}}\) converges absolutely, because \(\int_{-\infty}^\infty \mathopen{}\left|x\right|\mathclose{} \, {\mathbb{p}_{\text{mix}}}(x)\,dx = \sum_{c=1}^{K} w_c \int_{-\infty}^\infty \mathopen{}\left|x\right|\mathclose{} \, {\mathbb{p}_c}(x)\,dx\), a finite sum of finite numbers. Then:

\[ \begin{aligned} {\mathbb{E}\mathopen{}\left[X\right]\mathclose{}} &= \int_{-\infty}^{\infty} x \, {\mathbb{p}_{\text{mix}}}(x)\,dx && \text{(definition of expectation)} \\ &= \int_{-\infty}^{\infty} x \sum_{c=1}^{K} w_c \, {\mathbb{p}_c}(x)\,dx && \text{(definition of a mixture)} \\ &= \sum_{c=1}^{K} w_c \int_{-\infty}^{\infty} x \, {\mathbb{p}_c}(x)\,dx && \text{(a finite sum of integrals is the integral of the sum)} \\ &= \sum_{c=1}^{K} w_c \, \mu_c && \text{(definition of } \mu_c \text{)} \end{aligned} \]

The first step is the definition of expectation.

Theorem 21 (Which component did an observation come from?) Under the conditions of Theorem 19, for each \(x\) with \({\mathbb{p}_{\text{mix}}}(x) > 0\):

\[ \mathbb{P}(C = c \mid X = x) = \frac{w_c \, {\mathbb{p}_c}(x)}{\sum_{k=1}^{K} w_k \, {\mathbb{p}_k}(x)} \]

Proof. By Theorem 19, \({\mathbb{p}_{\text{mix}}}\) is a density of \(X\). By the definition of the conditional PMF (the case \(X\) continuous, \(C\) discrete):

\[ \begin{aligned} \mathbb{P}(C = c \mid X = x) &= \frac{\mathbb{p}(C = c,\, X = x)}{\mathbb{p}(X = x)} && \text{(definition of the conditional PMF)} \\ &= \frac{w_c \, {\mathbb{p}_c}(x)}{\sum_{k=1}^{K} w_k \, {\mathbb{p}_k}(x)} && \text{(substitute the joint density-mass function and } {\mathbb{p}_{\text{mix}}} \text{)} \end{aligned} \]

Definition 13 (Responsibility of a mixture component) In the setting of Theorem 21, the conditional probability \(\mathbb{P}(C = c \mid X = x)\) is called, in machine learning, the responsibility of component \(c\) for \(x\).

Example 20 (A two-component normal mixture) Let \({\mathbb{p}_1}\) be the \({\operatorname{N}\mathopen{}\left(0, 1\right)\mathclose{}}\) density and \({\mathbb{p}_2}\) the \({\operatorname{N}\mathopen{}\left(6, 1\right)\mathclose{}}\) density, with mixing weights \(w_1 = 0.3\) and \(w_2 = 0.7\), and let \(X\) have density \({\mathbb{p}_{\text{mix}}} = 0.3\,{\mathbb{p}_1} + 0.7\,{\mathbb{p}_2}\).

  • Mean. By Theorem 20 and the normal means,

    \[ \begin{aligned} {\mathbb{E}\mathopen{}\left[X\right]\mathclose{}} &= 0.3 \cdot 0 + 0.7 \cdot 6 \\ &= 4.2. \end{aligned} \]

  • Density. \({\mathbb{p}_{\text{mix}}}\) has peaks near the two component means, \({\mathbb{p}_{\text{mix}}}(0) \approx 0.120\) and \({\mathbb{p}_{\text{mix}}}(6) \approx 0.279\), with a trough between them, \({\mathbb{p}_{\text{mix}}}(3) \approx 0.004\). The density at the mean, \({\mathbb{p}_{\text{mix}}}(4.2) \approx 0.055\), is less than half its value at either peak.

  • Responsibilities. By Theorem 21, at \(x = 3\), halfway between the component means, \({\mathbb{p}_1}(3) = {\mathbb{p}_2}(3)\) by the symmetry of the normal density, so:

    \[ \begin{aligned} \mathbb{P}(C = 2 \mid X = 3) &= \frac{0.7\,{\mathbb{p}_2}(3)}{0.3\,{\mathbb{p}_1}(3) + 0.7\,{\mathbb{p}_2}(3)} \\ &= \frac{0.7}{0.3 + 0.7} \\ &= 0.7, \end{aligned} \]

    the prior weight: an observation equally far from both components carries no information about which component it came from. At \(x = 4.2\), the same formula gives \(\mathbb{P}(C = 2 \mid X = 4.2) \approx 0.9997\).

Example 21 (The negative binomial as a continuous mixture) The negative binomial distribution is a mixture of Poisson distributions with a continuum of components, one for each mean \({\lambda}> 0\): its PMF is \(\mathbb{P}(Y = y) = \int_0^\infty g({\lambda})\,\frac{{\lambda}^y e^{-{\lambda}}}{y!}\,d{\lambda}\), where the gamma density \(g\) plays the role of the mixing weights and the integral replaces the sum in Definition 11 (see the proof of Theorem 11).

References

[1]
Wikipedia contributors, “Binomial distribution — Wikipedia, the free encyclopedia.” 2026. Available: https://en.wikipedia.org/wiki/Binomial_distribution
[2]
G. Casella and R. Berger, Statistical inference, 2nd ed. Cengage Learning, 2002. Available: https://www.cengage.com/c/statistical-inference-2e-casella-berger/9780534243128/
[3]
Wikipedia contributors, “Poisson distribution — Wikipedia, the free encyclopedia.” 2026. Available: https://en.wikipedia.org/wiki/Poisson_distribution
[4]
Wikipedia contributors, “Negative binomial distribution — Wikipedia, the free encyclopedia.” 2026. Available: https://en.wikipedia.org/wiki/Negative_binomial_distribution
[5]
Wikipedia contributors, “Laplace distribution — Wikipedia, the free encyclopedia.” 2026. Available: https://en.wikipedia.org/wiki/Laplace_distribution
[6]
Wikipedia contributors, “Weibull distribution — Wikipedia, the free encyclopedia.” 2026. Available: https://en.wikipedia.org/wiki/Weibull_distribution
[7]
Wikipedia contributors, “Multivariate normal distribution — Wikipedia, the free encyclopedia.” 2026. Available: https://en.wikipedia.org/wiki/Multivariate_normal_distribution
[8]
Wikipedia contributors, “Mahalanobis distance — Wikipedia, the free encyclopedia.” 2026. Available: https://en.wikipedia.org/wiki/Mahalanobis_distance
[9]
Wikipedia contributors, “Mixture distribution — Wikipedia, the free encyclopedia.” 2026. Available: https://en.wikipedia.org/wiki/Mixture_distribution