Code
library("gdl")


graph_downloads("dplyr")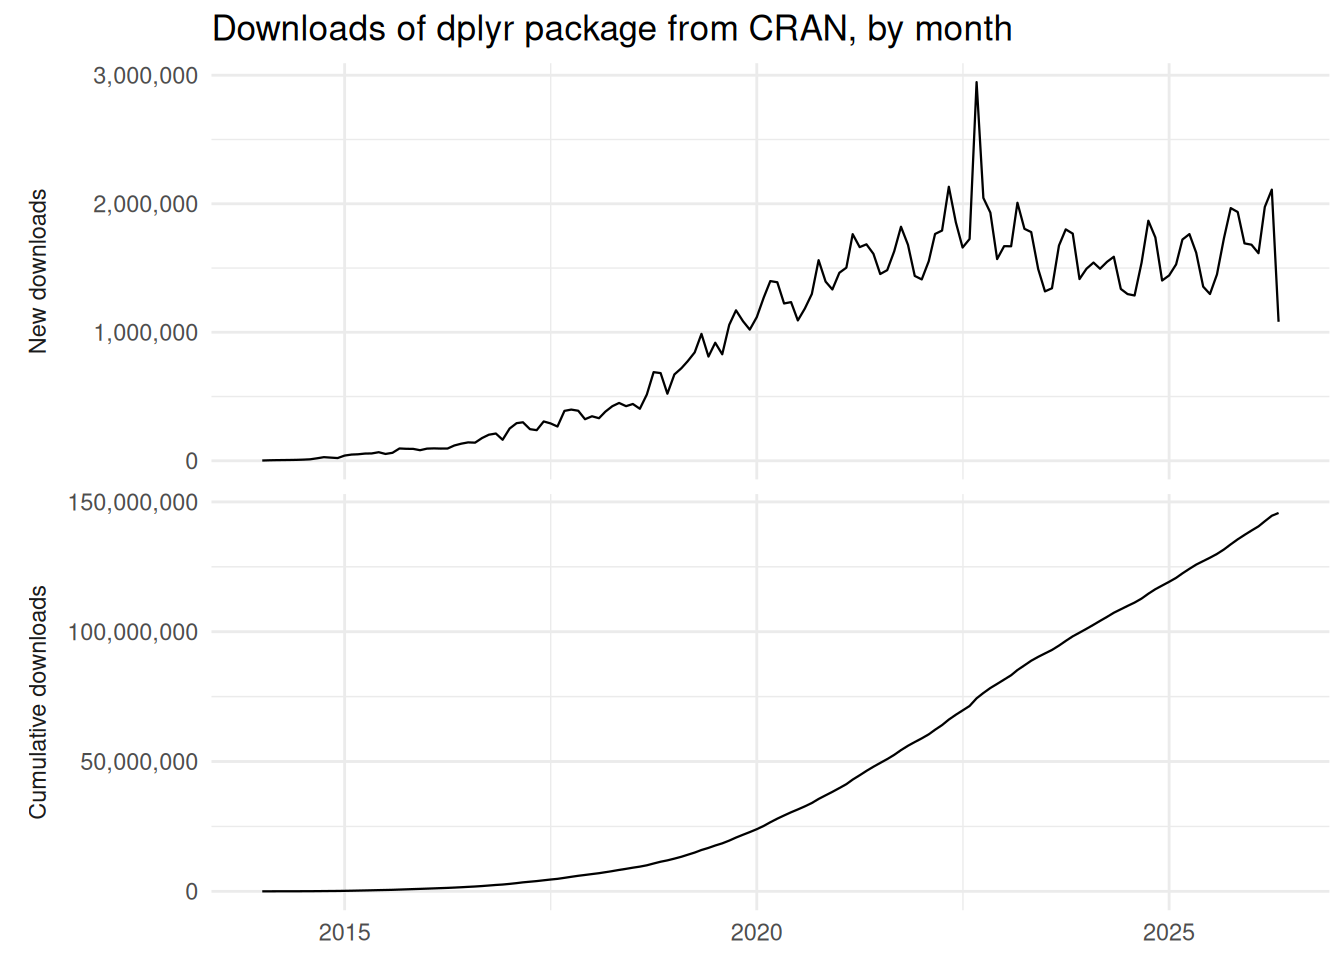
Code
graph_downloads("dplyr", github_repo = "tidyverse/dplyr")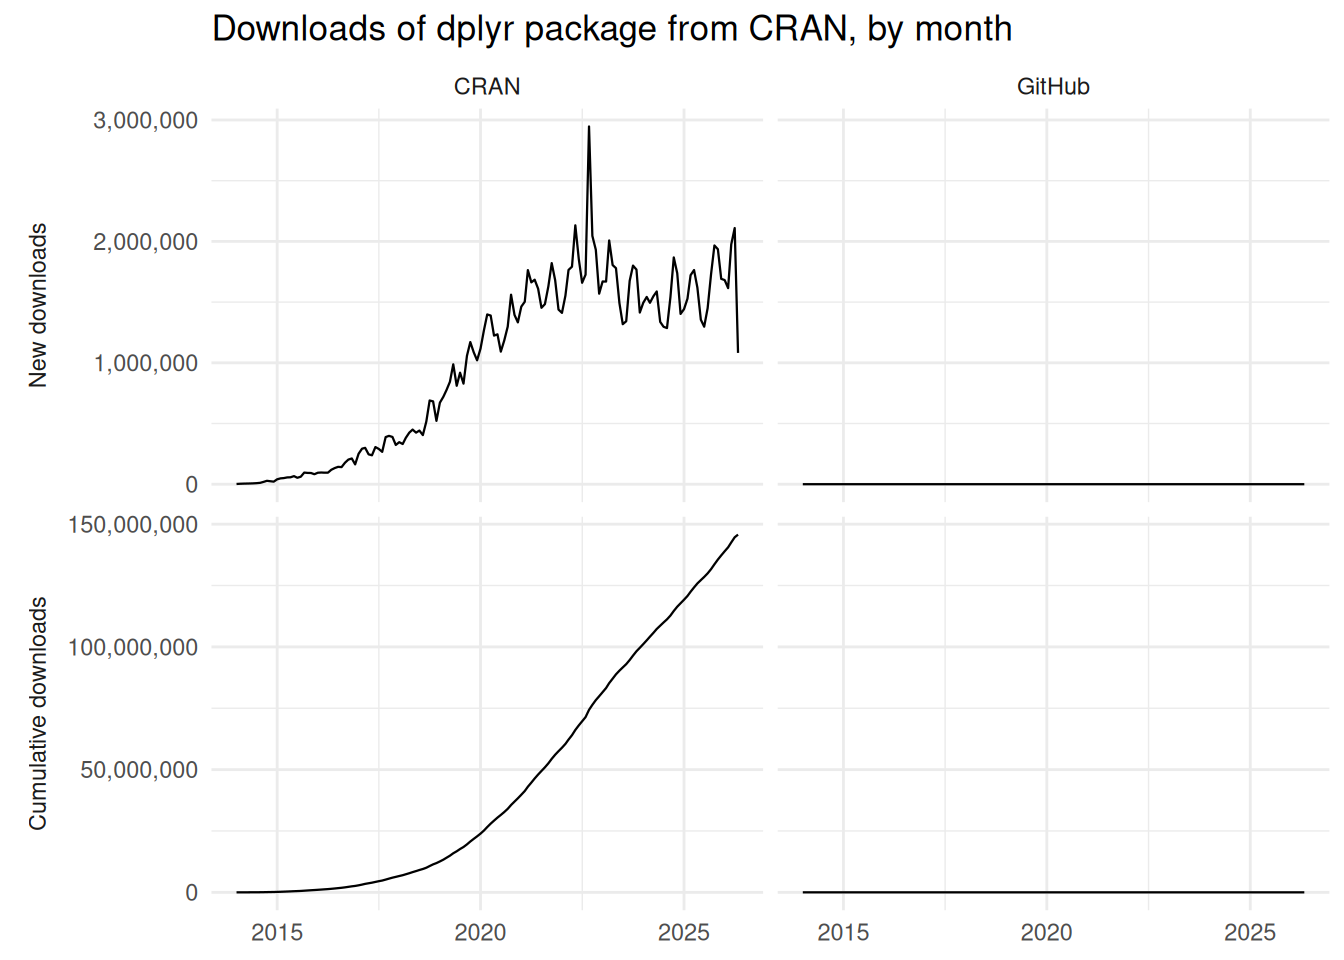
Code
graph_downloads("dplyr", unit = "week", start = "2024-01-01")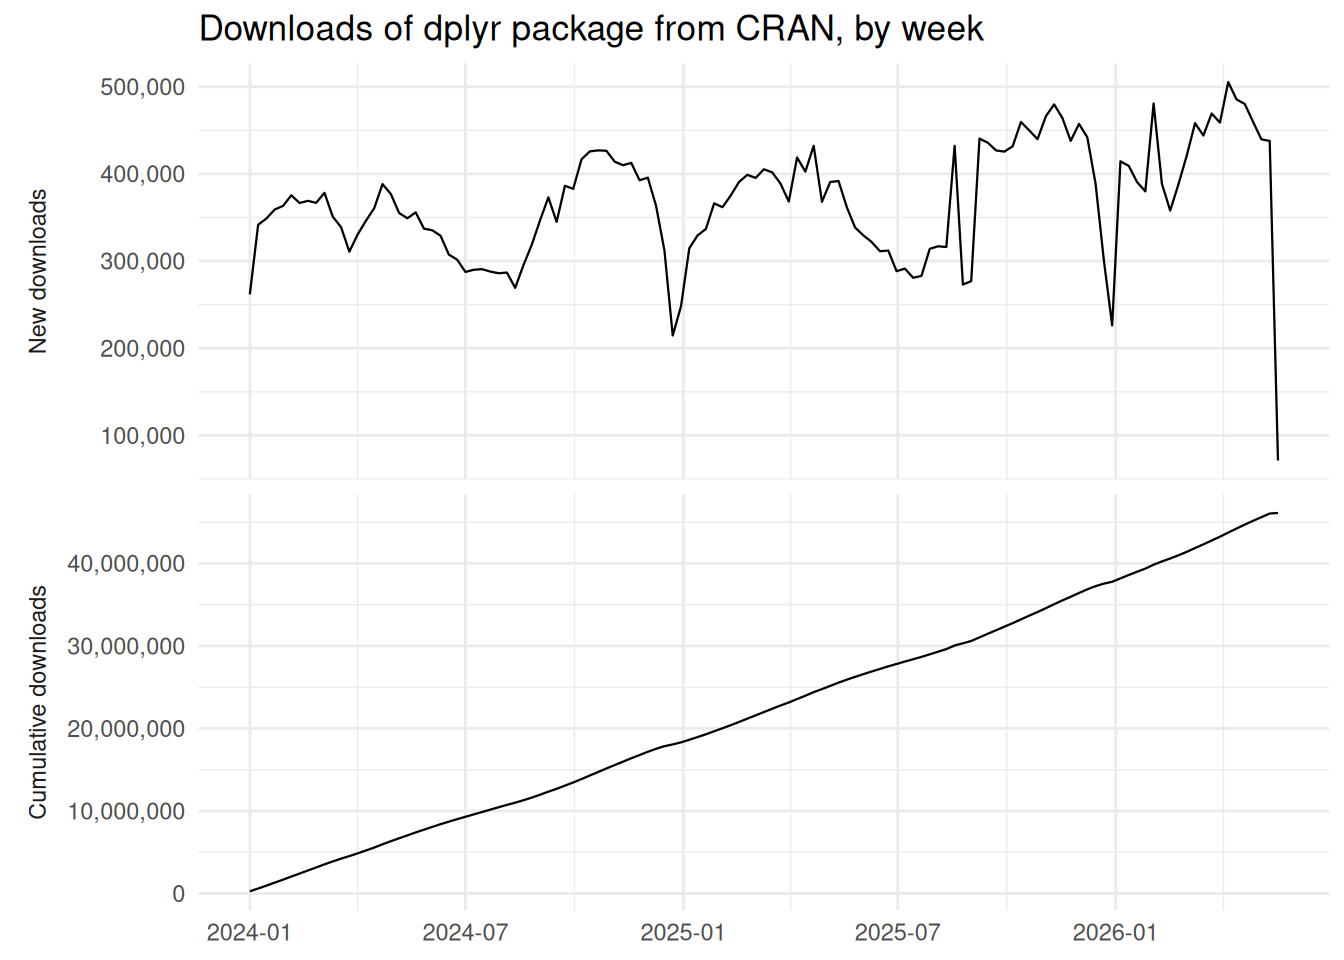
Fetches download data from CRAN (via packageRank) and optionally GitHub Releases (via gh), then plots new and cumulative downloads.
graph_downloads(package, ...)
package
|
Character; CRAN package name to graph. |
…
|
Arguments passed on to
|
GitHub release downloads are cumulative counts per release asset from the GitHub API. New GitHub downloads are derived as the contribution of each release. CRAN downloads are fetched via packageRank::cranDownloads().
Requires the packageRank package (and gh if github_repo is set), listed under Suggests.
A ggplot2::ggplot() object with faceted panels.
library("gdl")
graph_downloads("dplyr")
graph_downloads("dplyr", github_repo = "tidyverse/dplyr")
graph_downloads("dplyr", unit = "week", start = "2024-01-01")