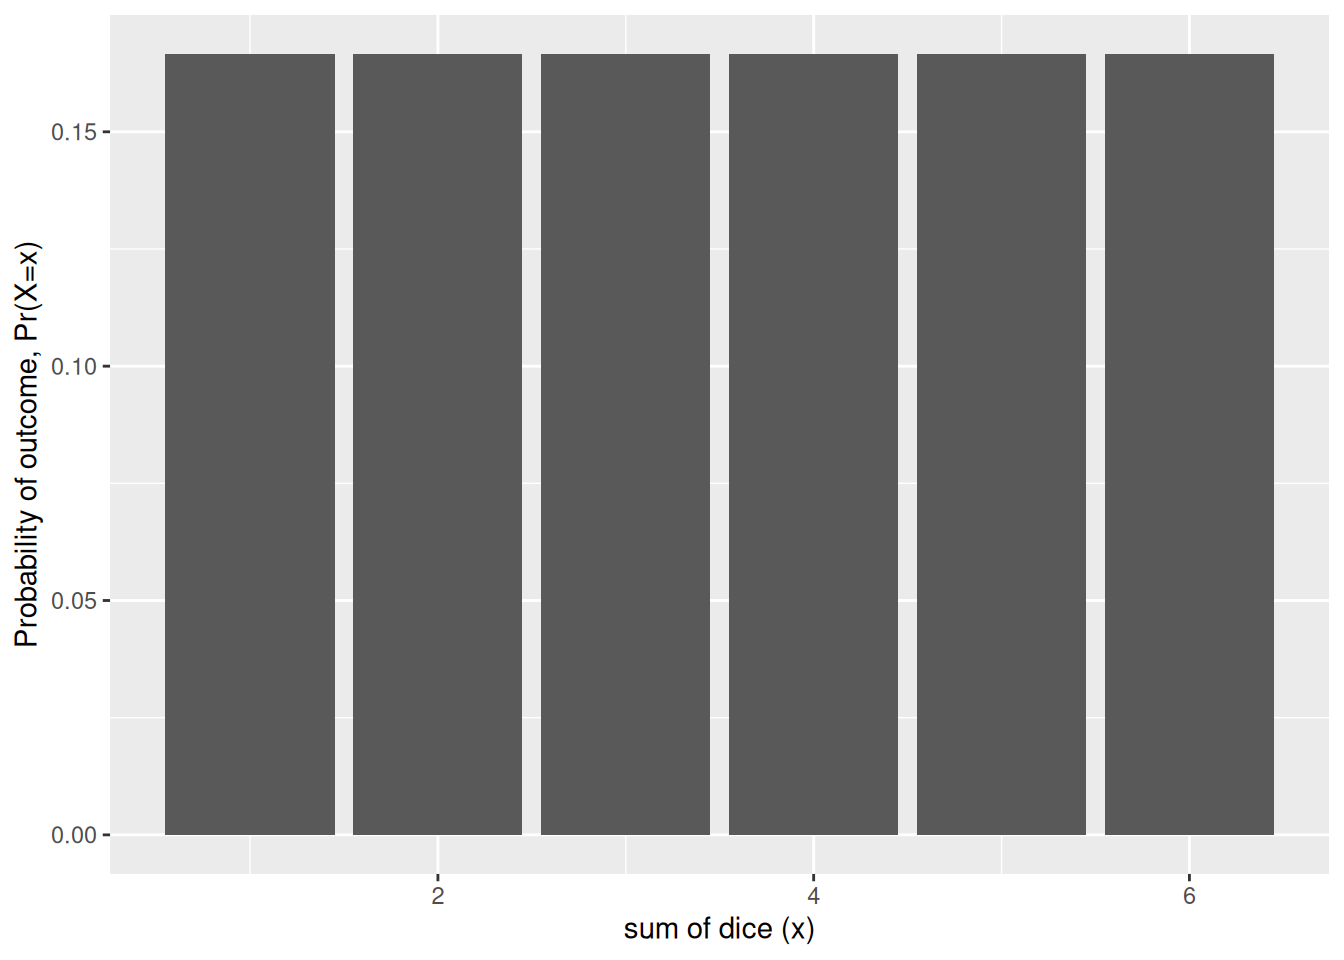
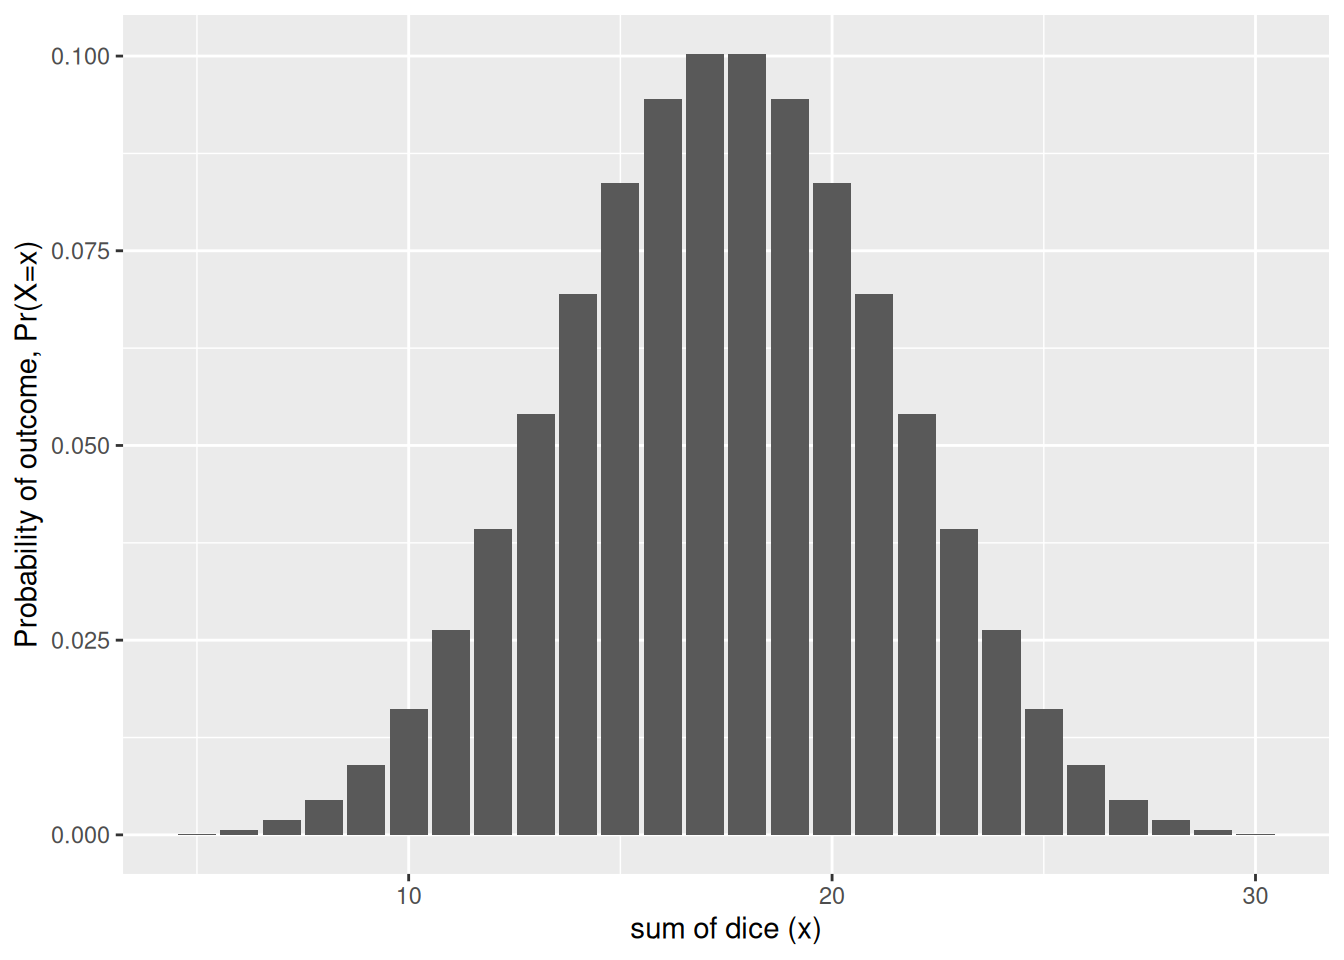
[R code]
dice_sum_pmf <- function(n_dice) {
  totals <- rowSums(expand.grid(rep(list(1:6), n_dice)))
  probs <- prop.table(table(totals))
  data.frame(total = as.numeric(names(probs)), p = as.vector(probs))
}

dice_plot <-
  ggplot2::ggplot(mapping = ggplot2::aes(x = total, y = p)) +
  ggplot2::xlab("sum of dice (x)") +
  ggplot2::ylab("Probability of outcome, Pr(X=x)") +
  ggplot2::expand_limits(y = 0)

dice_plot + ggplot2::geom_col(data = dice_sum_pmf(1))