q_entries <- c(4, 1, 1, 3)
Q <- matrix(q_entries, nrow = 2)
b <- c(1, 2)
x0 <- c(0, 0)
H0 <- diag(2)
q_x0 <- drop(Q %*% x0)
grad0 <- q_x0 - b
d <- -drop(H0 %*% grad0)
q_d <- drop(Q %*% d)
step <- -sum(grad0 * d) / sum(d * q_d)
x1 <- x0 + step * d
q_x1 <- drop(Q %*% x1)
grad1 <- q_x1 - b
f0 <- 0.5 * sum(x0 * q_x0) - sum(b * x0)
f1 <- 0.5 * sum(x1 * q_x1) - sum(b * x1)
s <- x1 - x0
y <- grad1 - grad0Quasi-Newton Methods
Last modified: 2026-11-07 12:26:52 (PST)
[Code]
qn_x_qn <- seq(-0.4, 0.6, length.out = 101)
qn_y_qn <- seq(-0.2, 1, length.out = 101)
qn_grid_qn <- tidyr::expand_grid(x = qn_x_qn, y = qn_y_qn)
qn_gx_qn <- qn_grid_qn$x
qn_gy_qn <- qn_grid_qn$y
qn_quad_qn <- 0.5 * (4 * qn_gx_qn^2 + 2 * qn_gx_qn * qn_gy_qn + 3 * qn_gy_qn^2)
qn_lin_qn <- qn_gx_qn + 2 * qn_gy_qn
qn_grid_qn$z <- qn_quad_qn - qn_lin_qn
qn_star_qn <- c(1, 7) / 11
qn_start_qn <- tibble::tibble(x = 0, y = 0)
qn_next_qn <- tibble::tibble(x = 0.25, y = 0.5)
qn_min_qn <- tibble::tibble(x = qn_star_qn[1], y = qn_star_qn[2])
qn_step_qn <- tibble::tibble(x = 0, y = 0, xend = 0.25, yend = 0.5)
qn_rest_qn <- tibble::tibble(
  x = 0.25, y = 0.5, xend = qn_star_qn[1], yend = qn_star_qn[2]
)
qn_len_qn <- grid::unit(0.15, "inches")
qn_arrow_qn <- grid::arrow(length = qn_len_qn)
qn_aes_qn <- ggplot2::aes(x, y)
qn_seg_qn <- ggplot2::aes(xend = xend, yend = yend)
ggplot2::ggplot(qn_grid_qn, qn_aes_qn) +
  ggplot2::geom_contour(ggplot2::aes(z = z), colour = "grey70", bins = 12) +
  ggplot2::geom_segment(
    data = qn_step_qn, mapping = qn_seg_qn, colour = "#0072B2",
    arrow = qn_arrow_qn
  ) +
  ggplot2::geom_segment(
    data = qn_rest_qn, mapping = qn_seg_qn, colour = "#D55E00",
    linetype = "dashed", arrow = qn_arrow_qn
  ) +
  ggplot2::geom_point(data = qn_start_qn, colour = "#0072B2", size = 3) +
  ggplot2::geom_point(data = qn_next_qn, colour = "#D55E00", size = 3) +
  ggplot2::geom_point(
    data = qn_min_qn, colour = "#0072B2", size = 3, shape = 15
  ) +
  ggplot2::coord_equal() +
  ggplot2::labs(x = "first coordinate", y = "second coordinate")
[Code]
import matplotlib.pyplot as plt
import numpy as np

qn_x_ax = np.linspace(-0.4, 0.6, 101)
qn_y_ax = np.linspace(-0.2, 1, 101)
qn_xx_ax, qn_yy_ax = np.meshgrid(qn_x_ax, qn_y_ax)
qn_quad_ax = 0.5 * (4 * qn_xx_ax**2 + 2 * qn_xx_ax * qn_yy_ax + 3 * qn_yy_ax**2)
qn_z_ax = qn_quad_ax - qn_xx_ax - 2 * qn_yy_ax
qn_star_ax = np.array([1, 7]) / 11
fig, ax = plt.subplots(figsize=(6, 4.5), layout="constrained")
ax.contour(
    qn_xx_ax, qn_yy_ax, qn_z_ax, levels=12, colors="0.7",
    negative_linestyles="solid",
)
ax.annotate("", xy=(0.25, 0.5), xytext=(0, 0), arrowprops={"arrowstyle": "->", "color": "#0072B2"})
ax.annotate(
    "", xy=qn_star_ax, xytext=(0.25, 0.5),
    arrowprops={"arrowstyle": "->", "color": "#D55E00", "linestyle": "dashed"},
)
ax.plot(0, 0, "o", color="#0072B2", markersize=8)
ax.plot(0.25, 0.5, "o", color="#D55E00", markersize=8)
ax.plot(qn_star_ax[0], qn_star_ax[1], "s", color="#0072B2", markersize=8)
ax.set_aspect("equal")
ax.set_xlabel("first coordinate")
ax.set_ylabel("second coordinate")
plt.show();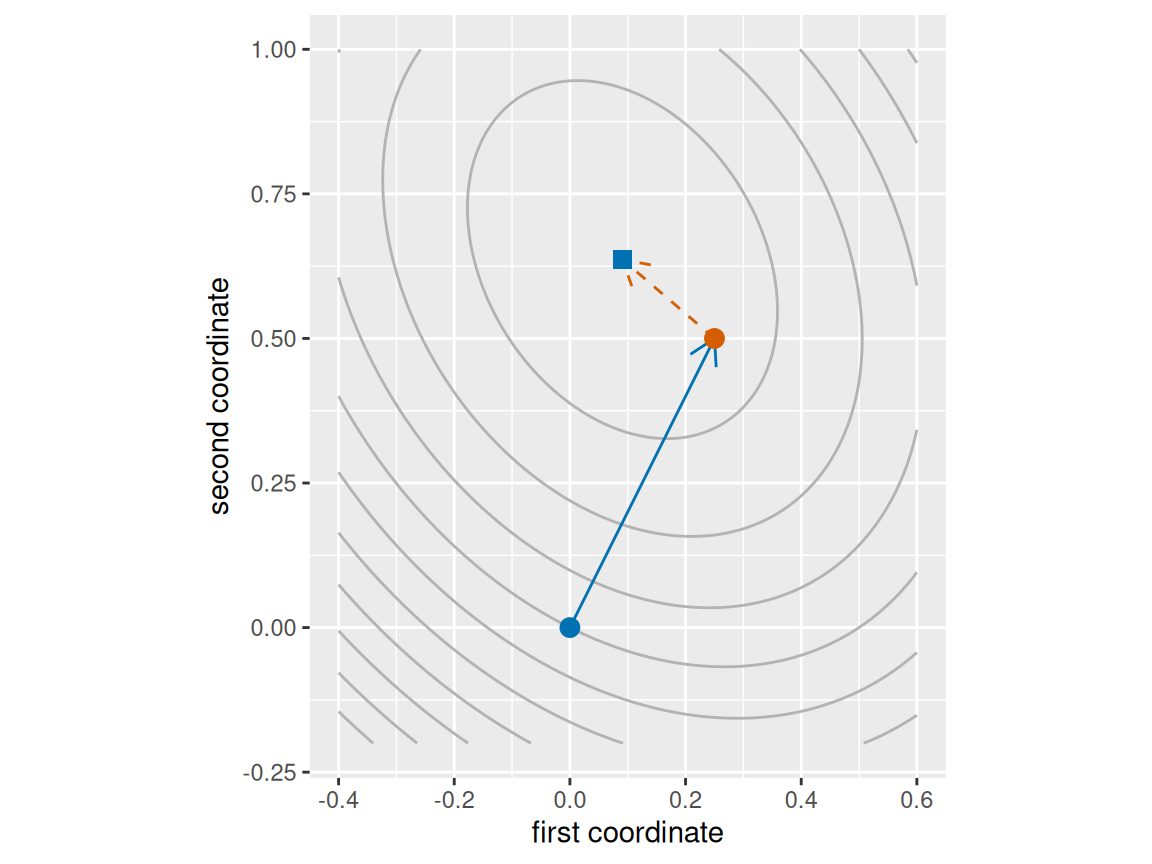
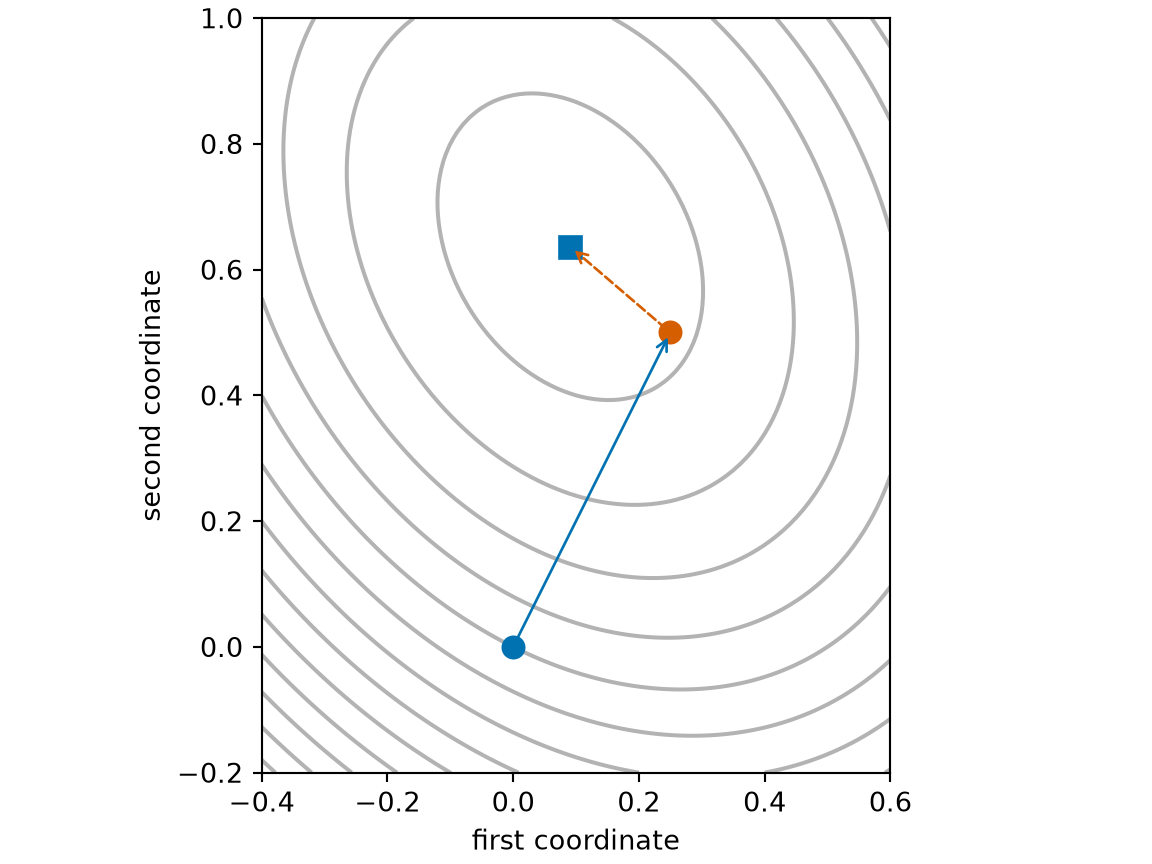
[Code]
qn_x_sf <- seq(-0.4, 0.6, length.out = 101)
qn_y_sf <- seq(-0.2, 1, length.out = 101)
qn_grid_sf <- tidyr::expand_grid(x = qn_x_sf, y = qn_y_sf)
qn_quad_sf <- 4 * qn_grid_sf$x^2 + 2 * qn_grid_sf$x * qn_grid_sf$y
qn_quad_sf <- 0.5 * (qn_quad_sf + 3 * qn_grid_sf$y^2)
qn_value_sf <- qn_quad_sf - qn_grid_sf$x - 2 * qn_grid_sf$y
qn_ny_sf <- length(qn_y_sf)
qn_z_sf <- matrix(qn_value_sf, nrow = qn_ny_sf)
qn_p_x_sf <- c(0, 0.25, 1 / 11)
qn_p_y_sf <- c(0, 0.5, 7 / 11)
qn_p_label_sf <- c("start", "after one step", "minimizer")
qn_p_color_sf <- c("#0072B2", "#D55E00", "#0072B2")
qn_p_symbol_sf <- c("circle", "circle", "square")
qn_pts_sf <- tibble::tibble(
  x = qn_p_x_sf,
  y = qn_p_y_sf,
  label = qn_p_label_sf,
  color = qn_p_color_sf,
  symbol = qn_p_symbol_sf
)
qn_pq_sf <- 4 * qn_pts_sf$x^2 + 2 * qn_pts_sf$x * qn_pts_sf$y
qn_pq_sf <- 0.5 * (qn_pq_sf + 3 * qn_pts_sf$y^2)
qn_pts_sf$z <- qn_pq_sf - qn_pts_sf$x - 2 * qn_pts_sf$y
qn_marker_sf <- list(color = ~color, size = 6, symbol = ~symbol)
qn_stops_sf <- c(0, 1)
qn_cols_sf <- c("#E5E5E5", "#808080")
qn_scale_sf <- list(qn_stops_sf, qn_cols_sf)
qn_eye_sf <- list(x = 1.6, y = -1.6, z = 0.9)
qn_camera_sf <- list(eye = qn_eye_sf)
qn_xaxis_sf <- list(title = "first coordinate")
qn_yaxis_sf <- list(title = "second coordinate")
qn_zaxis_sf <- list(title = "f(x)")
qn_scene_sf <- list(
  xaxis = qn_xaxis_sf,
  yaxis = qn_yaxis_sf,
  zaxis = qn_zaxis_sf,
  camera = qn_camera_sf
)
qn_legend_sf <- list(orientation = "h")
plotly::plot_ly() |>
  plotly::add_surface(
    x = qn_x_sf,
    y = qn_y_sf,
    z = qn_z_sf,
    colorscale = qn_scale_sf,
    showscale = FALSE,
    opacity = 0.7
  ) |>
  plotly::add_markers(
    data = qn_pts_sf,
    x = ~x,
    y = ~y,
    z = ~z,
    text = ~label,
    hoverinfo = "text",
    showlegend = FALSE,
    marker = qn_marker_sf
  ) |>
  plotly::layout(scene = qn_scene_sf, legend = qn_legend_sf)
[Code]
import html
import numpy as np
import plotly.graph_objects as go

fig_alt = (
    "Surface plot of the quadratic function f over first coordinates from -0.4 "
    "to 0.6 and second coordinates from -0.2 to 1, a bowl-shaped surface whose "
    "lowest point is above the point (0.09, 0.64). Three markers lie on the "
    "surface. A blue circle at the origin is the starting point, a vermilion "
    "circle above (0.25, 0.5) is the iterate after one step, and a blue square "
    "above (0.09, 0.64) is the minimizer, at the bottom of the bowl."
)

qn_x_3d = np.linspace(-0.4, 0.6, 101)
qn_y_3d = np.linspace(-0.2, 1, 101)
qn_xx_3d, qn_yy_3d = np.meshgrid(qn_x_3d, qn_y_3d)


def qn_f_3d(x, y):
    return 0.5 * (4 * x**2 + 2 * x * y + 3 * y**2) - x - 2 * y


qn_pts_x_3d = np.array([0, 0.25, 1 / 11])
qn_pts_y_3d = np.array([0, 0.5, 7 / 11])
qn_pts_z_3d = qn_f_3d(qn_pts_x_3d, qn_pts_y_3d)
qn_marks_3d = [
    ("start", "#0072B2", "circle"),
    ("after one step", "#D55E00", "circle"),
    ("minimizer", "#0072B2", "square"),
]
fig = go.Figure(data=[
    go.Surface(
        x=qn_x_3d,
        y=qn_y_3d,
        z=qn_f_3d(qn_xx_3d, qn_yy_3d),
        colorscale=[[0, "#E5E5E5"], [1, "#808080"]],
        showscale=False,
        opacity=0.6,
        showlegend=False,
    ),
])
for i, (name, color, symbol) in enumerate(qn_marks_3d):
    fig.add_trace(go.Scatter3d(
        x=[qn_pts_x_3d[i]], y=[qn_pts_y_3d[i]], z=[qn_pts_z_3d[i]],
        mode="markers",
        marker=dict(color=color, size=4, symbol=symbol), name=name));
fig.update_layout(
    scene=dict(
        xaxis_title="first coordinate",
        yaxis_title="second coordinate",
        zaxis_title="f(x)",
        camera=dict(eye=dict(x=1.6, y=-1.6, z=0.9)),
    ),
    legend=dict(orientation="h"),
);
print(
    "```{=html}\n"
    + f'<div role="img" aria-label="{html.escape(fig_alt)}">\n'
    + fig.to_html(full_html=False, include_plotlyjs="cdn")
    + "\n</div>\n```"
)