[Code]
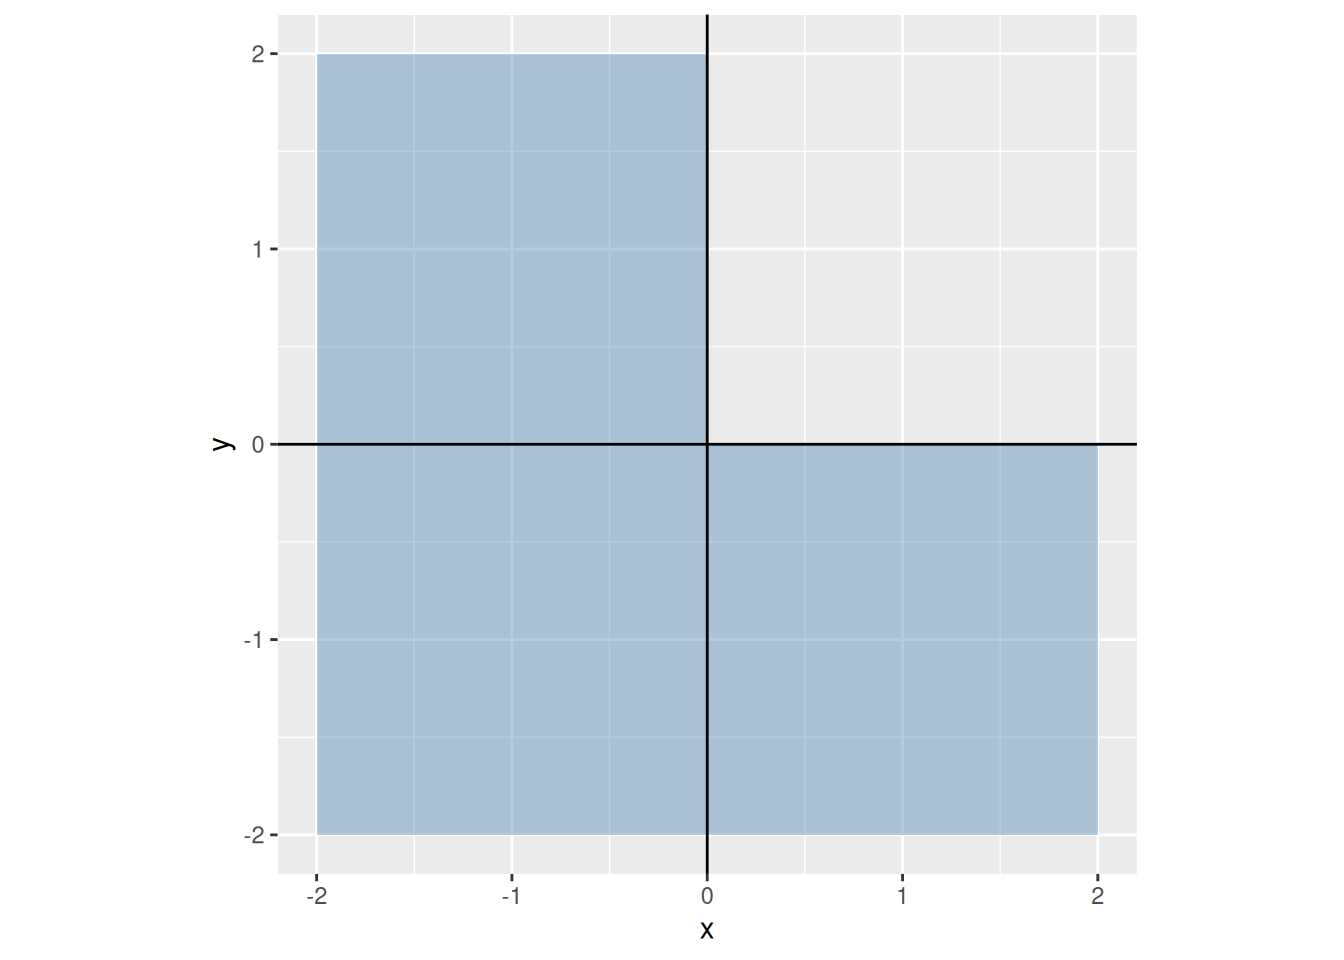
# the region x <= 0 or y <= 0, as two rectangles:
# the left half, and the bottom right quarter
regions <- tibble::tibble(
  xmin = c(-2, 0),
  xmax = c(0, 2),
  ymin = c(-2, -2),
  ymax = c(2, 0)
)

region_plot <- ggplot2::ggplot(regions) +
  ggplot2::geom_rect(
    ggplot2::aes(xmin = xmin, xmax = xmax, ymin = ymin, ymax = ymax),
    fill = "steelblue",
    alpha = 0.4
  ) +
  ggplot2::geom_hline(yintercept = 0) +
  ggplot2::geom_vline(xintercept = 0) +
  ggplot2::coord_equal() +
  ggplot2::labs(x = "x", y = "y")

region_plot